This tutorial document describes what DCE Cradle is, how we can use it, how we extend it.
Hajime Tazaki, Frederic Urbani, Thierry Turletti
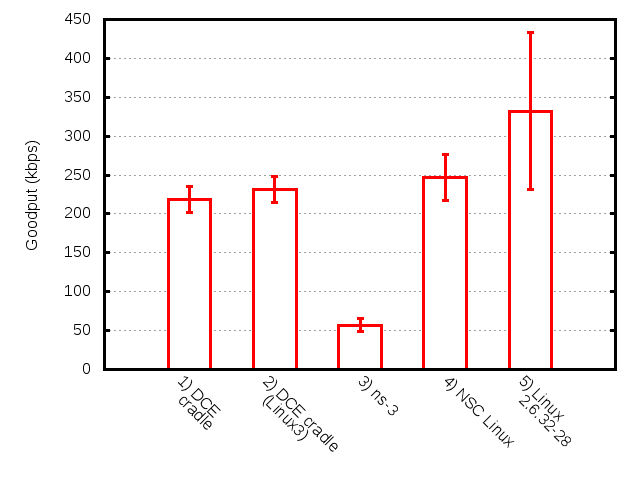
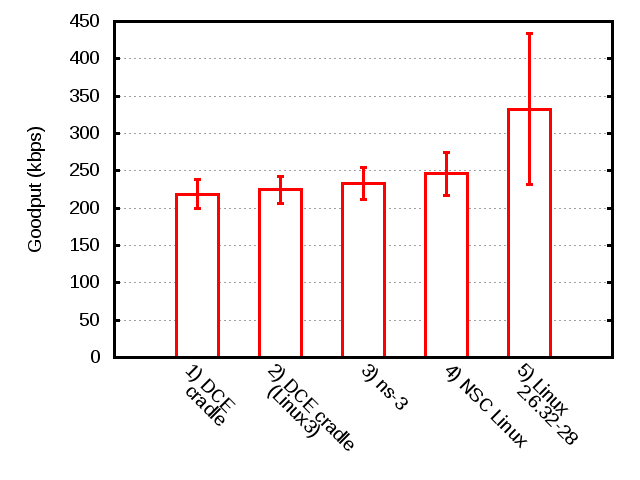
TCP goodput performance in DCE Cradle shows similar results with real network configuration and software on Linux.
The paper describing this text was submitted to Workshop on ns-3 2013 (under review).
Hajime Tazaki (tazaki at nict.go.jp)
DCE Cradle allows us to use ns-3 native application with Linux kerne as a network stack. The key question is: how different/similar DCE Cradle behaves ? This tutorial tries to answer this question with showing TCP goodput performance.
We need to prepare the following simulation codes to conduct the experiment.
While the experimentation with ns-3 native TCP stack shows about 83% less bandwidth than with the real environment, NSC and DCE Cradle obtain more realistic performance (only 25-30% less bandwidth than with the real environment) under the simple dumbbel topology scenario.
(News) If we changed the default variables of ns-3 TCP stack as follows, the result of goodput has improved.
Config::SetDefault ("ns3::TcpSocket::SegmentSize", UintegerValue (1448));
Config::SetDefault ("ns3::TcpSocket::DelAckCount", UintegerValue (1));
Experiment on ns-3
Setup ns-3-dce
% mkdir dce-cradle-test
% cd dce-cradle-test
% hg clone -r 327 http://code.nsnam.org/furbani/ns-3-dce
% ./utils/clone_and_compile_ns3_dce.sh
for more information, see the DCE documentation.
patch DCE Cradle extension
% cd dce-cradle-test
% wget https://codereview.appspot.com/download/issue6856090_7001.diff
% cd ns-3-dce
% patch -p1 < ../issue6856090_7001.diff
% ./waf
% ./waf install
prepare Network Simulation Cradle
% cd dce-cradle-test
% wget http://research.wand.net.nz/software/nsc/nsc-0.5.3.tar.bz2
% tar xfj nsc-0.5.3.tar.bz2
% mv nsc-0.5.3 nsc
% cd nsc
% ./scons.py
% cp lib/liblinux2.6.26.so ../build/lib/
% cd ..
% cd ns-3-dev
% /waf configure --prefix=`pwd`/../build --with-nsc=../nsc
% ./waf
% ./waf install
run a script
#!/bin/sh
OUTPUT="output/`date \"+%y%m%d_%H%M\"`"
mkdir -p ${OUTPUT}
TRIAL="`seq 1 100`"
TRIAL_TIME="`seq 1 5`"
NODES="`seq 1 2 100`"
DURATIONS="`seq 10 10 400`"
STACKS="dce dce-linux3 ns3 nsc-linux dce-dccp dce-dccp3"
PCAP=""

for stack in $STACKS
do
for trial in $TRIAL
do
if [ $trial -eq 1 ] ; then
PCAP="--enablePcap=1"
else
PCAP="--enablePcap=0"
fi

echo -n "$stack $trial " >>$OUTPUT/goodput.txt
NS_ATTRIBUTE_DEFAULT='ns3::TaskManager::FiberManagerType=UcontextFiberManager' ./build/bin/dce-runner ./build/bin/dce-tcp-ns3-nsc-comparison --stack=$stack --seed=$trial ${PCAP} --stopTime=64 | awk '{print $6}' | sed s/\(// >> $OUTPUT/goodput.txt
done

done
Experiment on Linux real network
prepare dumbbell topology
node1              node5
    \              /
   node3 ======== node4
    /              \
node2              node6
configure bottleneck link
at node3, packet loss and delay are configured with tc.
sudo tc qdisc add dev eth0 root handle 1:0 tbf limit 15Kb buffer 10Kb/8 rate 2Mbit
sudo tc qdisc add dev eth0 parent 1:0 handle 10: netem delay 100ms loss 5%
sudo sysctl -w net.ipv4.ip_forward=1
at node4, packet loss and delay are configured with tc as well.
sudo tc qdisc add dev eth0 root handle 1:0 tbf limit 15Kb buffer 10Kb/8 rate 2Mbit
sudo tc qdisc add dev eth0 parent 1:0 handle 10: netem delay 100ms loss 5%
sudo sysctl -w net.ipv4.ip_forward=1
run a script at node1
TRIAL="`seq 1 100`"
OUTPUT="output/`date \"+%y%m%d_%H%M\"`"

mkdir -p ${OUTPUT}

# TCP test
ssh -f 192.168.39.5 iperf -s -p 5001 > /dev/null
ssh -f 192.168.39.6 iperf -s -p 5001 > /dev/null


for trial in $TRIAL
do

# for tcp
stack="tcp-linux"
echo -n "$stack $trial " >>$OUTPUT/goodput.txt
ssh 192.168.39.1 iperf -p 5001 -c 10.2.0.2  -t 60 -l 1024 -x MS -y c  | cut -d ',' -f 9 >> $OUTPUT/
goodput.txt &
ssh 192.168.39.2 iperf -p 5001 -c 10.2.1.2  -t 60 -l 1024 -x MS -y c > /dev/null  &
wait
wait

done


ssh -f 192.168.39.5 pkill iperf

ssh -f 192.168.39.6 pkill iperf
Plot the results of above experiment
run a script
You can gather the text outputs from the above experiments and plot the figure with gnuplot.
#!/bin/bash

#set -x
OUTPUT=$1

mkdir -p ${OUTPUT}

TRIAL="`seq 1 100`"
STACKS="dce dce-linux3 ns3 nsc-linux"

# for Stack - Kbps (TCP)
cat ${OUTPUT}/goodput.txt | dbcoldefine exp seed bps |dbmultistats -k exp bps |dbcol exp mean stddev | grep -v dccp > ${OUTPUT}/goodput.dat
cat ${OUTPUT}/121120_1701/goodput.txt | dbcoldefine exp seed bps |dbmultistats -k exp bps |dbcol exp mean stddev | grep -v dccp >> ${OUTPUT}/goodput.dat

gnuplot  << EndGNUPLOT
set ylabel "Goodput (kbps)"
set terminal postscript eps lw 3 "Helvetica" 24
set output "${OUTPUT}/goodput.eps"
set xrange [-1:5]
set xtics font "Helvetica,14"
set xtics ("1) DCE\ncradle" 0,  "2) DCE cradle\n(Linux3)" 1, "3) ns-3" 2, "4) NSC Linux" 3, "5) Linux\n2.6.32-28" 4)
set style fill pattern
set boxwidth 0.5
set pointsize 2
set xzeroaxis
set grid ytics

plot \
        '${OUTPUT}/goodput.dat' usi :(\$2/1000):(\$3/1000) notitle w boxerrorbars

set terminal png lw 3 16
set xtics nomirror rotate by -45 font ",16"
set output "${OUTPUT}/goodput-dce-cradle-tcp.png"
replot

quit
EndGNUPLOT