
3.4.5. Aggregators
This section details the functionalities provided by the Aggregator class to an ns-3 simulation. This section is meant for users interested in developing simulations with the ns-3 tools and using the Data Collection Framework, of which the Aggregator class is a part, to generate data output with their simulation’s results.
3.4.5.1. Aggregator Overview
An Aggregator object is supposed to be hooked to one or more trace sources in order to receive input. Aggregators are the end point of the data collected by the network of Probes and Collectors during the simulation. It is the Aggregator’s job to take these values and transform them into their final output format such as plain text files, spreadsheet files, plots, or databases.
Typically, an aggregator is connected to one or more Collectors. In this manner, whenever the Collectors’ trace sources export new values, the Aggregator can process the value so that it can be used in the final output format where the data values will reside after the simulation.
Note the following about Aggregators:
Aggregators may be dynamically turned on and off during the simulation with calls to
Enable()andDisable(). For example, the aggregating of data may be turned off during the simulation warmup phase, which means those values won’t be included in the final output medium.Aggregators receive data from Collectors via callbacks. When a Collector is associated to an aggregator, a call to TraceConnect is made to establish the Aggregator’s trace sink method as a callback.
To date, two Aggregators have been implemented:
GnuplotAggregator
FileAggregator
3.4.5.2. GnuplotAggregator
The GnuplotAggregator produces output files used to make gnuplots.
The GnuplotAggregator will create 3 different files at the end of the simulation:
A space separated gnuplot data file
A gnuplot control file
A shell script to generate the gnuplot
3.4.5.2.1. Creation
An object of type GnuplotAggregator will be created here to show what needs to be done.
One declares a GnuplotAggregator in dynamic memory by using the smart
pointer class (Ptr<T>). To create a GnuplotAggregator in dynamic
memory with smart pointers, one just needs to call the ns-3 method
CreateObject(). The following code from
src/stats/examples/gnuplot-aggregator-example.cc shows
how to do this:
string fileNameWithoutExtension = "gnuplot-aggregator";

// Create an aggregator.
Ptr<GnuplotAggregator> aggregator =
  CreateObject<GnuplotAggregator>(fileNameWithoutExtension);
The first argument for the constructor, fileNameWithoutExtension, is the name of the gnuplot related files to write with no extension. This GnuplotAggregator will create a space separated gnuplot data file named “gnuplot-aggregator.dat”, a gnuplot control file named “gnuplot-aggregator.plt”, and a shell script to generate the gnuplot named + “gnuplot-aggregator.sh”.
The gnuplot that is created can have its key in 4 different locations:
No key
Key inside the plot (the default)
Key above the plot
Key below the plot
The following gnuplot key location enum values are allowed to specify the key’s position:
enum KeyLocation {
  NO_KEY,
  KEY_INSIDE,
  KEY_ABOVE,
  KEY_BELOW
};
If it was desired to have the key below rather than the default position of inside, then you could do the following.
aggregator->SetKeyLocation(GnuplotAggregator::KEY_BELOW);
3.4.5.2.2. Examples
One example will be discussed in detail here:
Gnuplot Aggregator Example
3.4.5.2.2.1. Gnuplot Aggregator Example
An example that exercises the GnuplotAggregator can be found in
src/stats/examples/gnuplot-aggregator-example.cc.
The following 2-D gnuplot was created using the example.
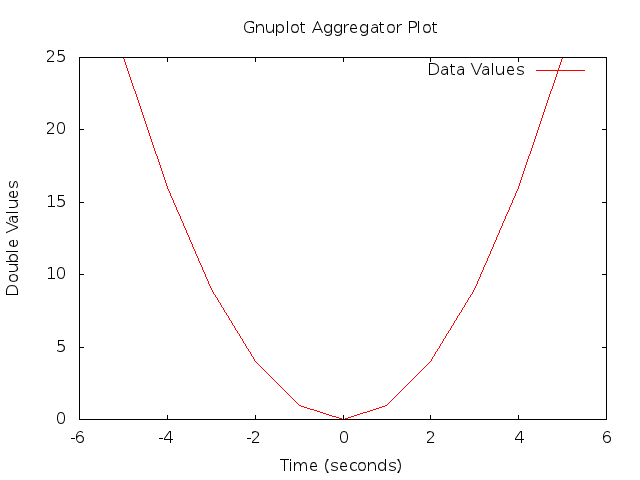
2-D Gnuplot Created by gnuplot-aggregator-example.cc Example.
This code from the example shows how to construct the GnuplotAggregator as was discussed above.
void Create2dPlot()
{
  std::string fileNameWithoutExtension = "gnuplot-aggregator";
  std::string plotTitle                = "Gnuplot Aggregator Plot";
  std::string plotXAxisHeading         = "Time(seconds)";
  std::string plotYAxisHeading         = "Double Values";
  std::string plotDatasetLabel         = "Data Values";
  std::string datasetContext           = "Dataset/Context/String";

  // Create an aggregator.
  Ptr<GnuplotAggregator> aggregator =
    CreateObject<GnuplotAggregator>(fileNameWithoutExtension);
Various GnuplotAggregator attributes are set including the 2-D dataset that will be plotted.
// Set the aggregator's properties.
aggregator->SetTerminal("png");
aggregator->SetTitle(plotTitle);
aggregator->SetLegend(plotXAxisHeading, plotYAxisHeading);

// Add a data set to the aggregator.
aggregator->Add2dDataset(datasetContext, plotDatasetLabel);

// aggregator must be turned on
aggregator->Enable();
Next, the 2-D values are calculated, and each one is individually
written to the GnuplotAggregator using the Write2d() function.
  double time;
  double value;

  // Create the 2-D dataset.
  for (time = -5.0; time <= +5.0; time += 1.0)
    {
      // Calculate the 2-D curve
      //
      //                   2
      //     value  =  time   .
      //
      value = time * time;

      // Add this point to the plot.
      aggregator->Write2d(datasetContext, time, value);
    }

  // Disable logging of data for the aggregator.
  aggregator->Disable();
}
3.4.5.3. FileAggregator
The FileAggregator sends the values it receives to a file.
The FileAggregator can create 4 different types of files:
Formatted
Space separated (the default)
Comma separated
Tab separated
Formatted files use C-style format strings and the sprintf() function to print their values in the file being written.
3.4.5.3.1. Creation
An object of type FileAggregator will be created here to show what needs to be done.
One declares a FileAggregator in dynamic memory by using the smart
pointer class (Ptr<T>). To create a FileAggregator in dynamic memory
with smart pointers, one just needs to call the ns-3 method
CreateObject. The following code from
src/stats/examples/file-aggregator-example.cc shows how
to do this:
string fileName       = "file-aggregator-formatted-values.txt";

// Create an aggregator that will have formatted values.
Ptr<FileAggregator> aggregator =
  CreateObject<FileAggregator>(fileName, FileAggregator::FORMATTED);
The first argument for the constructor, filename, is the name of the file to write; the second argument, fileType, is type of file to write. This FileAggregator will create a file named “file-aggregator-formatted-values.txt” with its values printed as specified by fileType, i.e., formatted in this case.
The following file type enum values are allowed:
enum FileType {
  FORMATTED,
  SPACE_SEPARATED,
  COMMA_SEPARATED,
  TAB_SEPARATED
};
3.4.5.3.2. Examples
One example will be discussed in detail here:
File Aggregator Example
3.4.5.3.2.1. File Aggregator Example
An example that exercises the FileAggregator can be found in
src/stats/examples/file-aggregator-example.cc.
The following text file with 2 columns of values separated by commas was created using the example.
-5,25
-4,16
-3,9
-2,4
-1,1
0,0
1,1
2,4
3,9
4,16
5,25
This code from the example shows how to construct the FileAggregator as was discussed above.
void CreateCommaSeparatedFile()
{
  std::string fileName       = "file-aggregator-comma-separated.txt";
  std::string datasetContext = "Dataset/Context/String";

  // Create an aggregator.
  Ptr<FileAggregator> aggregator =
    CreateObject<FileAggregator>(fileName, FileAggregator::COMMA_SEPARATED);
FileAggregator attributes are set.
// aggregator must be turned on
aggregator->Enable();
Next, the 2-D values are calculated, and each one is individually
written to the FileAggregator using the Write2d() function.
  double time;
  double value;

  // Create the 2-D dataset.
  for (time = -5.0; time <= +5.0; time += 1.0)
    {
      // Calculate the 2-D curve
      //
      //                   2
      //     value  =  time   .
      //
      value = time * time;

      // Add this point to the plot.
      aggregator->Write2d(datasetContext, time, value);
    }

  // Disable logging of data for the aggregator.
  aggregator->Disable();
}
The following text file with 2 columns of formatted values was also created using the example.
Time = -5.000e+00  Value = 25
Time = -4.000e+00  Value = 16
Time = -3.000e+00  Value = 9
Time = -2.000e+00  Value = 4
Time = -1.000e+00  Value = 1
Time = 0.000e+00   Value = 0
Time = 1.000e+00   Value = 1
Time = 2.000e+00   Value = 4
Time = 3.000e+00   Value = 9
Time = 4.000e+00   Value = 16
Time = 5.000e+00   Value = 25
This code from the example shows how to construct the FileAggregator as was discussed above.
void CreateFormattedFile()
{
  std::string fileName       = "file-aggregator-formatted-values.txt";
  std::string datasetContext = "Dataset/Context/String";

  // Create an aggregator that will have formatted values.
  Ptr<FileAggregator> aggregator =
    CreateObject<FileAggregator>(fileName, FileAggregator::FORMATTED);
FileAggregator attributes are set, including the C-style format string to use.
// Set the format for the values.
aggregator->Set2dFormat("Time = %.3e\tValue = %.0f");

// aggregator must be turned on
aggregator->Enable();
Next, the 2-D values are calculated, and each one is individually
written to the FileAggregator using the Write2d() function.
  double time;
  double value;

  // Create the 2-D dataset.
  for (time = -5.0; time <= +5.0; time += 1.0)
    {
      // Calculate the 2-D curve
      //
      //                   2
      //     value  =  time   .
      //
      value = time * time;

      // Add this point to the plot.
      aggregator->Write2d(datasetContext, time, value);
    }

  // Disable logging of data for the aggregator.
  aggregator->Disable();
}