Memory profiling is essential to identify issues that
may cause memory corruption, which may lead to all sorts of
side-effects, such as crashing after many hours of simulation and
producing wrong results that invalidate the entire simulation.
It also can help tracking sources of excessive memory allocations,
the size of these allocations and memory usage during simulation.
These can affect simulation performance, or limit the complexity
and the number of concurrent simulations.
Performance profiling on the other hand is essential for
high-performance applications, as it allows for the identification
of bottlenecks and their mitigation.
Another type of profiling is related to system calls. They
can be used to debug issues and identify hotspots that
may cause performance issues in specific conditions. Excessive
calls results in more context switches, which interrupt the
simulations, ultimately slowing them down.
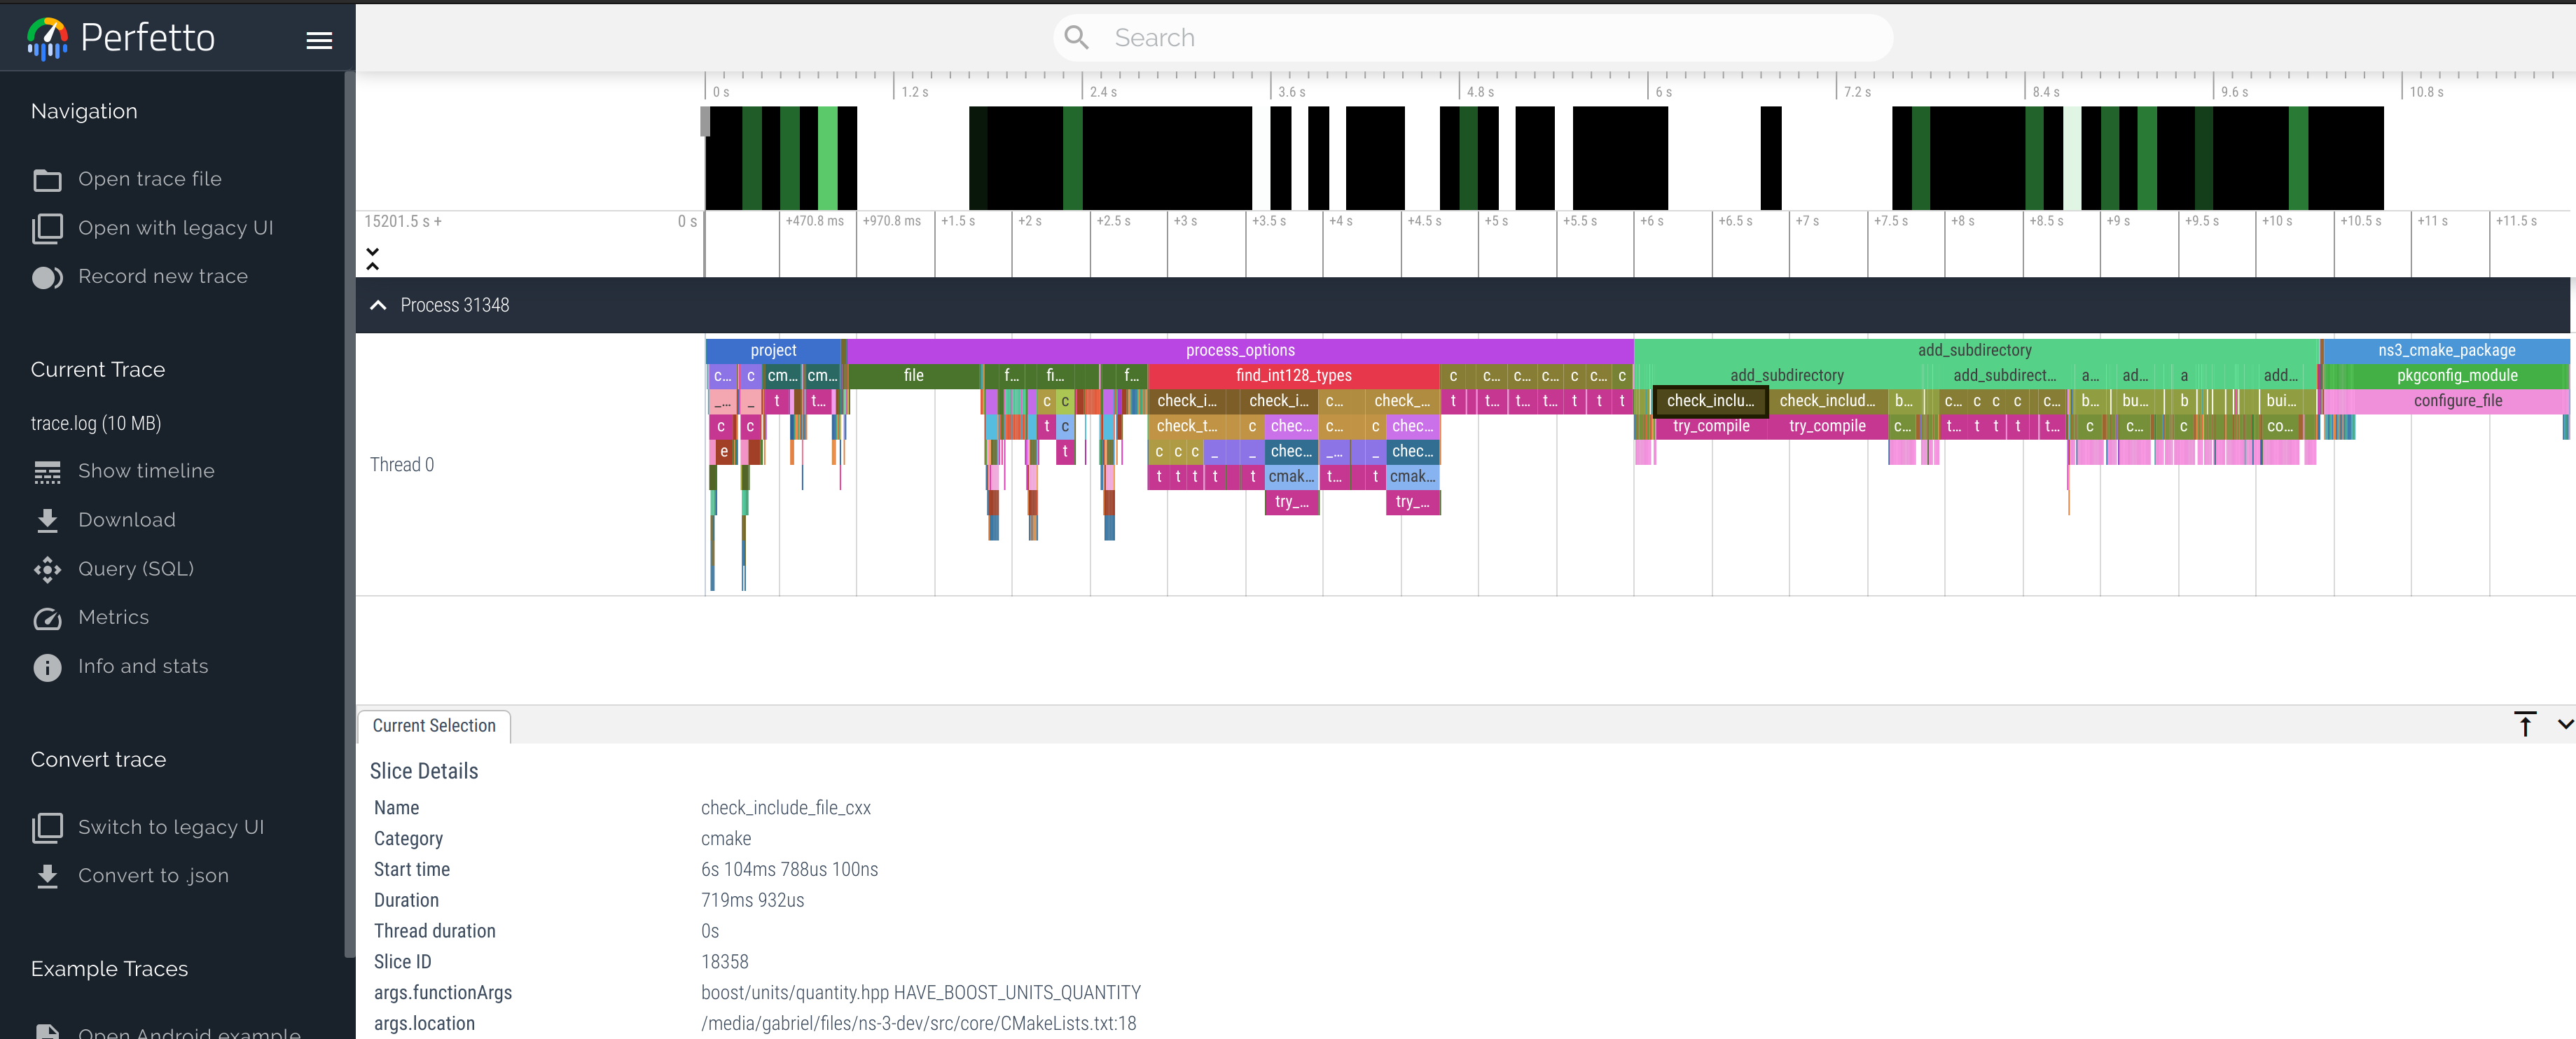
Other than profiling the simulations, which can highlight bottlenecks
in the simulator, we can also profile the compilation process.
This allows us to identify and fix bottlenecks, which speed up
build times.
4.9.1. Memory ProfilersMemory profilers are tools that help identifying memory related
issues.
There are two well known tools for finding bugs such as uninitialized memory usage,
out-of-bound accesses, dereferencing null pointers and other memory-related bugs:
Valgrind
Pros: very rich tooling, no need to recompile programs to profile the program.
Cons: very slow and limited to Linux and MacOS.
Sanitizers
Pros: sanitizers are distributed along with compilers, such as GCC, Clang and MSVC.
They are widely available, cross platform and faster than Valgrind.
Cons: false positives, high memory usage, memory sanitizer is incompatible
with other sanitizers (e.g. address sanitizer), requiring two instrumented
compilations and two test runs. The memory sanitizer requires Clang.
There are also tools to count memory allocations, track memory usage and memory leaks,
such as: Heaptrack , MacOS’s leaks , Bytehound and gperftools .
An overview on how to use Valgrind , Sanitizers and
Heaptrack is provided in the following sections.
4.9.1.1. ValgrindValgrind is suite of profiling tools, being the main tool called Memcheck.
To check for memory errors including leaks, one can call valgrind directly:
valgrind --leak-check=yes ./relative/path/to/program argument1 argument2
Or can use the ns3
./ns3 run "program argument1 argument2" --valgrind
Additional Valgrind options are listed on its manual .
4.9.1.2. SanitizersSanitizers are a suite of libraries made by Google and part of the LLVM project,
used to profile programs at runtime and find issues related to undefined behavior,
memory corruption (out-of-bound access, uninitialized memory use), leaks, race
conditions and others.
Sanitizers are shipped with most modern compilers and can be used by instructing the
compiler to link the required libraries and instrument the code.
To build ns-3 with sanitizers, enable the NS3_SANITIZE
~/ns-3-dev/cmake_cache/$ cmake -DNS3_SANITIZE=ON ..
Or via the ns3
~/ns-3-dev$ ./ns3 configure --enable-sanitizers
The memory sanitizer can be enabled with NS3_SANITIZE_MEMORY NS3_SANITIZE
Sanitizers were used to find issues in multiple occasions:
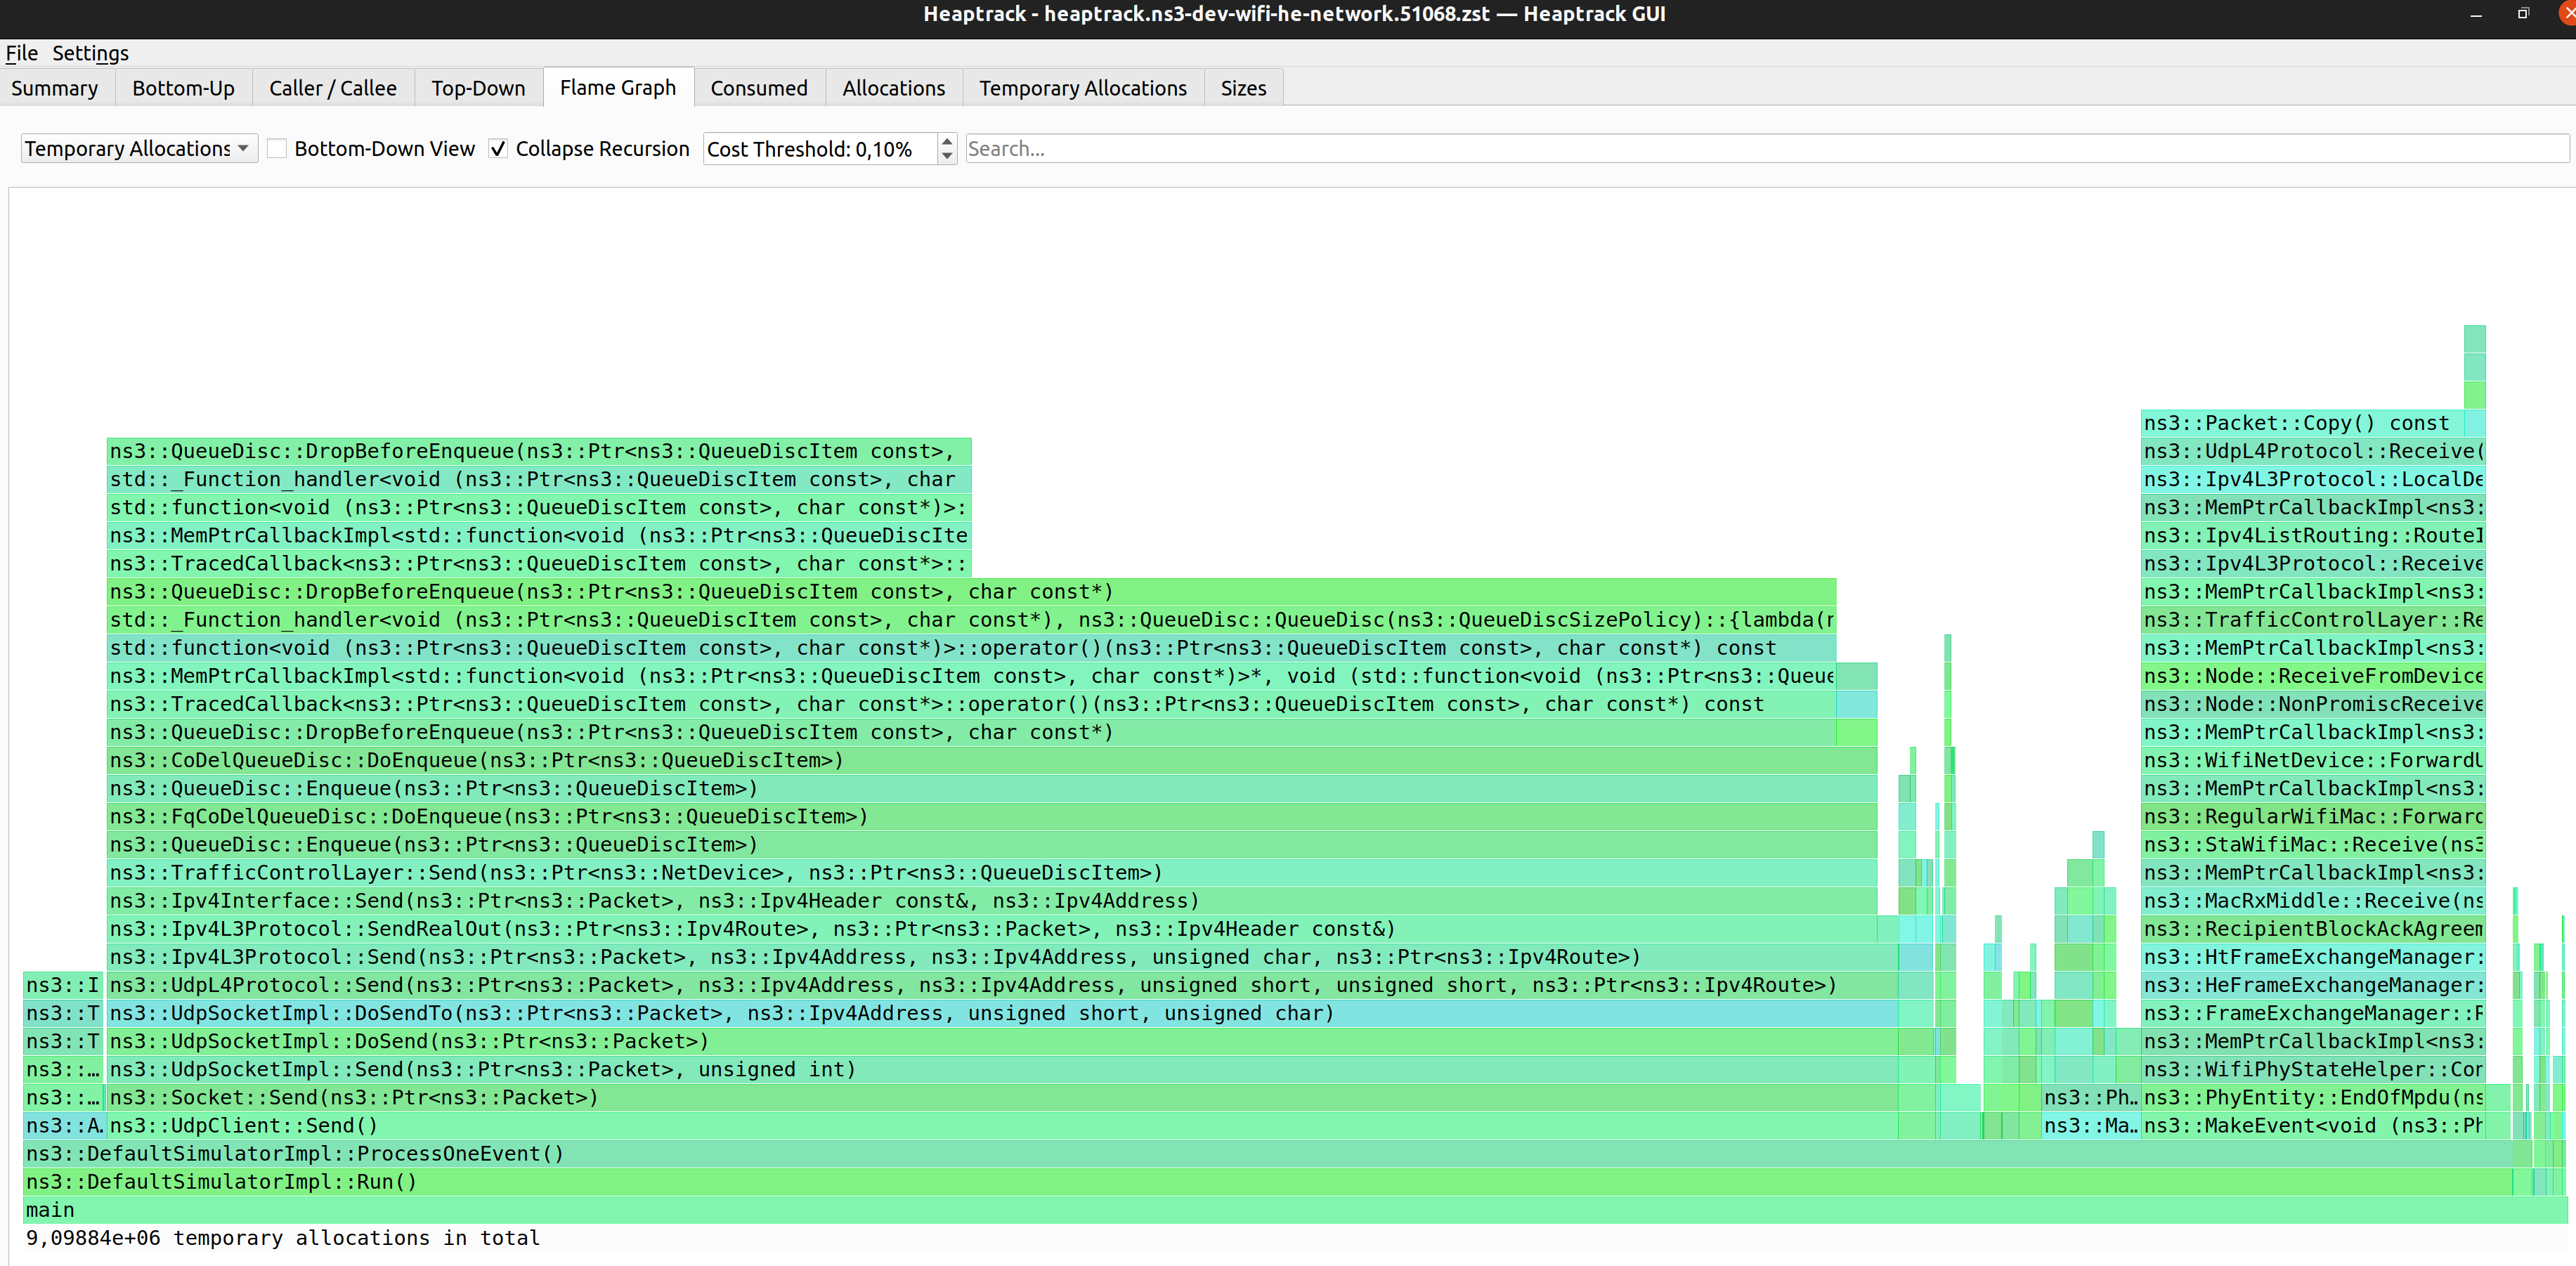
4.9.1.3. HeaptrackHeaptrack is an utility made by KDE to trace memory allocations
along with stack traces, allowing developers to identify code responsible
for possible memory leaks and unnecessary allocations.
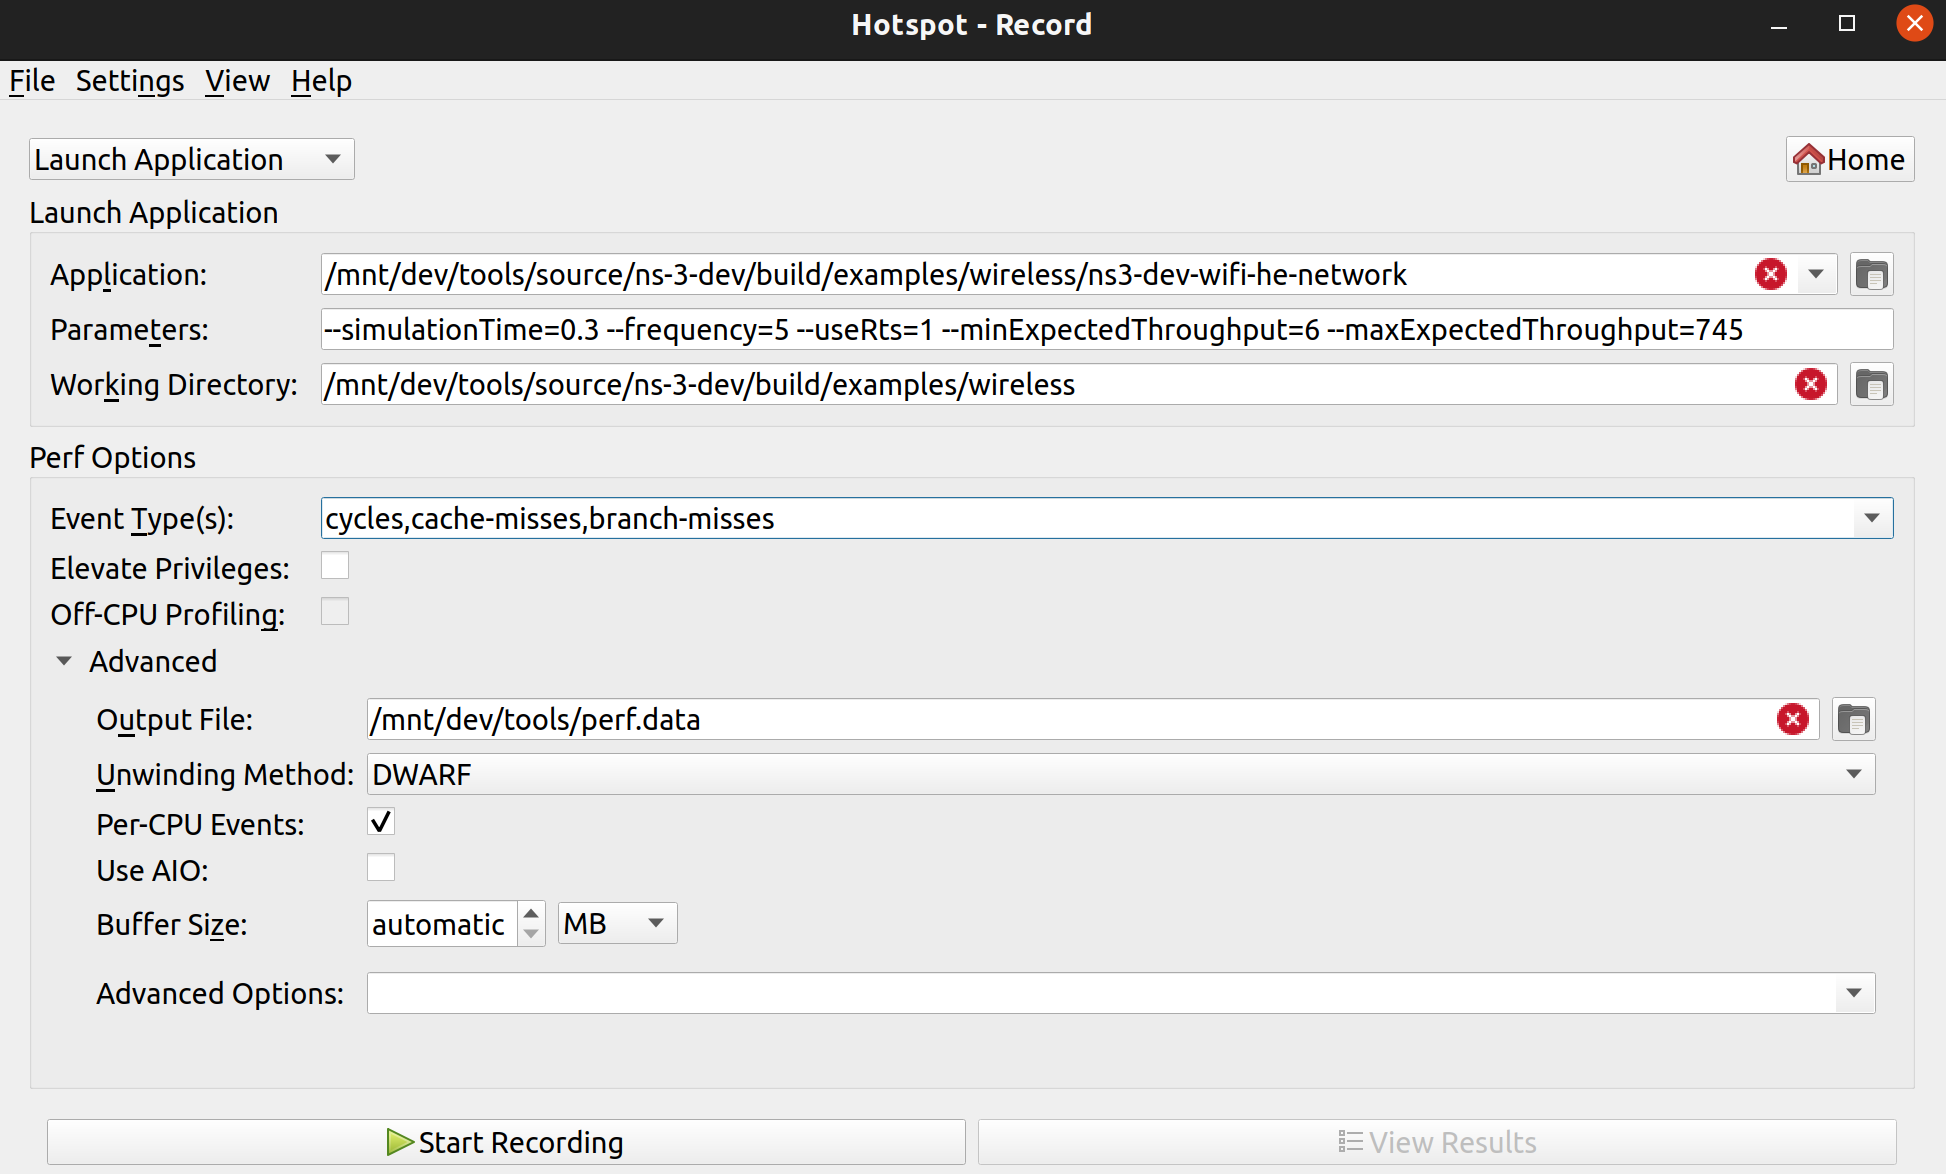
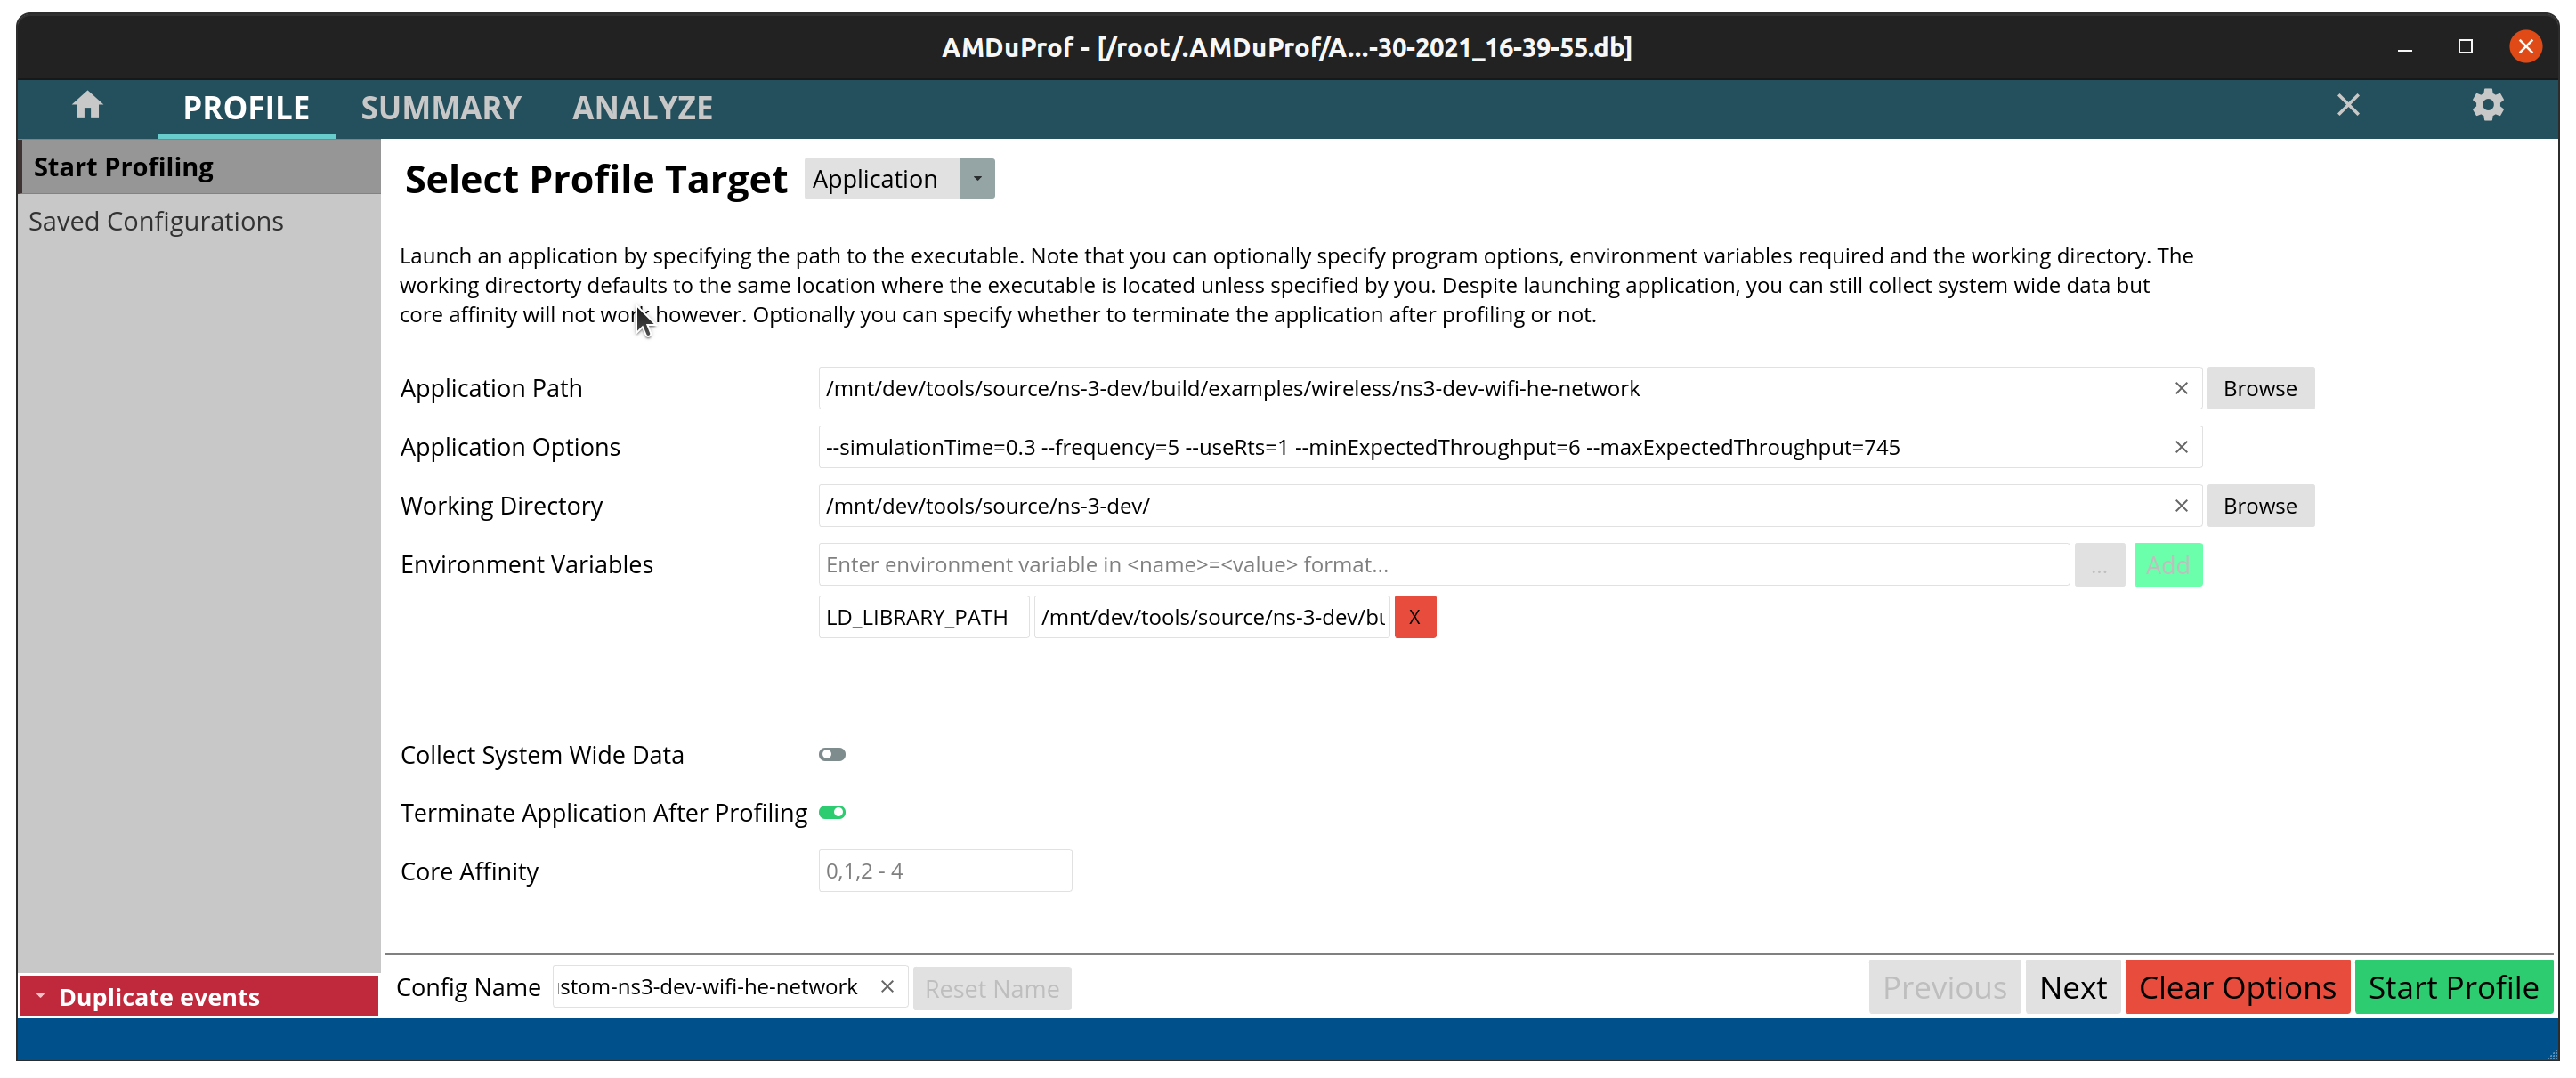
For the examples below we used the default configuration of ns-3,
with the output going to the build wifi-he-network ./build/examples/wireless/ns3-dev-wifi-he-network ./ns3 run wifi-he-network
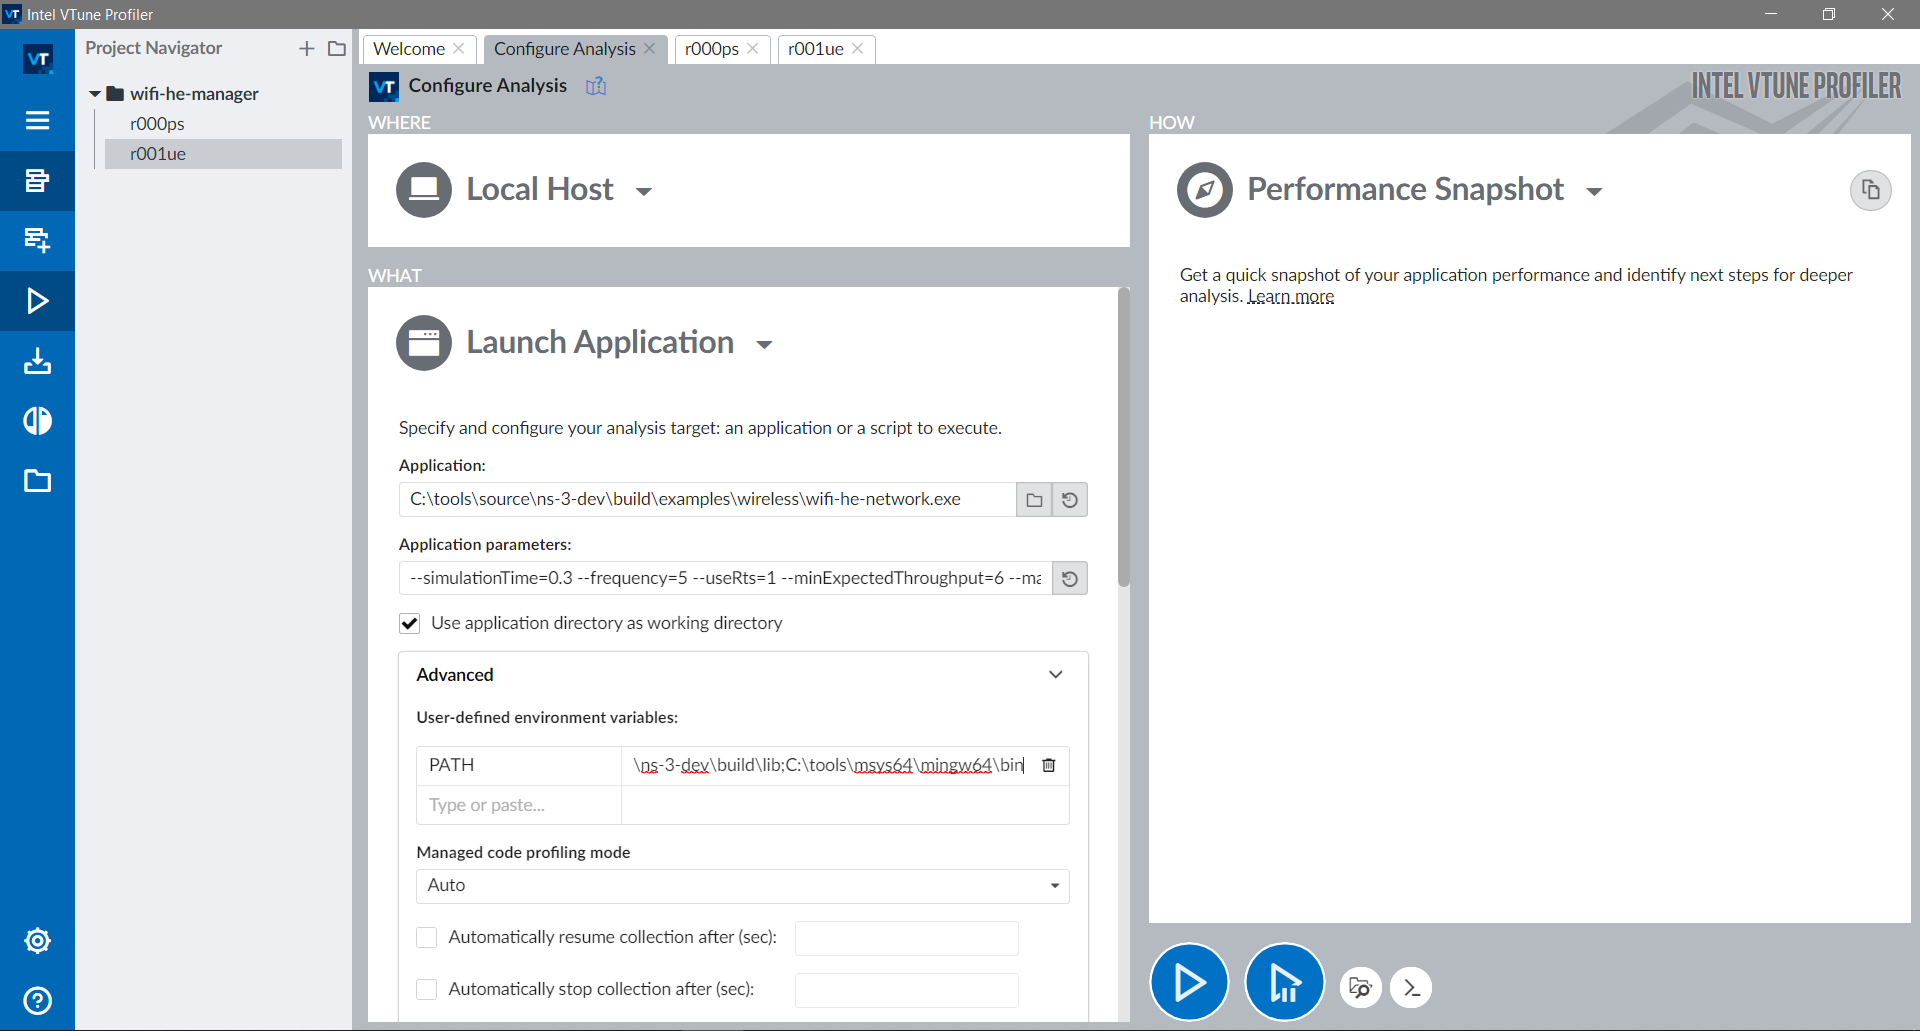
To collect information of a program (in this case the wifi-he-network
~ns-3-dev/$ heaptrack ./build/examples/wireless/ns3-dev-wifi-he-network --simulationTime=0.3 --frequency=5 --useRts=1 --minExpectedThroughput=6 --maxExpectedThroughput=745
If you prefer to use the ns3
~ns-3-dev/$ ./ns3 run "wifi-he-network --simulationTime=0.3 --frequency=5 --useRts=1 --minExpectedThroughput=6 --maxExpectedThroughput=745" --heaptrack --no-build
In both cases, heaptrack will print to the terminal the output file:
~ns-3-dev/$ ./ns3 run "wifi-he-network --simulationTime=0.3 --frequency=5 --useRts=1 --minExpectedThroughput=6 --maxExpectedThroughput=745" --heaptrack --no-build
heaptrack output will be written to "~ns-3-dev/heaptrack.ns3-dev-wifi-he-network.210305.zst"
starting application, this might take some time...
MCS value               Channel width           GI                      Throughput
0                       20 MHz                  3200 ns                 5.91733 Mbit/s
0                       20 MHz                  1600 ns                 5.91733 Mbit/s
...
11                      160 MHz                 1600 ns                 479.061 Mbit/s
11                      160 MHz                 800 ns                  524.459 Mbit/s
heaptrack stats:
        allocations:            149185947
        leaked allocations:     10467
        temporary allocations:  21145932
Heaptrack finished! Now run the following to investigate the data:

    heaptrack --analyze "~/ns-3-dev/heaptrack.ns3-dev-wifi-he-network.210305.zst"
The output above shows a summary of the stats collected: ~149 million allocations,
~21 million temporary allocations and ~10 thousand possible leaked allocations.
If heaptrack-gui heaptrack
~/ns-3-dev$ heaptrack --analyze "~/ns-3-dev/heaptrack.ns3-dev-wifi-he-network.210305.zst"
reading file "~/ns-3-dev/heaptrack.ns3-dev-wifi-he-network.210305.zst" - please wait, this might take some time...
Debuggee command was: ~/ns-3-dev/build/examples/wireless/ns3-dev-wifi-he-network --simulationTime=0.3 --frequency=5 --useRts=1 --minExpectedThroughput=6 --maxExpectedThroughput=745
finished reading file, now analyzing data:

MOST CALLS TO ALLOCATION FUNCTIONS
23447502 calls to allocation functions with 1.12MB peak consumption from
ns3::Packet::Copy() const
in ~/ns-3-dev/build/lib/libns3-dev-network.so
4320000 calls with 0B peak consumption from:
    ns3::UdpSocketImpl::DoSendTo(ns3::Ptr<>, ns3::Ipv4Address, unsigned short, unsigned char)
    in ~/ns-3-dev/build/lib/libns3-dev-internet.so
    ns3::UdpSocketImpl::DoSend(ns3::Ptr<>)
    in ~/ns-3-dev/build/lib/libns3-dev-internet.so
    ns3::UdpSocketImpl::Send(ns3::Ptr<>, unsigned int)
    in ~/ns-3-dev/build/lib/libns3-dev-internet.so
    ns3::Socket::Send(ns3::Ptr<>)
    in ~/ns-3-dev/build/lib/libns3-dev-network.so
    ns3::UdpClient::Send()
    in ~/ns-3-dev/build/lib/libns3-dev-applications.so
    ns3::DefaultSimulatorImpl::ProcessOneEvent()
    in ~/ns-3-dev/build/lib/libns3-dev-core.so
    ns3::DefaultSimulatorImpl::Run()
    in ~/ns-3-dev/build/lib/libns3-dev-core.so
    main
    in ~/ns-3-dev/build/examples/wireless/ns3-dev-wifi-he-network

...

MOST TEMPORARY ALLOCATIONS
6182320 temporary allocations of 6182701 allocations in total (99.99%) from
ns3::QueueDisc::DropBeforeEnqueue(ns3::Ptr<>, char const*)
in ~/ns-3-dev/build/lib/libns3-dev-traffic-control.so
1545580 temporary allocations of 1545580 allocations in total (100.00%) from:
    std::_Function_handler<>::_M_invoke(std::_Any_data const&, ns3::Ptr<>&&, char const*&&)
    in ~/ns-3-dev/build/lib/libns3-dev-traffic-control.so
    std::function<>::operator()(ns3::Ptr<>, char const*) const
    in ~/ns-3-dev/build/lib/libns3-dev-traffic-control.so
    ns3::MemPtrCallbackImpl<>::operator()(ns3::Ptr<>, char const*)
    in ~/ns-3-dev/build/lib/libns3-dev-traffic-control.so
    ns3::TracedCallback<>::operator()(ns3::Ptr<>, char const*) const
    in ~/ns-3-dev/build/lib/libns3-dev-traffic-control.so
    ns3::QueueDisc::DropBeforeEnqueue(ns3::Ptr<>, char const*)
    in ~/ns-3-dev/build/lib/libns3-dev-traffic-control.so
    ns3::CoDelQueueDisc::DoEnqueue(ns3::Ptr<>)
    in ~/ns-3-dev/build/lib/libns3-dev-traffic-control.so
    ns3::QueueDisc::Enqueue(ns3::Ptr<>)
    in ~/ns-3-dev/build/lib/libns3-dev-traffic-control.so
    ns3::FqCoDelQueueDisc::DoEnqueue(ns3::Ptr<>)
    in ~/ns-3-dev/build/lib/libns3-dev-traffic-control.so
    ns3::QueueDisc::Enqueue(ns3::Ptr<>)
    in ~/ns-3-dev/build/lib/libns3-dev-traffic-control.so
    ns3::TrafficControlLayer::Send(ns3::Ptr<>, ns3::Ptr<>)
    in ~/ns-3-dev/build/lib/libns3-dev-traffic-control.so
    ns3::Ipv4Interface::Send(ns3::Ptr<>, ns3::Ipv4Header const&, ns3::Ipv4Address)
    in ~/ns-3-dev/build/lib/libns3-dev-internet.so
    ns3::Ipv4L3Protocol::SendRealOut(ns3::Ptr<>, ns3::Ptr<>, ns3::Ipv4Header const&)
    in ~/ns-3-dev/build/lib/libns3-dev-internet.so
    ns3::Ipv4L3Protocol::Send(ns3::Ptr<>, ns3::Ipv4Address, ns3::Ipv4Address, unsigned char, ns3::Ptr<>)
    in ~/ns-3-dev/build/lib/libns3-dev-internet.so
    ns3::UdpL4Protocol::Send(ns3::Ptr<>, ns3::Ipv4Address, ns3::Ipv4Address, unsigned short, unsigned short, ns3::Ptr<>)
    in ~/ns-3-dev/build/lib/libns3-dev-internet.so
    ns3::UdpSocketImpl::DoSendTo(ns3::Ptr<>, ns3::Ipv4Address, unsigned short, unsigned char)
    in ~/ns-3-dev/build/lib/libns3-dev-internet.so
    ns3::UdpSocketImpl::DoSend(ns3::Ptr<>)
    in ~/ns-3-dev/build/lib/libns3-dev-internet.so
    ns3::UdpSocketImpl::Send(ns3::Ptr<>, unsigned int)
    in ~/ns-3-dev/build/lib/libns3-dev-internet.so
    ns3::Socket::Send(ns3::Ptr<>)
    in ~/ns-3-dev/build/lib/libns3-dev-network.so
    ns3::UdpClient::Send()
    in ~/ns-3-dev/build/lib/libns3-dev-applications.so
    ns3::DefaultSimulatorImpl::ProcessOneEvent()
    in ~/ns-3-dev/build/lib/libns3-dev-core.so
    ns3::DefaultSimulatorImpl::Run()
    in ~/ns-3-dev/build/lib/libns3-dev-core.so
    main
    in ~/ns-3-dev/build/examples/wireless/ns3-dev-wifi-he-network

...

total runtime: 156.30s.
calls to allocation functions: 149185947 (954466/s)
temporary memory allocations: 21757614 (139201/s)
peak heap memory consumption: 4.87MB
peak RSS (including heaptrack overhead): 42.02MB
total memory leaked: 895.45KB
The terminal output above lists the most frequently called functions that allocated memory.
Here is a short description of what each line of the last block of the output means:
Allocation functions are all functions that allocated memory, either explicitly
via C-style malloc new
Temporary memory allocations are allocations that are followed by the
deallocation without modifying the data.
Peak heap memory is the maximum memory allocated by the program throughout its execution.
The memory allocator may reuse memory freed by previous destructors, del free
RSS is the Resident Set Size, which is the amount of physical memory occupied by the process.
Total memory leak refers to memory allocated but never freed. This includes static initialization,
so it is not uncommon to be different than 0KB. However this does not mean the program does not
have memory leaks. Other memory profilers such as Valgrind and memory sanitizers are better
suited to track down memory leaks.
Based on the stack trace, it is fairly easy to locate the corresponding code and act on it to
reduce the number of allocations.
In the case of ns3::QueueDisc::DropBeforeEnqueue char* std::less<> MR830 .
Heaptrack also has a GUI that provides the same information printed by the command line interface,
but in a more interactive way.
Heaptrack was used in merge request MR830 to track and reduce the number of allocations
in the wifi-he-network ./test.py -d -g
4.9.1.4. MemrayMemray is an utility made by Bloomberg to trace memory allocations of Python programs,
including native code called by them. Along with stack traces, developers can trace down
possible memory leaks and unnecessary allocations.
Note: Memray is ineffective for profiling the ns-3 python bindings since Cppyy hides away
the calls to the ns-3 module libraries. However, it is still useful for python scripts
in general, for example ones used to parse and consolidate simulation results.
The ns3 summary stats
~/ns-3-dev/$ ./ns3 run sample-rng-plot.py --memray
Writing profile results into memray.output
Memray WARNING: Correcting symbol for aligned_alloc from 0x7fd97023c890 to 0x7fd97102fce0
[memray] Successfully generated profile results.

You can now generate reports from the stored allocation records.
Some example commands to generate reports:

/usr/bin/python3 -m memray flamegraph memray.output
~/ns-3-dev$ /usr/bin/python3 -m memray stats memray.output
   Total allocations:
         5364235

   Total memory allocated:
         10.748GB

   Histogram of allocation size:
         min: 0.000B
         ----------------------------------------------
         < 8.000B   :  264149 |||
         < 78.000B  : 2051906 |||||||||||||||||||||||
         < 699.000B : 2270941 |||||||||||||||||||||||||
         < 6.064KB  :  608993 |||||||
         < 53.836KB :  165307 ||
         < 477.912KB:    2220 |
         < 4.143MB  :     511 |
         < 36.779MB :     188 |
         < 326.492MB:      19 |
         <=2.830GB  :       1 |
         ----------------------------------------------
         max: 2.830GB

   Allocator type distribution:
          MALLOC: 4647765
          CALLOC: 435525
          REALLOC: 277736
          POSIX_MEMALIGN: 2686
          MMAP: 523

   Top 5 largest allocating locations (by size):
         - include:/usr/local/lib/python3.10/dist-packages/cppyy/__init__.py:243 -> 8.814GB
         - <stack trace unavailable> -> 746.999MB
         - show:~/.local/lib/python3.10/site-packages/matplotlib/backends/backend_gtk4.py:340 -> 263.338MB
         - load_library:/usr/local/lib/python3.10/dist-packages/cppyy/__init__.py:235 -> 245.684MB
         - __init__:/usr/lib/python3.10/ctypes/__init__.py:374 -> 225.797MB

   Top 5 largest allocating locations (by number of allocations):
         - include:/usr/local/lib/python3.10/dist-packages/cppyy/__init__.py:243 -> 2246145
         - show:~/.local/lib/python3.10/site-packages/matplotlib/backends/backend_gtk4.py:340 -> 1264614
         - <stack trace unavailable> -> 1098543
         - __init__:~/.local/lib/python3.10/site-packages/matplotlib/backends/backend_gtk4.py:61 -> 89466
         - run:/usr/lib/python3/dist-packages/gi/overrides/Gio.py:42 -> 79582
4.9.2. Performance ProfilersPerformance profilers are programs that collect runtime information and help to
identify performance bottlenecks. In some cases, they can point out hotspots
and suggest solutions.
There are many tools to profile your program, including:
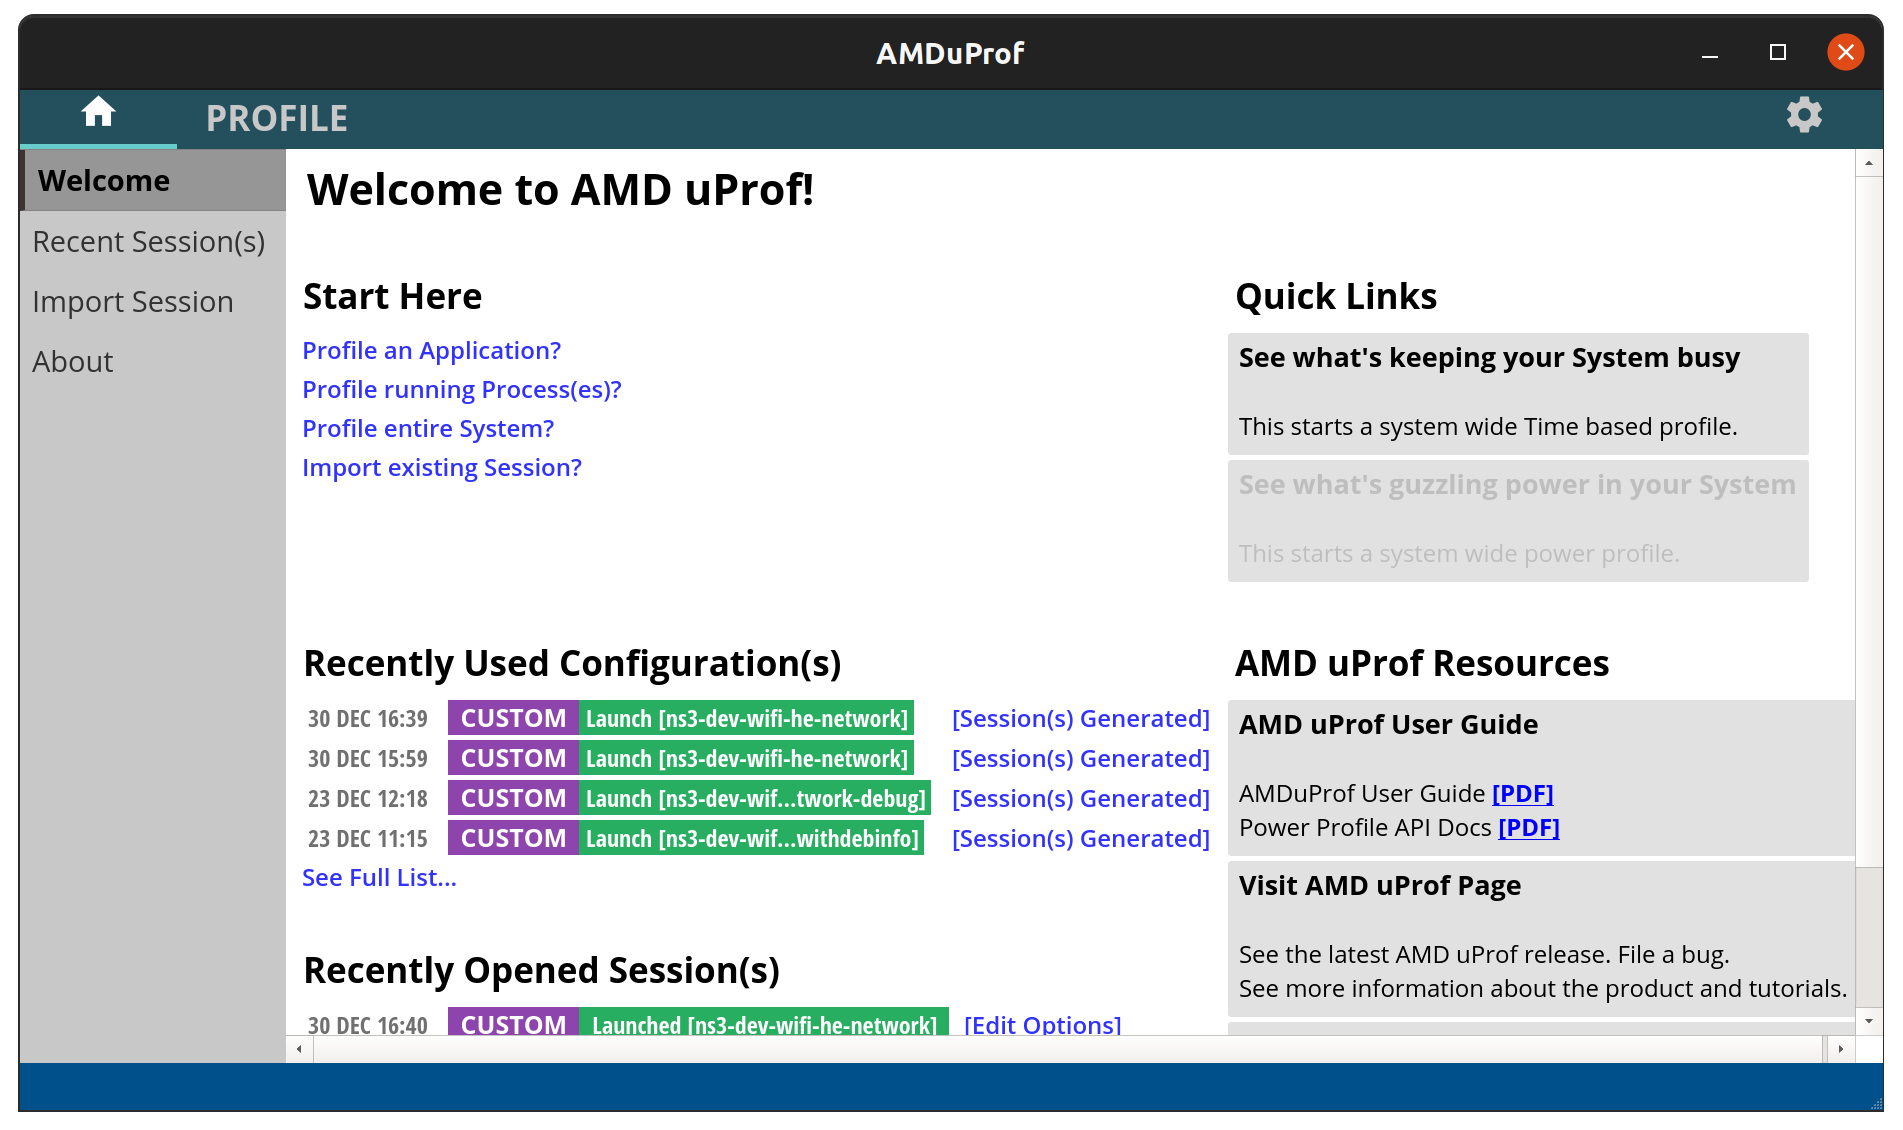
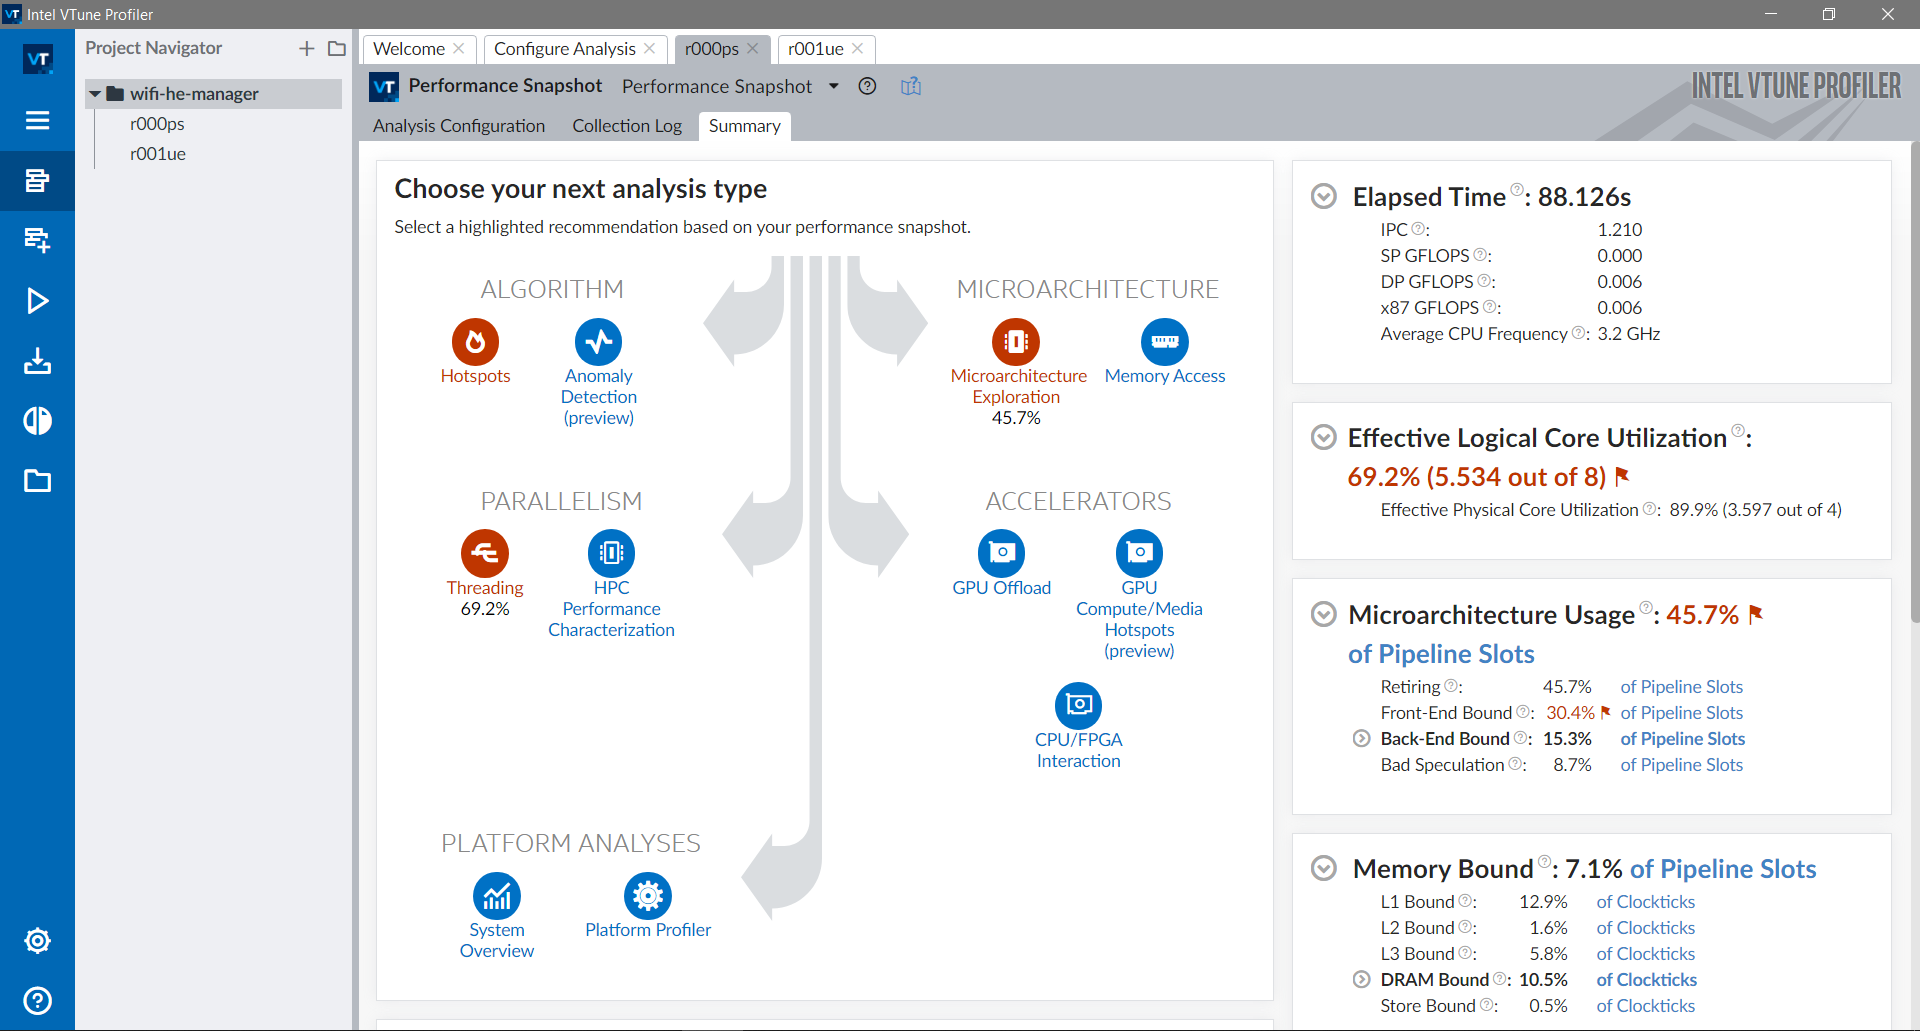
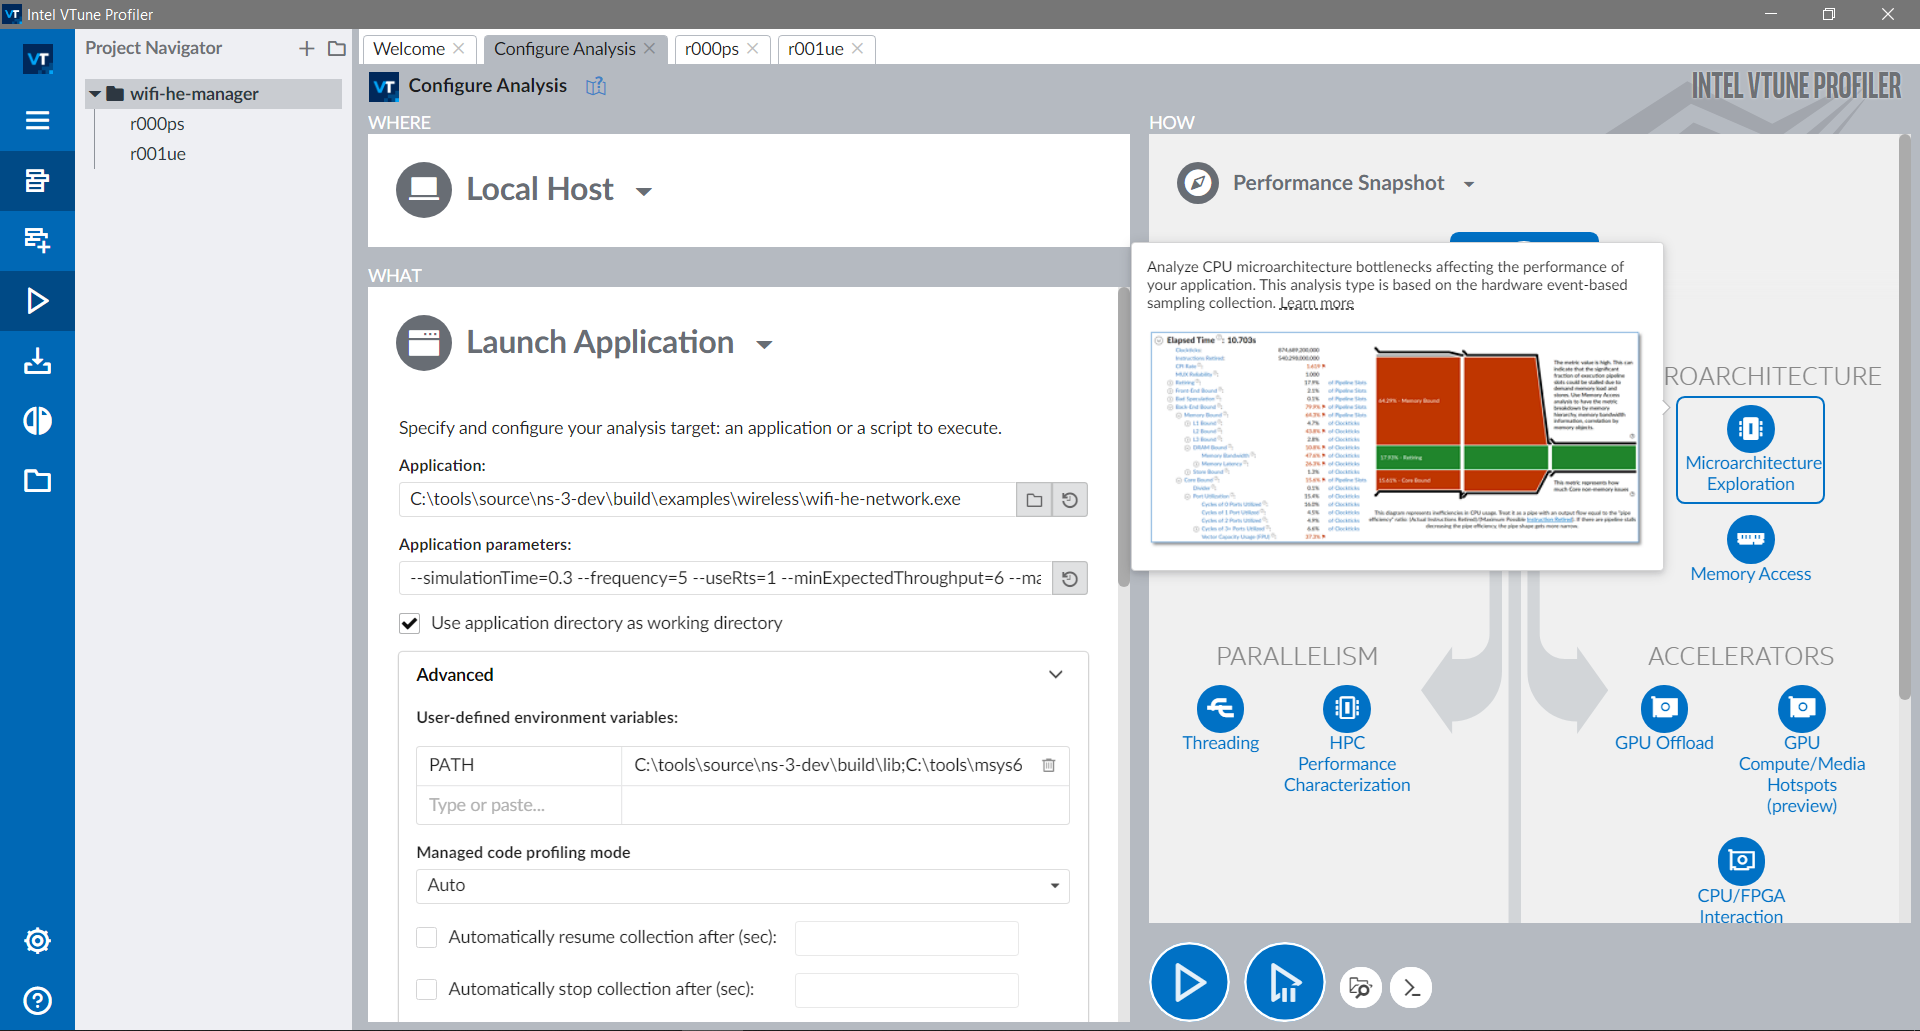
An overview on how to use Perf with Hotspot , AMD uProf and
Intel VTune is provided in the following sections.
4.9.2.1. Profiling and optimizationWhile profilers will help point out interest hotspots, they won’t help fixing the issues.
At least for now…
After profiling, optimization should be done following the Pareto principle.
Focus first on least amount of work that can provide most benefits.
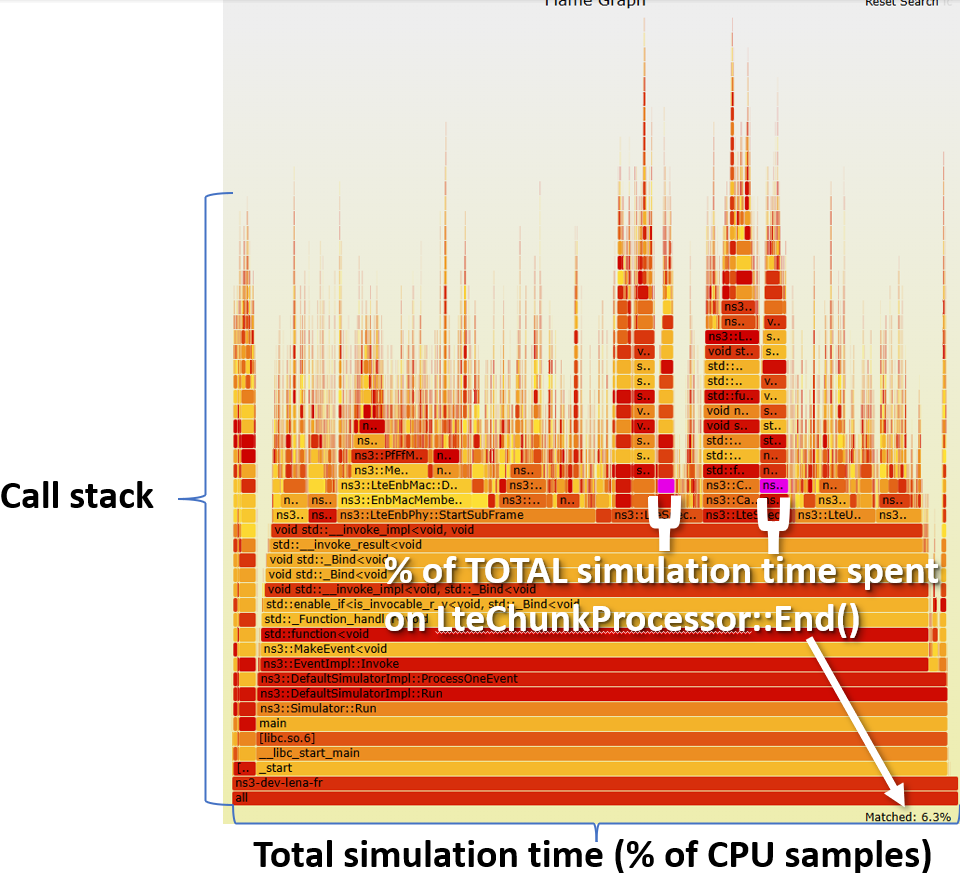
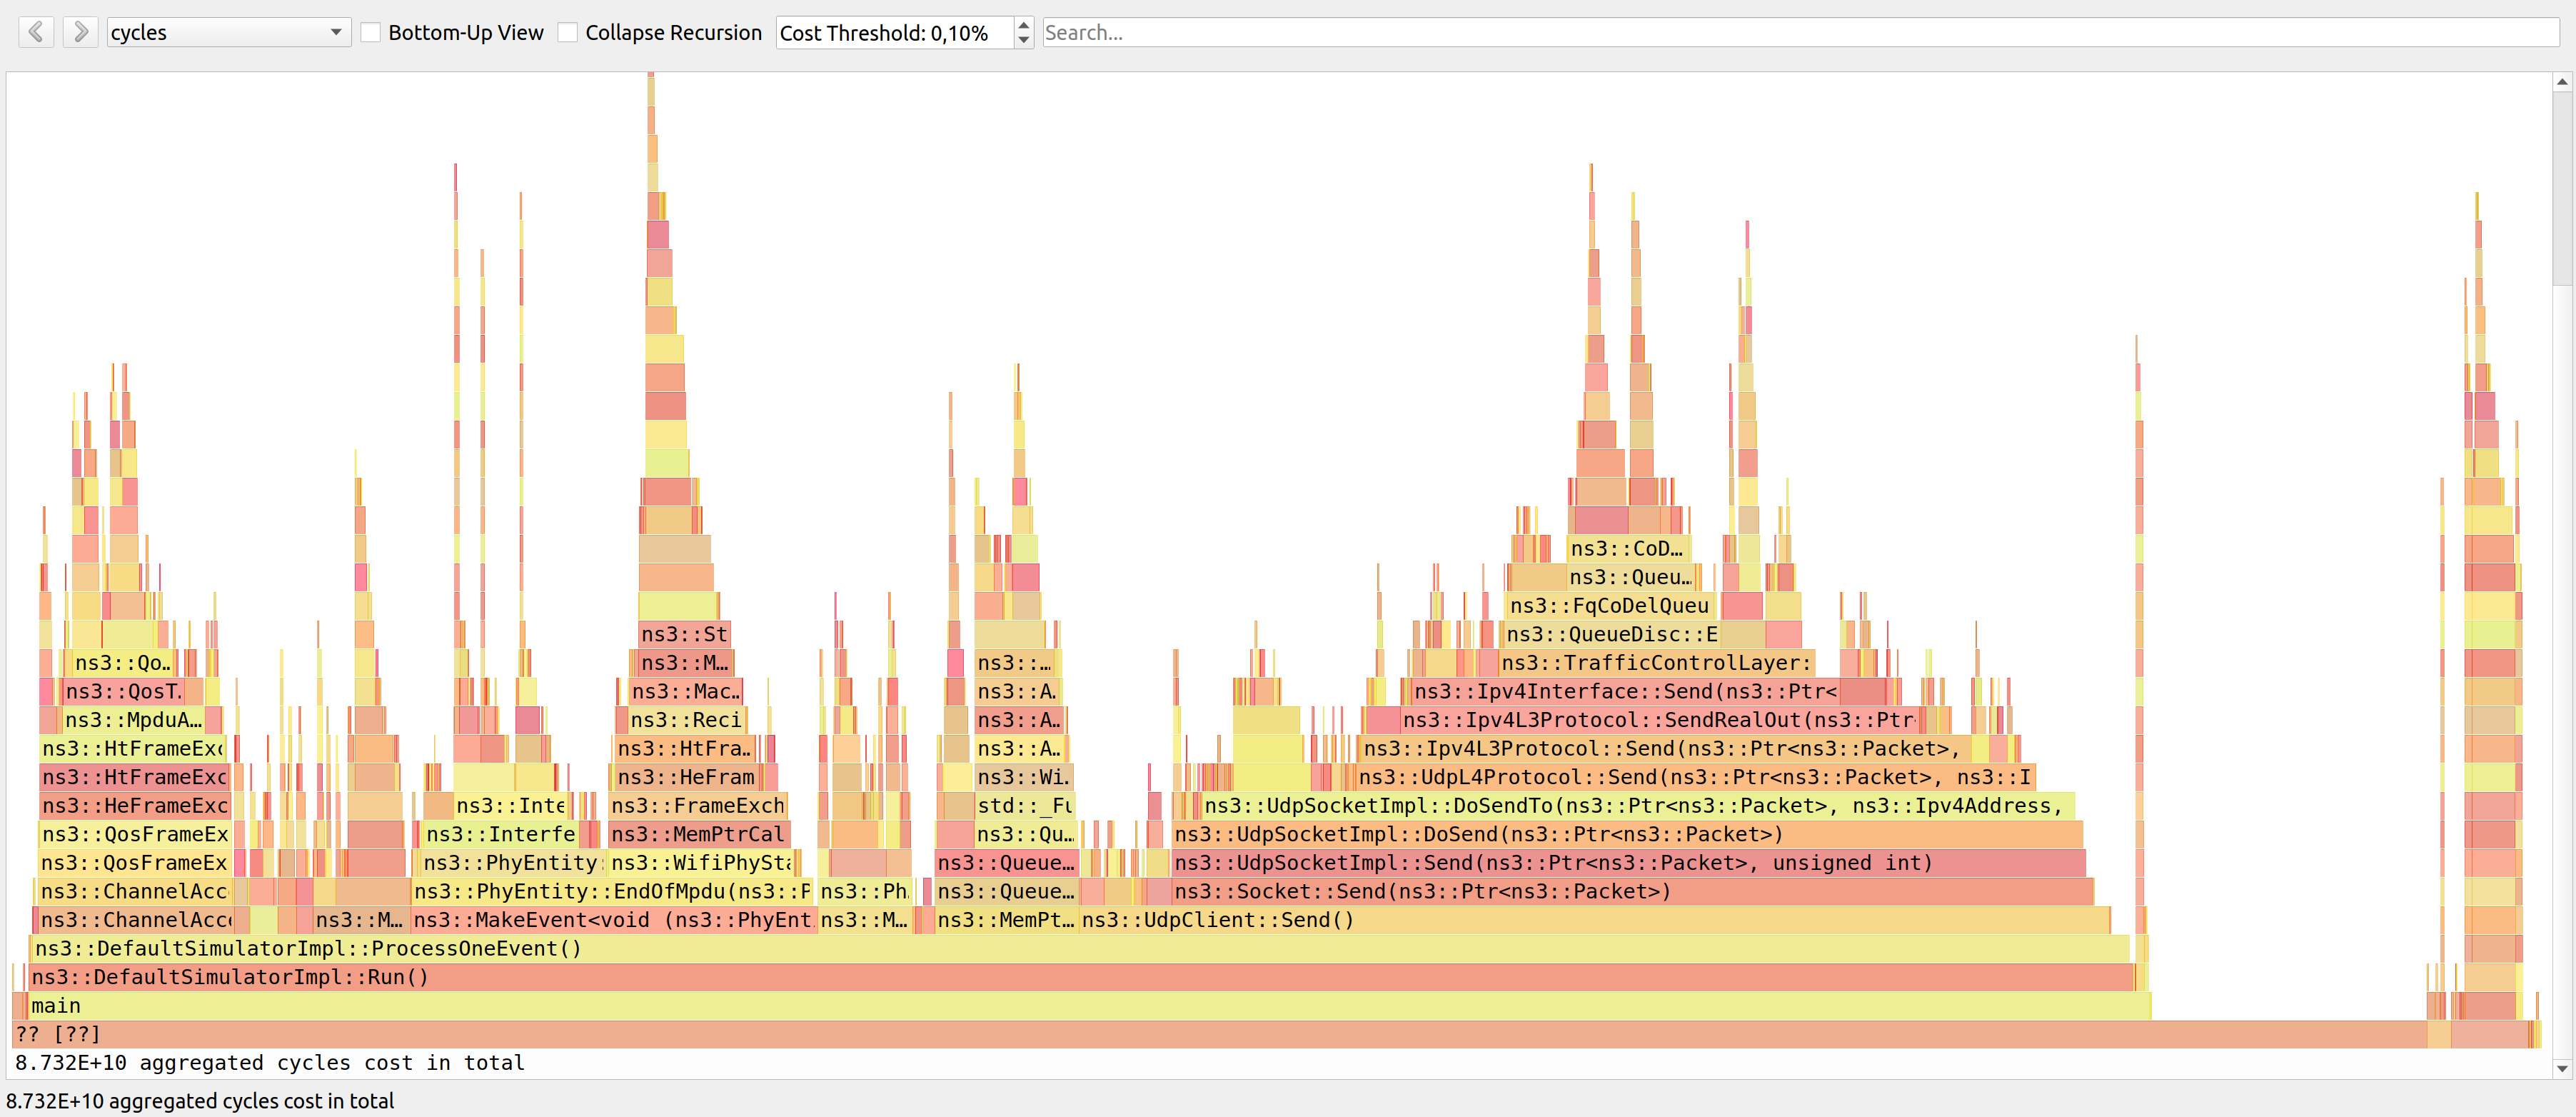
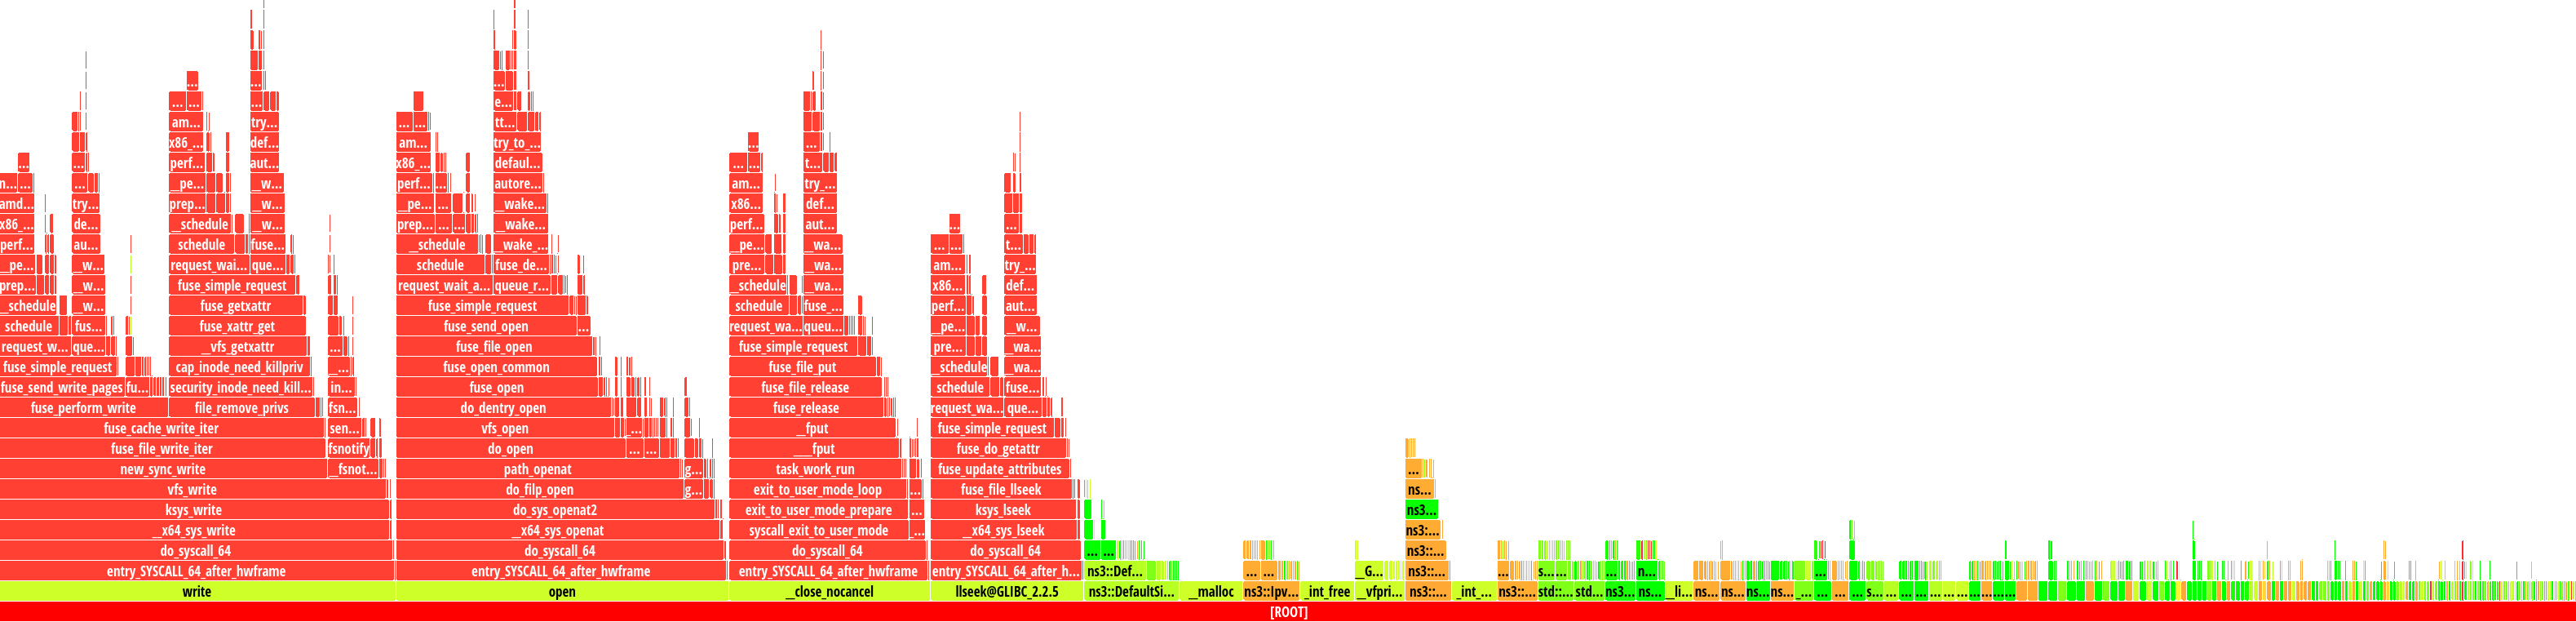
Let us see an example, based on lte-frequency-reuse cycles
The vertical axis contain stacked bars. Every bar corresponds to a function.
The stack itself represents the call stack (when a function call other,
and other, etc). The width of each bar corresponds to the time it takes to
execute the function itself and the functions it calls (bars on top of it).
This is where we start looking for bottlenecks. Start looking at widest
columns at the top, and move down. As an example, we can select
LteChunkProcessor::End()
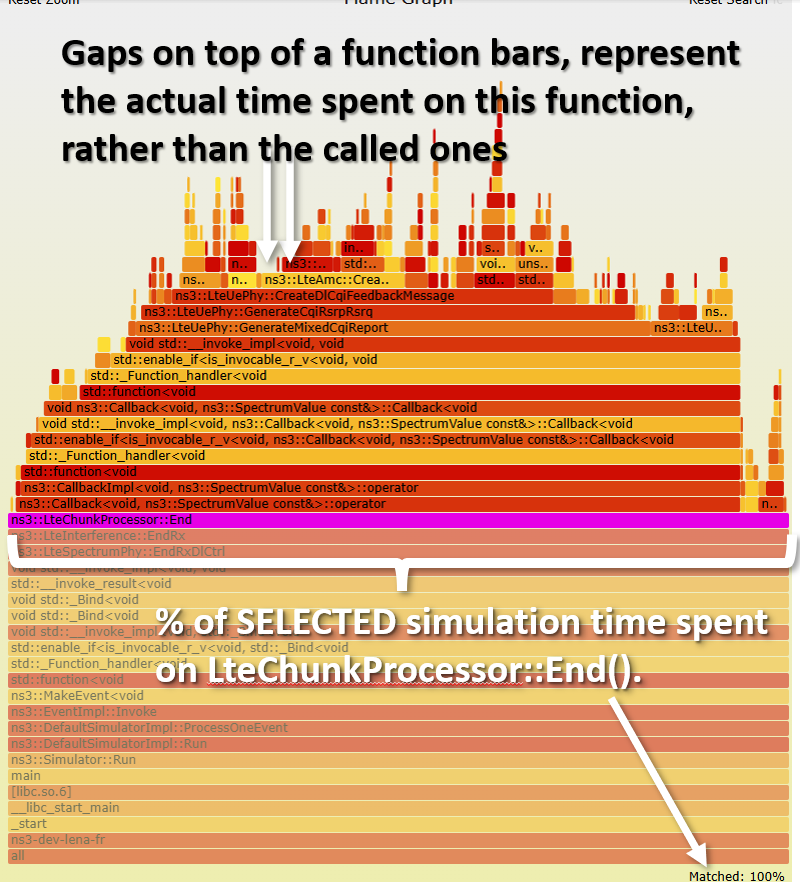
If we click on the LteChunkProcessor::End() LteChunkProcessor::End() LteAmc
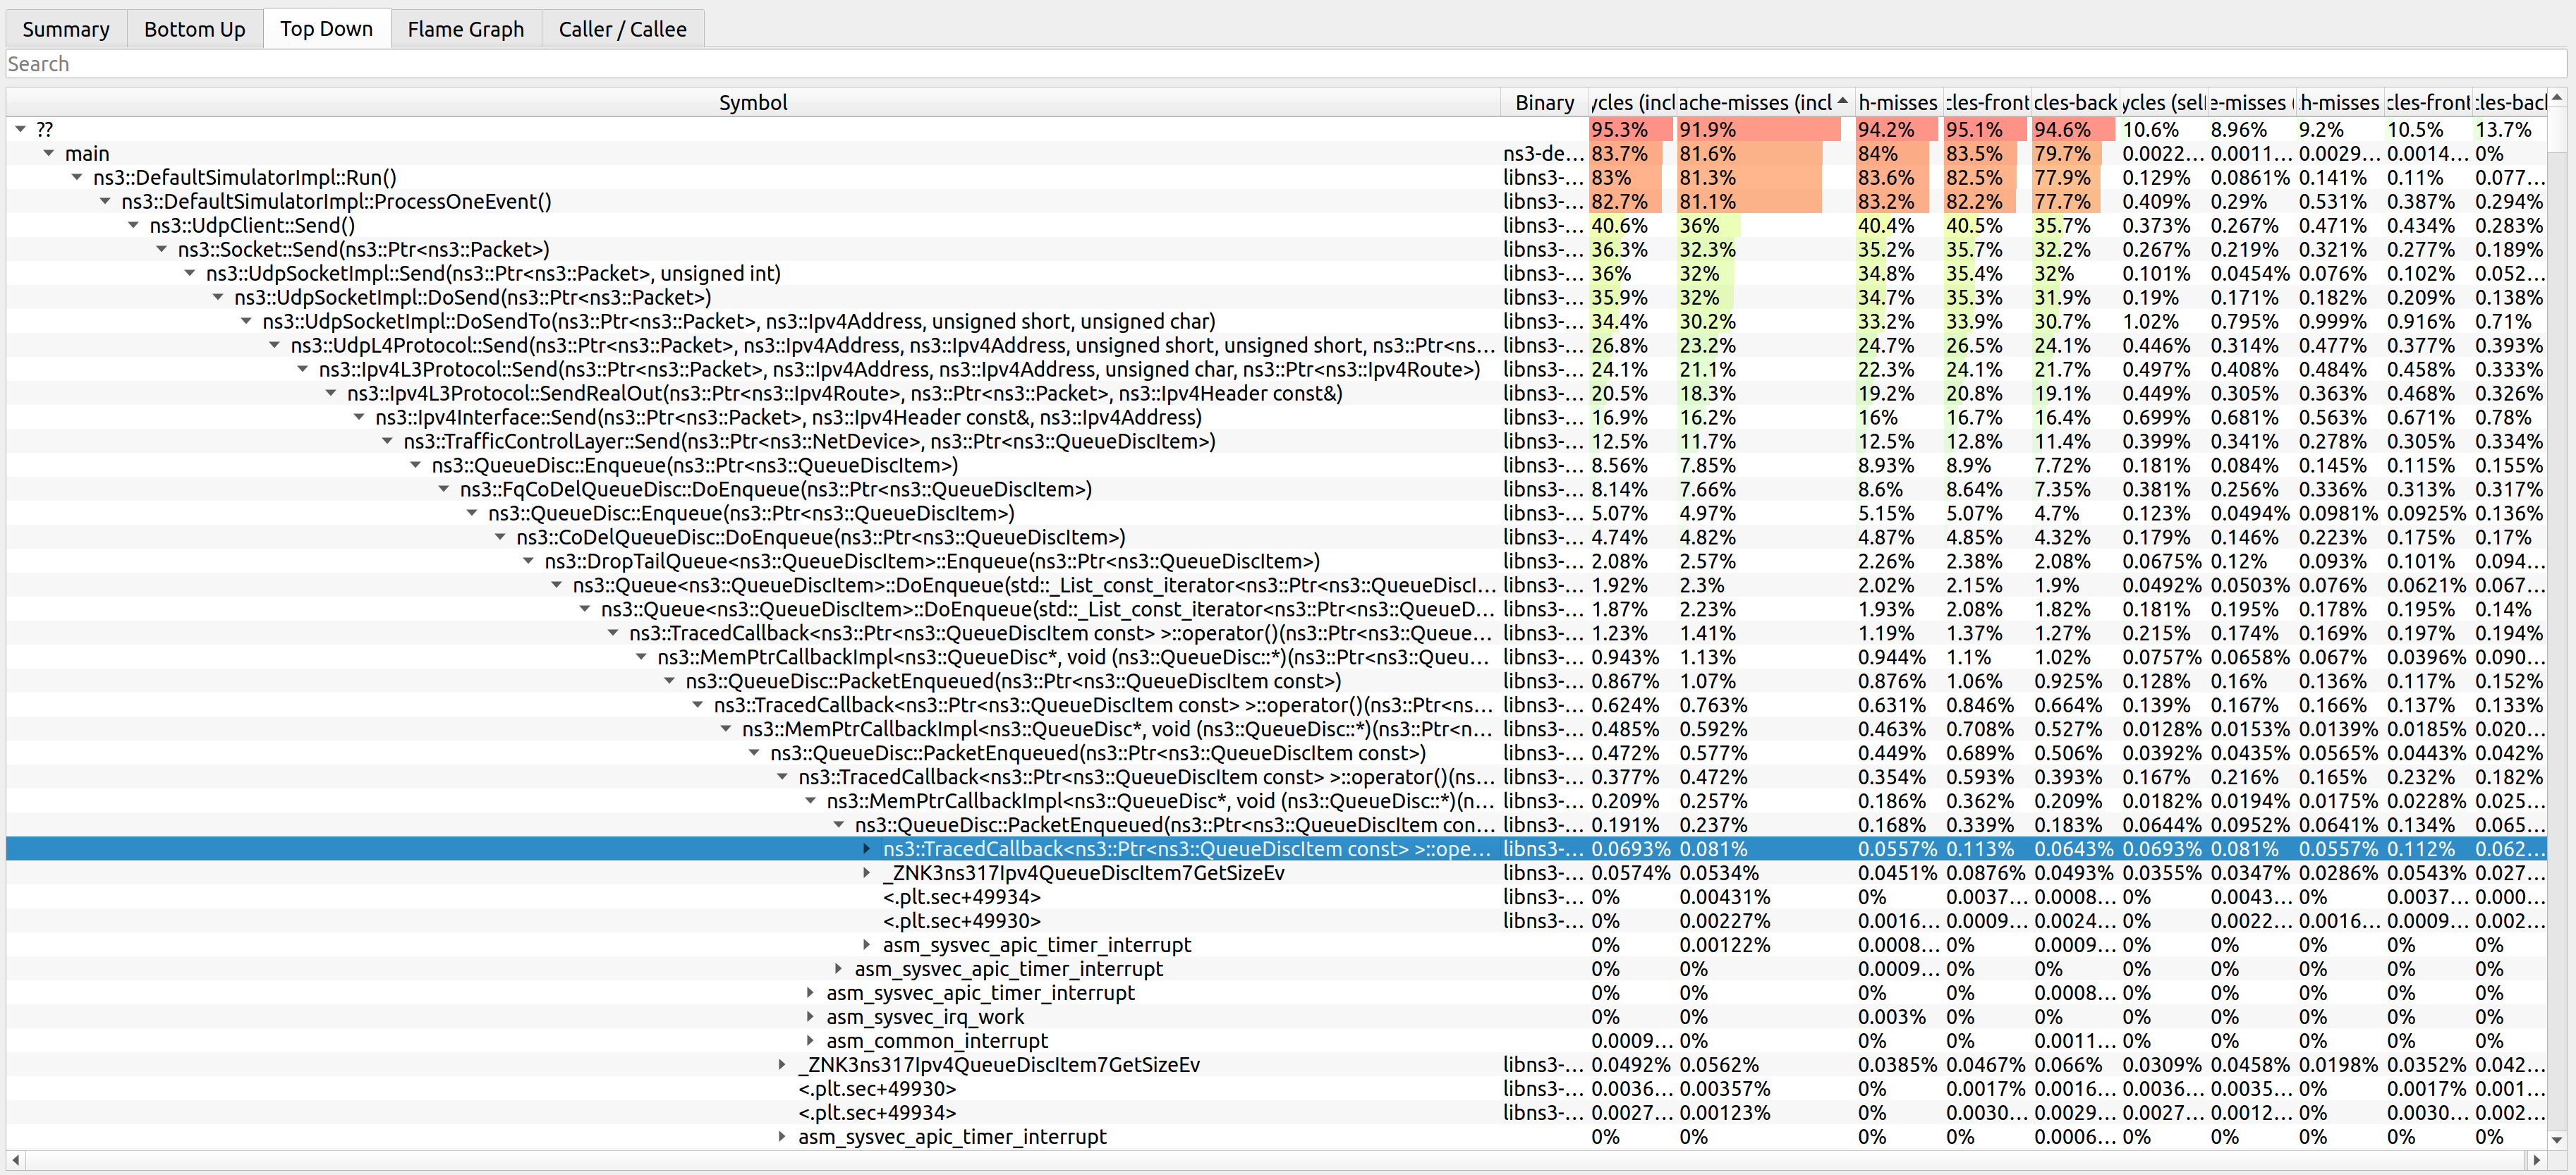
Now that we are closed to the top of the stack, we have a better idea of
what is actually happening and can optimize more easily.
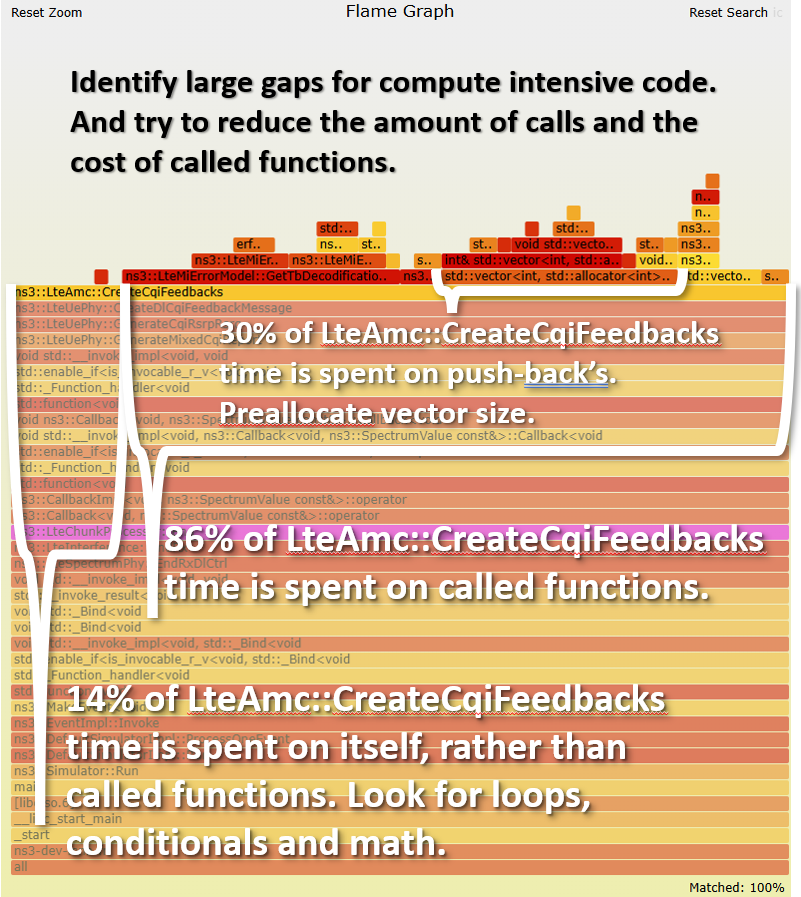
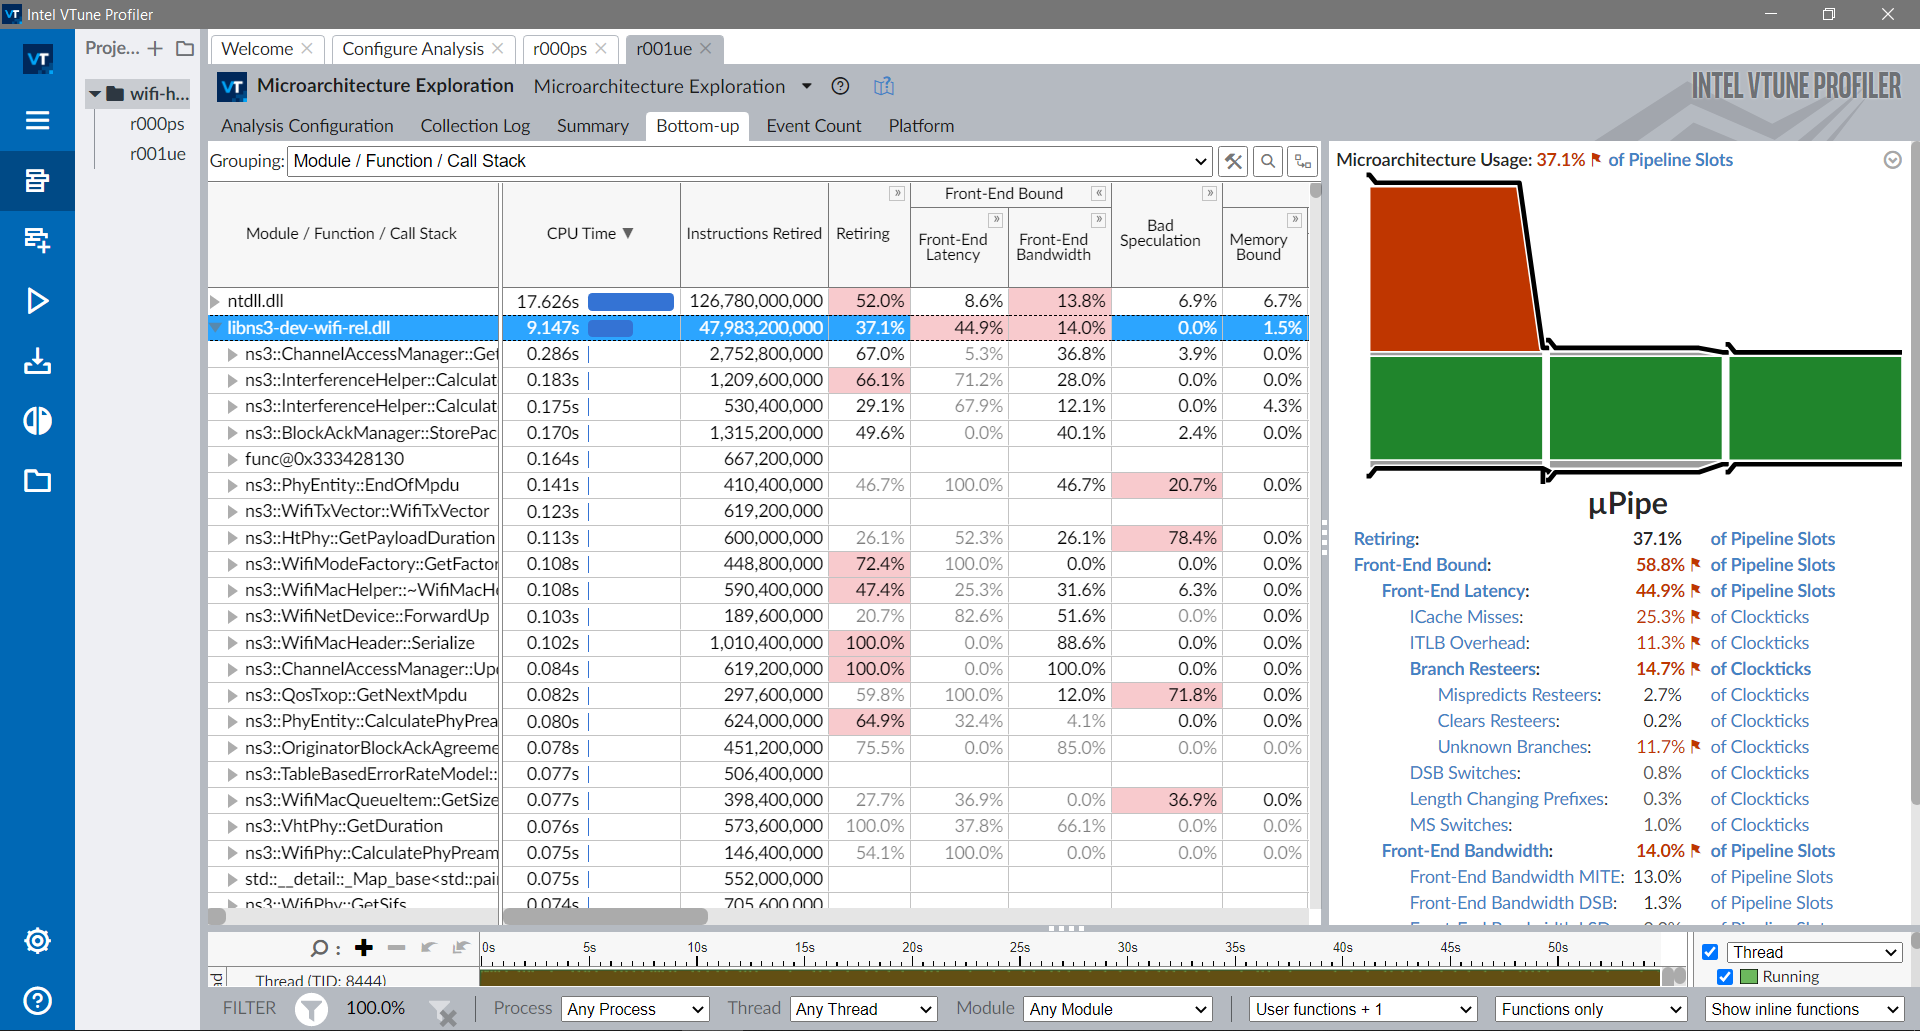
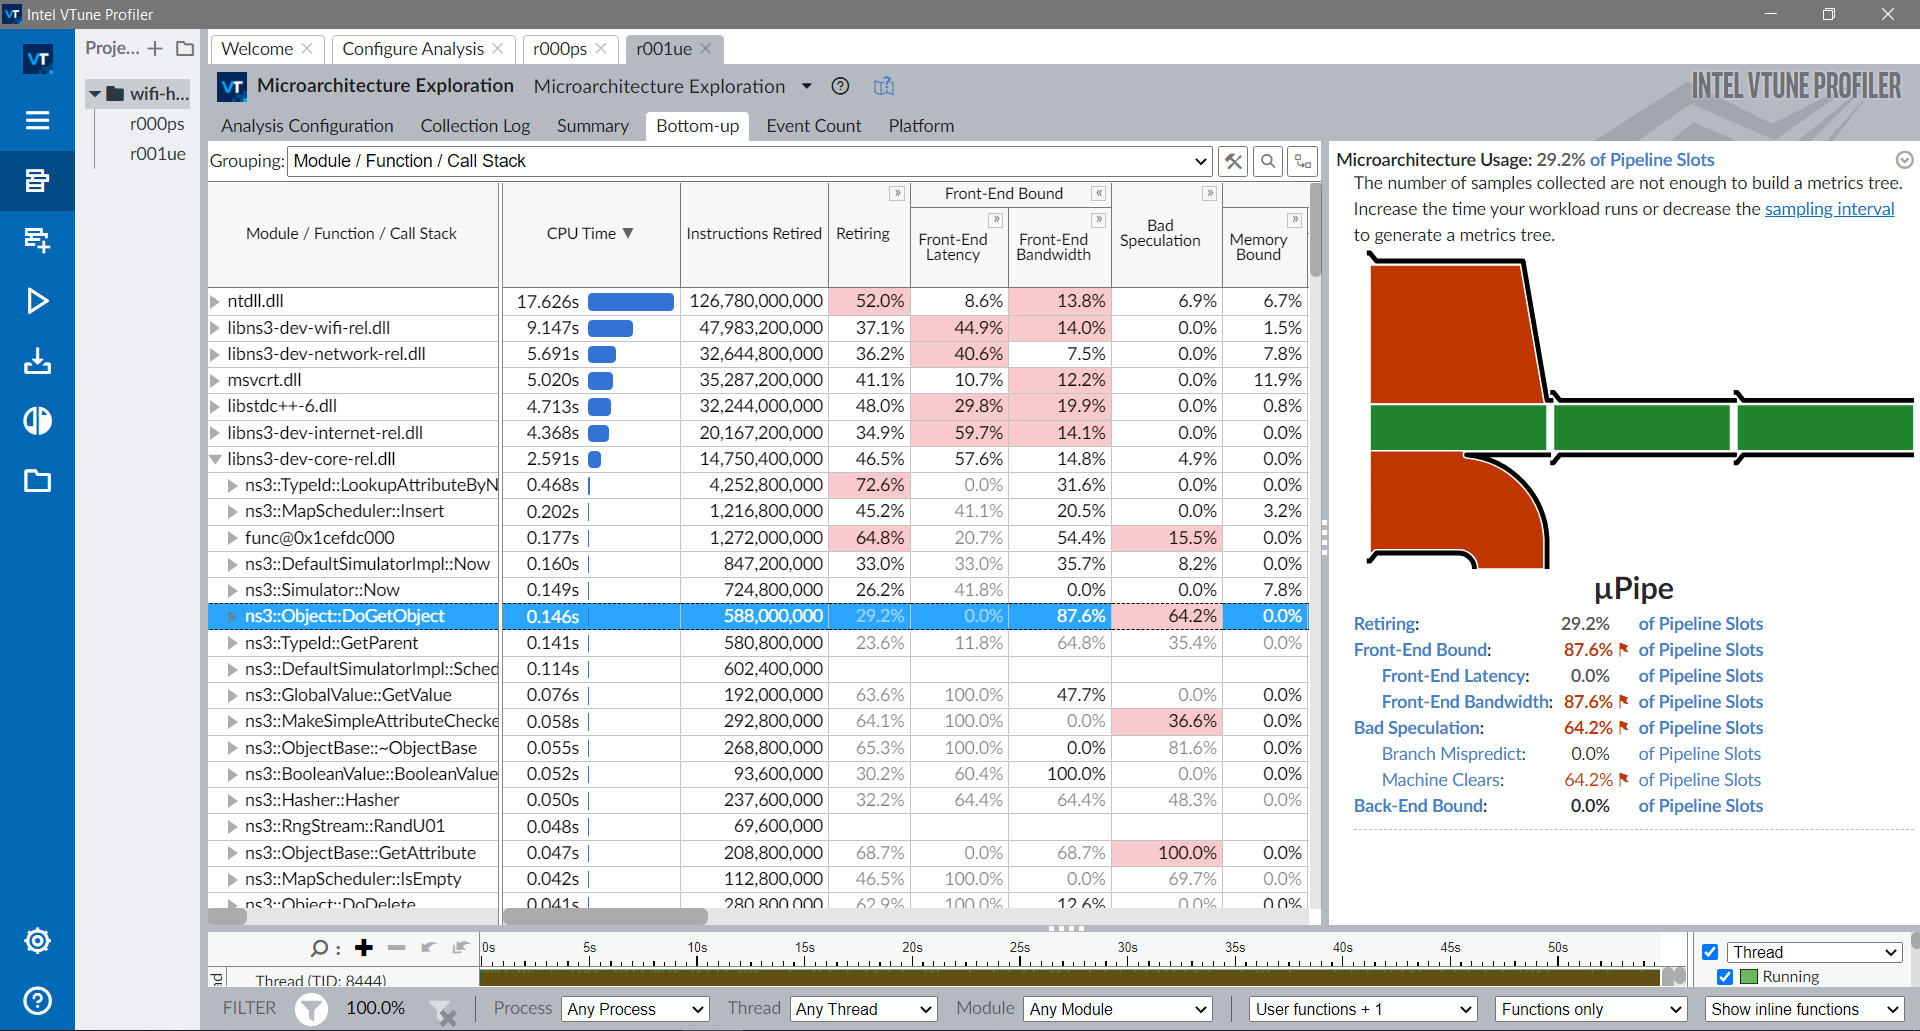
For example, notice that about 14% of LteAmc::CreateCqiFeedbacks()
many conditional operations (if-else, switches), causing instruction cache-misses or pipeline stalls in case of wrong branch prediction
accessing data in erratic patterns, causing data cache-misses
waiting for a value to be computed at a congested CPU unit (e.g. slow division, trigonometric), causing pipeline stalls
a lot of actual work, also known as retired instructions
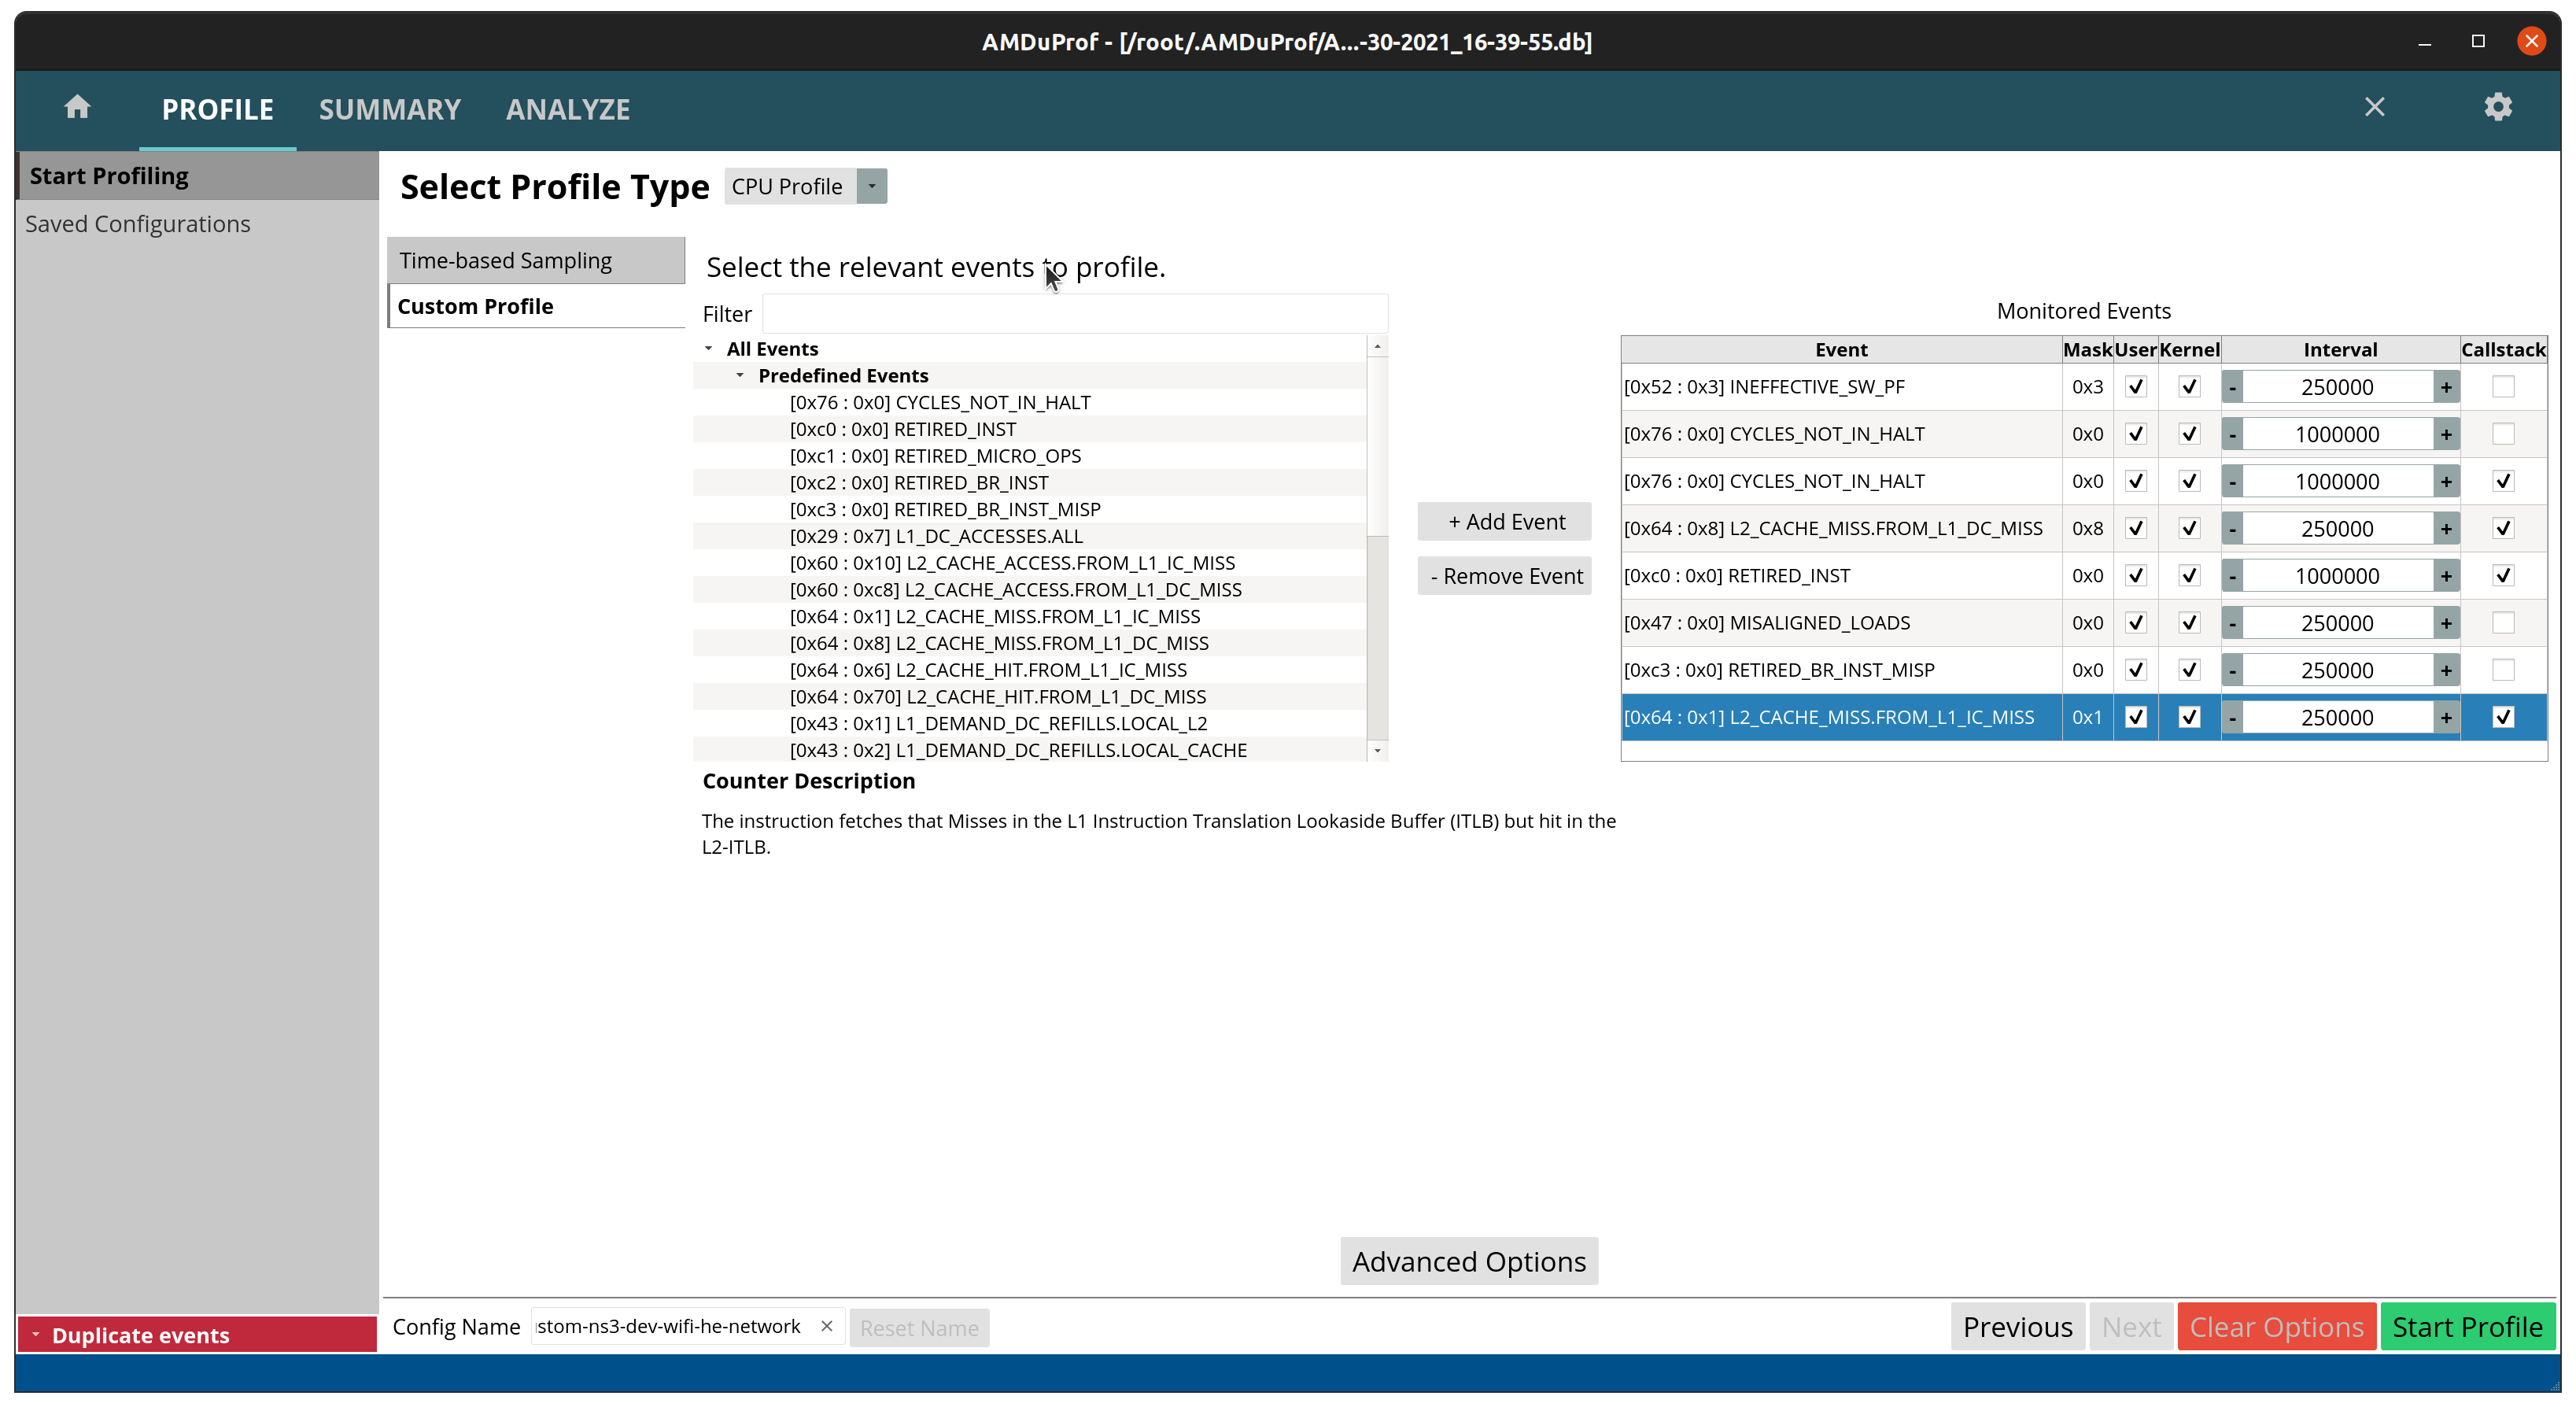
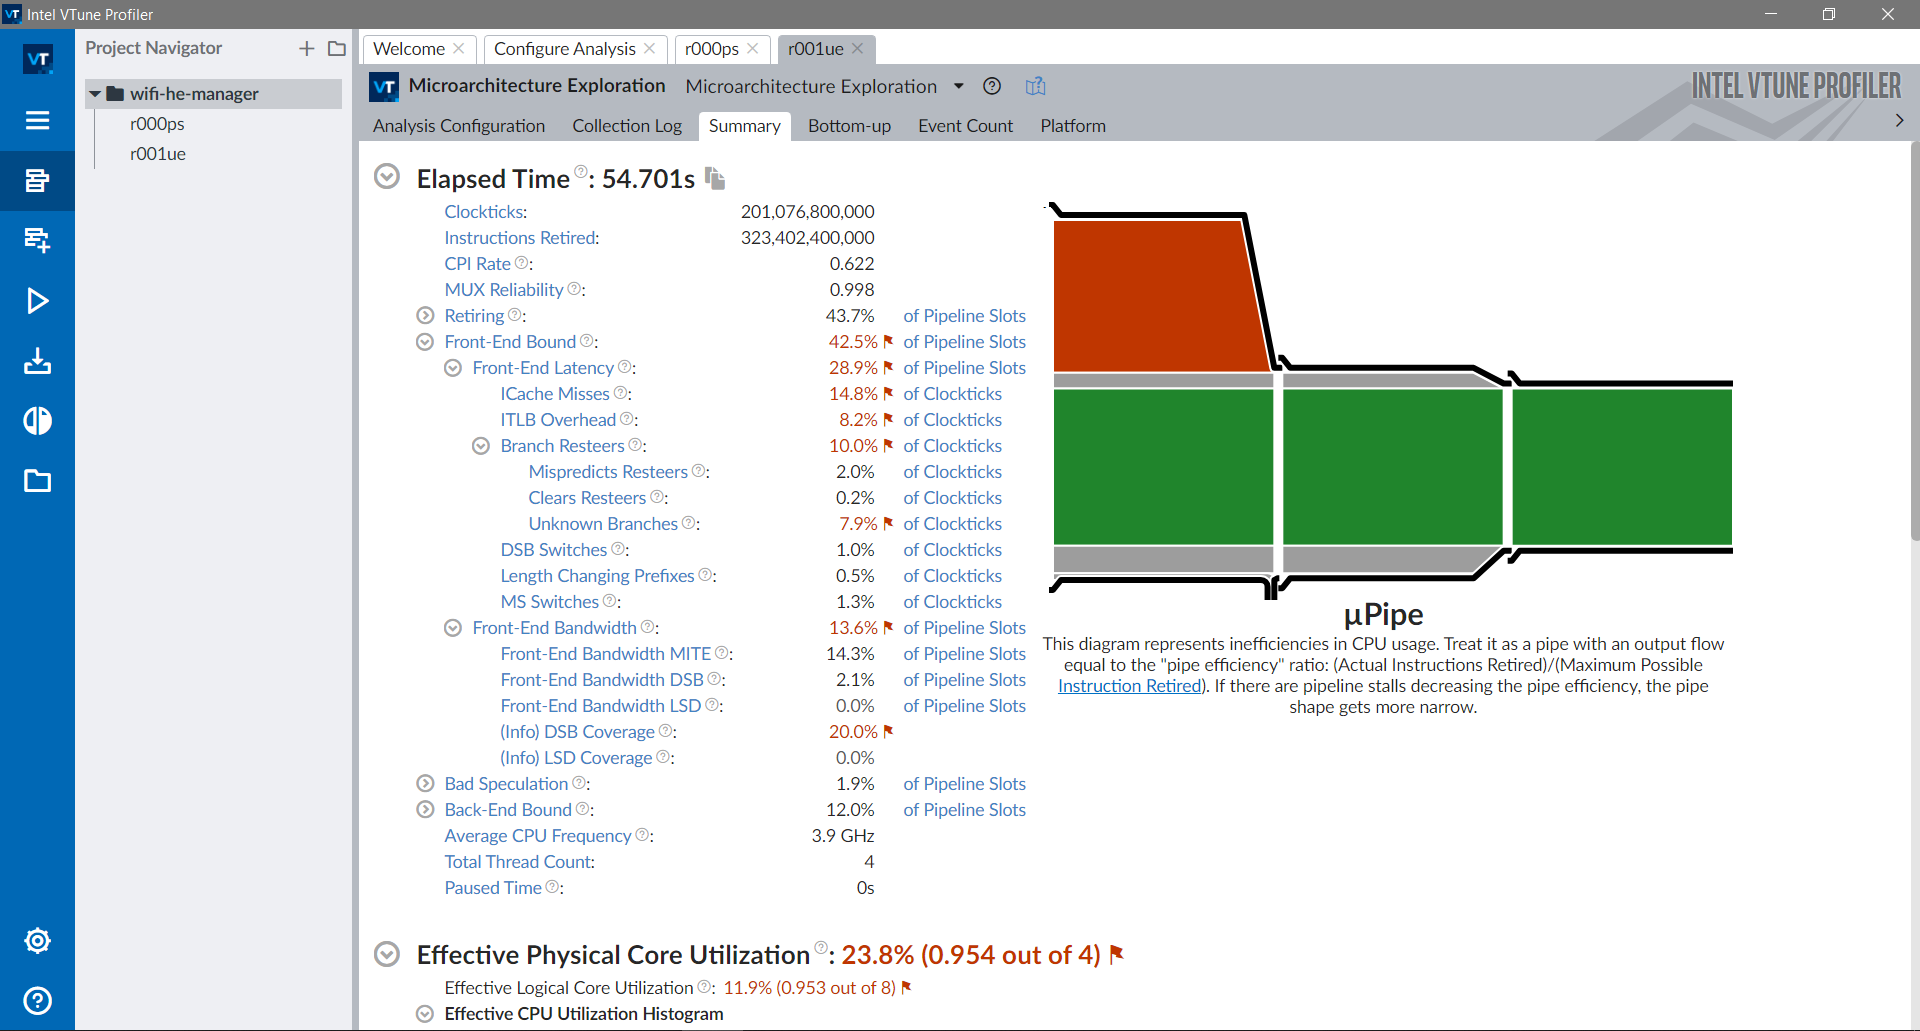
To check which case it really is, instead of CPU-cycles cache-misses branch-misses stalled-cycles-frontend stalled-cycles-backend Intel VTune and AMD uProf can give you the rough location of the
instructions (line of code) causing these misses and stalls.
We also see that 86% of the time is spent elsewhere. In LteMiErrorModel, and some vector related calls.
One of these vector calls is push_back
std :: vector < int >
LteAmc :: CreateCqiFeedbacks ( const SpectrumValue & sinr , uint8_t rbgSize )
{
NS_LOG_FUNCTION ( this );
std :: vector < int > cqi ;
if ( m_amcModel == MiErrorModel )
{
NS_LOG_DEBUG ( this << " AMC-VIENNA RBG size " << ( uint16_t ) rbgSize );
NS_ASSERT_MSG ( rbgSize > 0 , " LteAmc-Vienna: RBG size must be greater than 0" );
std :: vector < int > rbgMap ;
int rbId = 0 ;
for ( auto it = sinr . ConstValuesBegin (); it != sinr . ConstValuesEnd (); it ++ )
{
/// WE CAN CUT 30% OF TIME BY AVOIDING THESE REALLOCATIONS WITH rbgMap.resize(rbgSize) AT BEGINNING
/// THEN USING std::iota(rbgMap.begin(), rbgMap.end(),rbId+1-rbgSize) INSIDE THE NEXT IF
rbgMap . push_back ( rbId ++ );
if (( rbId % rbgSize == 0 ) || (( it + 1 ) == sinr . ConstValuesEnd ()))
{
uint8_t mcs = 0 ;
TbStats_t tbStats ;
while ( mcs <= 28 )
{
HarqProcessInfoList_t harqInfoList ;
tbStats = LteMiErrorModel :: GetTbDecodificationStats (
sinr ,
rbgMap ,
( uint16_t ) GetDlTbSizeFromMcs ( mcs , rbgSize ) / 8 , /// DIVISIONS ARE EXPENSIVE. OPTIMIZER WILL
/// REPLACE THIS TRIVIAL CASE WITH >> 3,
/// BUT THIS ISN'T ALWAYS THE CASE.
/// IF THE DIVISION IS BY A LOOP INVARIANT,
/// THEN COMPUTE ITS INVERSE OUTSIDE
/// THE LOOP TO REPLACE THE DIVISION WITH
/// A MULTIPLICATION.
mcs ,
harqInfoList );
if ( tbStats . tbler > 0.1 )
{
break ;
}
mcs ++ ;
}
if ( mcs > 0 )
{
mcs -- ;
}
NS_LOG_DEBUG ( this << " \t RBG " << rbId << " MCS " << ( uint16_t ) mcs << " TBLER "
<< tbStats . tbler );
int rbgCqi = 0 ;
if (( tbStats . tbler > 0.1 ) && ( mcs == 0 ))
{
rbgCqi = 0 ; // any MCS can guarantee the 10 % of BER
}
else if ( mcs == 28 )
{
rbgCqi = 15 ; // all MCSs can guarantee the 10 % of BER
}
else
{
double s = SpectralEfficiencyForMcs [ mcs ];
rbgCqi = 0 ;
while (( rbgCqi < 15 ) && ( SpectralEfficiencyForCqi [ rbgCqi + 1 ] < s ))
{
++ rbgCqi ;
}
}
NS_LOG_DEBUG ( this << " \t MCS " << ( uint16_t ) mcs << "-> CQI " << rbgCqi );
// fill the cqi vector (per RB basis)
/// WE CAN CUT 30% OF TIME BY AVOIDING THESE REALLOCATIONS WITH cqi.resize(cqi.size()+rbgSize)
/// THEN std::fill(cqi.rbegin(), cqi.rbegin()+rbgSize, rbgCqi)
for ( uint8_t j = 0 ; j < rbgSize ; j ++ )
{
cqi . push_back ( rbgCqi );
}
rbgMap . clear ();
}
}
}
return cqi ;
}
Try to explore by yourself with the interactive flamegraph below
(only available for html-based documentation).
Flame Graph
Reset Zoom
Search
ic
std::map<unsigned short, ns3::pfsFlowPerf_t, std::less<unsigned short>, std::allocator<std::pair<unsigned short const, ns3::pfsFlowPerf_t> > >::find (198,041 samples, 0.02%)
std::_Rb_tree<ns3::LteSpectrumModelId, std::pair<ns3::LteSpectrumModelId const, ns3::Ptr<ns3::SpectrumModel> >, std::_Select1st<std::pair<ns3::LteSpectrumModelId const, ns3::Ptr<ns3::SpectrumModel> > >, std::less<ns3::LteSpectrumModelId>, std::allocator<std::pair<ns3::LteSpectrumModelId const, ns3::Ptr<ns3::SpectrumModel> > > >::_M_begin (165,062 samples, 0.02%)
std::_Rb_tree<unsigned short, std::pair<unsigned short const, ns3::pfsFlowPerf_t>, std::_Select1st<std::pair<unsigned short const, ns3::pfsFlowPerf_t> >, std::less<unsigned short>, std::allocator<std::pair<unsigned short const, ns3::pfsFlowPerf_t> > >::_M_mbegin (190,024 samples, 0.02%)
std::_Rb_tree_node<std::pair<ns3::LteSpectrumModelId const, ns3::Ptr<ns3::SpectrumModel> > >::_M_valptr (198,501 samples, 0.02%)
ns3::SpectrumValue::operator= (550,220 samples, 0.06%)
ns3::Ptr<ns3::PacketBurst> ns3::CreateObject<ns3::PacketBurst> (5,659,329 samples, 0.58%)
[libc.so.6] (128,671 samples, 0.01%)
ns3::Ptr<ns3::Packet>::Ptr (155,467 samples, 0.02%)
std::_Function_base::_Base_manager<ns3::Callback<void, ns3::SpectrumValue const&>::Callback<void (206,217 samples, 0.02%)
std::_Vector_base<ns3::HigherLayerSelected_s, std::allocator<ns3::HigherLayerSelected_s> >::_Vector_base (487,446 samples, 0.05%)
ns3::MapScheduler::Insert (5,134,622 samples, 0.53%)
ns3::Ptr<ns3::SpectrumSignalParameters>::operator (356,060 samples, 0.04%)
decltype (247,590 samples, 0.03%)
std::vector<int, std::allocator<int> >::vector (188,646 samples, 0.02%)
void std::__cxx11::list<ns3::Ptr<ns3::LteControlMessage>, std::allocator<ns3::Ptr<ns3::LteControlMessage> > >::_M_insert<ns3::Ptr<ns3::LteControlMessage> const&> (529,781 samples, 0.05%)
std::__new_allocator<std::_List_node<ns3::Ptr<ns3::LteControlMessage> > >::deallocate (124,394 samples, 0.01%)
std::map<ns3::LteFlowId_t, ns3::FfMacSchedSapProvider::SchedDlRlcBufferReqParameters, std::less<ns3::LteFlowId_t>, std::allocator<std::pair<ns3::LteFlowId_t const, ns3::FfMacSchedSapProvider::SchedDlRlcBufferReqParameters> > >::find (150,793 samples, 0.02%)
pow (195,678 samples, 0.02%)
std::_Vector_base<ns3::MacCeListElement_s, std::allocator<ns3::MacCeListElement_s> >::~_Vector_base (162,749 samples, 0.02%)
ns3::DefaultDeleter<ns3::Packet>::Delete (900,924 samples, 0.09%)
ns3::LteNetDevice::GetNode (287,608 samples, 0.03%)
std::_Bind<void (421,730 samples, 0.04%)
__gnu_cxx::__normal_iterator<ns3::VendorSpecificListElement_s*, std::vector<ns3::VendorSpecificListElement_s, std::allocator<ns3::VendorSpecificListElement_s> > > std::__copy_move_a<false, __gnu_cxx::__normal_iterator<ns3::VendorSpecificListElement_s const*, std::vector<ns3::VendorSpecificListElement_s, std::allocator<ns3::VendorSpecificListElement_s> > >, __gnu_cxx::__normal_iterator<ns3::VendorSpecificListElement_s*, std::vector<ns3::VendorSpecificListElement_s, std::allocator<ns3::VendorSpecificListElement_s> > > > (183,538 samples, 0.02%)
std::vector<double, std::allocator<double> >::at (475,937 samples, 0.05%)
ns3::LteRlcSm::DoNotifyTxOpportunity (304,289 samples, 0.03%)
std::_Rb_tree_node<std::pair<unsigned char const, ns3::LteMacSapProvider*> >::_M_valptr (126,936 samples, 0.01%)
std::vector<unsigned short, std::allocator<unsigned short> >::_S_relocate (236,704 samples, 0.02%)
void ns3::Simulator::ScheduleWithContext<void (11,324,289 samples, 1.17%)
std::_Vector_base<ns3::Ptr<ns3::Object>, std::allocator<ns3::Ptr<ns3::Object> > >::~_Vector_base (279,523 samples, 0.03%)
void std::_Destroy<ns3::HigherLayerSelected_s*> (151,525 samples, 0.02%)
std::__new_allocator<unsigned short>::allocate (378,466 samples, 0.04%)
__gnu_cxx::__normal_iterator<std::__cxx11::list<ns3::Ptr<ns3::LteControlMessage>, std::allocator<ns3::Ptr<ns3::LteControlMessage> > >*, std::vector<std::__cxx11::list<ns3::Ptr<ns3::LteControlMessage>, std::allocator<ns3::Ptr<ns3::LteControlMessage> > >, std::allocator<std::__cxx11::list<ns3::Ptr<ns3::LteControlMessage>, std::allocator<ns3::Ptr<ns3::LteControlMessage> > > > > >::operator+ (275,310 samples, 0.03%)
ns3::MobilityModel::GetPosition (488,812 samples, 0.05%)
std::_Rb_tree<unsigned short, std::pair<unsigned short const, std::vector<unsigned short, std::allocator<unsigned short> > >, std::_Select1st<std::pair<unsigned short const, std::vector<unsigned short, std::allocator<unsigned short> > > >, std::less<unsigned short>, std::allocator<std::pair<unsigned short const, std::vector<unsigned short, std::allocator<unsigned short> > > > >::_M_lower_bound (350,404 samples, 0.04%)
double std::reduce<__gnu_cxx::__normal_iterator<double const*, std::vector<double, std::allocator<double> > >, double> (204,657 samples, 0.02%)
ns3::MemberSchedSapProvider<ns3::PfFfMacScheduler>::SchedDlTriggerReq (314,249 samples, 0.03%)
unsigned int* std::__fill_n_a<unsigned int*, unsigned long, unsigned int> (643,609 samples, 0.07%)
std::_Rb_tree<unsigned short, std::pair<unsigned short const, unsigned int>, std::_Select1st<std::pair<unsigned short const, unsigned int> >, std::less<unsigned short>, std::allocator<std::pair<unsigned short const, unsigned int> > >::_M_lower_bound (1,092,232 samples, 0.11%)
ns3::IsotropicAntennaModel::GetGainDb (146,639 samples, 0.02%)
void std::_Destroy<ns3::CqiListElement_s> (416,767 samples, 0.04%)
ns3::MacCeListElement_s::~MacCeListElement_s (204,134 samples, 0.02%)
ns3::EventId::EventId (124,898 samples, 0.01%)
ns3::TagBuffer::ReadU32 (411,294 samples, 0.04%)
__gnu_cxx::__aligned_membuf<std::pair<unsigned short const, std::vector<std::vector<ns3::HarqProcessInfoElement_t, std::allocator<ns3::HarqProcessInfoElement_t> >, std::allocator<std::vector<ns3::HarqProcessInfoElement_t, std::allocator<ns3::HarqProcessInfoElement_t> > > > > >::_M_ptr (532,897 samples, 0.05%)
std::_Rb_tree_node<std::pair<unsigned short const, ns3::LteEnbComponentCarrierManager::UeInfo> >::_M_valptr (427,542 samples, 0.04%)
std::vector<int, std::allocator<int> >::~vector (148,894 samples, 0.02%)
double* std::__uninitialized_copy_a<__gnu_cxx::__normal_iterator<double const*, std::vector<double, std::allocator<double> > >, double*, double> (583,431 samples, 0.06%)
double* std::fill_n<double*, unsigned long, double> (461,600 samples, 0.05%)
ns3::Ptr<ns3::Packet>::~Ptr (4,598,067 samples, 0.47%)
std::_Function_base::_Base_manager<ns3::Callback<void, ns3::SpectrumValue const&>::Callback<void (394,803 samples, 0.04%)
ns3::LteSpectrumSignalParametersDataFrame::~LteSpectrumSignalParametersDataFrame (2,421,676 samples, 0.25%)
std::_Vector_base<int, std::allocator<int> >::_Vector_base (208,316 samples, 0.02%)
std::_Rb_tree_iterator<std::pair<unsigned short const, ns3::LteEnbComponentCarrierManager::UeInfo> >::operator* (332,309 samples, 0.03%)
ns3::Ptr<ns3::MatrixArray<std::complex<double> > const>::Acquire (149,159 samples, 0.02%)
unsigned short* std::uninitialized_fill_n<unsigned short*, unsigned long, unsigned short> (858,492 samples, 0.09%)
ns3::Ptr<ns3::SpectrumValue> ns3::Copy<ns3::SpectrumValue> (148,581 samples, 0.02%)
ns3::Ptr<ns3::MobilityModel const>::operator (353,481 samples, 0.04%)
[libc.so.6] (487,893 samples, 0.05%)
std::map<unsigned short, std::vector<unsigned short, std::allocator<unsigned short> >, std::less<unsigned short>, std::allocator<std::pair<unsigned short const, std::vector<unsigned short, std::allocator<unsigned short> > > > >::find (146,964 samples, 0.02%)
std::_Rb_tree<unsigned char, std::pair<unsigned char const, ns3::LteMacSapUser*>, std::_Select1st<std::pair<unsigned char const, ns3::LteMacSapUser*> >, std::less<unsigned char>, std::allocator<std::pair<unsigned char const, ns3::LteMacSapUser*> > >::_M_lower_bound (310,068 samples, 0.03%)
std::_Vector_base<ns3::DlInfoListElement_s::HarqStatus_e, std::allocator<ns3::DlInfoListElement_s::HarqStatus_e> >::_Vector_impl::_Vector_impl (201,403 samples, 0.02%)
decltype (197,496 samples, 0.02%)
std::vector<unsigned int, std::allocator<unsigned int> >::operator[] (232,400 samples, 0.02%)
std::vector<std::vector<ns3::RlcPduListElement_s, std::allocator<ns3::RlcPduListElement_s> >, std::allocator<std::vector<ns3::RlcPduListElement_s, std::allocator<ns3::RlcPduListElement_s> > > >::push_back (329,003 samples, 0.03%)
void std::_Destroy<ns3::UlInfoListElement_s*, ns3::UlInfoListElement_s> (271,620 samples, 0.03%)
ns3::DefaultDeleter<ns3::SpectrumValue>::Delete (207,577 samples, 0.02%)
std::map<unsigned short, std::map<unsigned char, ns3::LteMacSapUser*, std::less<unsigned char>, std::allocator<std::pair<unsigned char const, ns3::LteMacSapUser*> > >, std::less<unsigned short>, std::allocator<std::pair<unsigned short const, std::map<unsigned char, ns3::LteMacSapUser*, std::less<unsigned char>, std::allocator<std::pair<unsigned char const, ns3::LteMacSapUser*> > > > > >::find (1,864,747 samples, 0.19%)
std::vector<ns3::UlDciListElement_s, std::allocator<ns3::UlDciListElement_s> >::size (319,528 samples, 0.03%)
ns3::Callback<void, std::__cxx11::list<ns3::Ptr<ns3::LteControlMessage>, std::allocator<ns3::Ptr<ns3::LteControlMessage> > > >::operator (29,097,935 samples, 3.00%) n..
std::allocator_traits<std::allocator<std::_List_node<ns3::Ptr<ns3::LteControlMessage> > > >::allocate (267,808 samples, 0.03%)
[unknown] (29,966,440 samples, 3.09%) [..
ns3::MakeEvent<void (22,443,594 samples, 2.31%)
std::_Rb_tree<unsigned short, std::pair<unsigned short const, unsigned int>, std::_Select1st<std::pair<unsigned short const, unsigned int> >, std::less<unsigned short>, std::allocator<std::pair<unsigned short const, unsigned int> > >::_S_key (509,708 samples, 0.05%)
std::vector<unsigned short, std::allocator<unsigned short> >::operator= (231,116 samples, 0.02%)
std::vector<ns3::VendorSpecificListElement_s, std::allocator<ns3::VendorSpecificListElement_s> >::~vector (296,190 samples, 0.03%)
ns3::MemberSchedSapProvider<ns3::PfFfMacScheduler>::SchedDlRlcBufferReq (2,595,942 samples, 0.27%)
std::_Rb_tree_node<std::pair<int const, double> >::_M_valptr (197,171 samples, 0.02%)
std::remove_reference<ns3::Ptr<ns3::PacketBurst>&>::type&& std::move<ns3::Ptr<ns3::PacketBurst>&> (190,575 samples, 0.02%)
std::_Rb_tree<unsigned char, std::pair<unsigned char const, ns3::LteMacSapProvider::ReportBufferStatusParameters>, std::_Select1st<std::pair<unsigned char const, ns3::LteMacSapProvider::ReportBufferStatusParameters> >, std::less<unsigned char>, std::allocator<std::pair<unsigned char const, ns3::LteMacSapProvider::ReportBufferStatusParameters> > >::end (236,767 samples, 0.02%)
std::_Vector_base<ns3::DlInfoListElement_s::HarqStatus_e, std::allocator<ns3::DlInfoListElement_s::HarqStatus_e> >::_M_deallocate (378,541 samples, 0.04%)
__gnu_cxx::__normal_iterator<ns3::DlInfoListElement_s const*, std::vector<ns3::DlInfoListElement_s, std::allocator<ns3::DlInfoListElement_s> > >::base (239,920 samples, 0.02%)
__pow_finite@plt (150,295 samples, 0.02%)
ns3::LteSpectrumPhy::UpdateSinrPerceived (1,031,003 samples, 0.11%)
std::_Vector_base<double, std::allocator<double> >::_M_create_storage (168,940 samples, 0.02%)
std::_Rb_tree<ns3::TbId_t, std::pair<ns3::TbId_t const, ns3::tbInfo_t>, std::_Select1st<std::pair<ns3::TbId_t const, ns3::tbInfo_t> >, std::less<ns3::TbId_t>, std::allocator<std::pair<ns3::TbId_t const, ns3::tbInfo_t> > >::_M_begin (366,917 samples, 0.04%)
std::_Rb_tree_node<std::pair<ns3::TbId_t const, ns3::tbInfo_t> >::_M_valptr (244,479 samples, 0.03%)
bool __gnu_cxx::operator==<ns3::DlInfoListElement_s const*, std::vector<ns3::DlInfoListElement_s, std::allocator<ns3::DlInfoListElement_s> > > (155,906 samples, 0.02%)
ns3::IidManager::GetParent (124,384 samples, 0.01%)
std::allocator<double>::deallocate (199,701 samples, 0.02%)
ns3::LteUePhy::CreateTxPowerSpectralDensity (6,920,606 samples, 0.71%)
std::__cxx11::list<ns3::UlDciLteControlMessage, std::allocator<ns3::UlDciLteControlMessage> >* std::__copy_move_a2<true, std::__cxx11::list<ns3::UlDciLteControlMessage, std::allocator<ns3::UlDciLteControlMessage> >*, std::__cxx11::list<ns3::UlDciLteControlMessage, std::allocator<ns3::UlDciLteControlMessage> >*> (145,758 samples, 0.02%)
std::_Rb_tree<unsigned short, std::pair<unsigned short const, std::vector<double, std::allocator<double> > >, std::_Select1st<std::pair<unsigned short const, std::vector<double, std::allocator<double> > > >, std::less<unsigned short>, std::allocator<std::pair<unsigned short const, std::vector<double, std::allocator<double> > > > >::_M_copy (400,356 samples, 0.04%)
std::_Vector_base<double, std::allocator<double> >::_Vector_base (163,185 samples, 0.02%)
void std::__cxx11::list<ns3::Ptr<ns3::LteControlMessage>, std::allocator<ns3::Ptr<ns3::LteControlMessage> > >::_M_insert<ns3::Ptr<ns3::LteControlMessage> const&> (186,142 samples, 0.02%)
void ns3::Simulator::ScheduleWithContext<void (10,844,170 samples, 1.12%)
ns3::TracedCallback<ns3::PhyTransmissionStatParameters>::operator (148,768 samples, 0.02%)
ns3::Ptr<ns3::LteSpectrumSignalParametersDataFrame>::~Ptr (192,141 samples, 0.02%)
std::_Rb_tree_node<std::pair<unsigned short const, ns3::LteEnbComponentCarrierManager::UeInfo> >::_M_valptr (167,523 samples, 0.02%)
ns3::SpectrumModel::GetNumBands (198,424 samples, 0.02%)
std::pair<unsigned short const, std::vector<unsigned short, std::allocator<unsigned short> > >::pair<unsigned short const&> (614,403 samples, 0.06%)
std::_Rb_tree<unsigned char, std::pair<unsigned char const, ns3::LteUeMac::LcInfo>, std::_Select1st<std::pair<unsigned char const, ns3::LteUeMac::LcInfo> >, std::less<unsigned char>, std::allocator<std::pair<unsigned char const, ns3::LteUeMac::LcInfo> > >::_M_begin (344,173 samples, 0.04%)
std::_Vector_base<unsigned char, std::allocator<unsigned char> >::_Vector_impl::_Vector_impl (304,552 samples, 0.03%)
ns3::HigherLayerSelected_s::operator= (193,644 samples, 0.02%)
ns3::operator< (470,743 samples, 0.05%)
void std::_Destroy<ns3::BuildRarListElement_s*> (157,406 samples, 0.02%)
ns3::Ptr<ns3::LteControlMessage>::Acquire (405,134 samples, 0.04%)
std::_Tuple_impl<2ul, double, ns3::Ptr<ns3::SpectrumSignalParameters>, ns3::Ptr<ns3::SpectrumPhy>, std::map<unsigned int, ns3::Ptr<ns3::SpectrumValue>, std::less<unsigned int>, std::allocator<std::pair<unsigned int const, ns3::Ptr<ns3::SpectrumValue> > > > >::~_Tuple_impl (4,416,635 samples, 0.46%)
unsigned char* std::fill_n<unsigned char*, unsigned long, unsigned char> (339,561 samples, 0.04%)
std::vector<int, std::allocator<int> >::vector (190,302 samples, 0.02%)
std::__cxx11::_List_base<ns3::Ptr<ns3::LteControlMessage>, std::allocator<ns3::Ptr<ns3::LteControlMessage> > >::_M_get_node (388,525 samples, 0.04%)
malloc (205,465 samples, 0.02%)
std::_Vector_base<ns3::Ptr<ns3::Object>, std::allocator<ns3::Ptr<ns3::Object> > >::~_Vector_base (293,725 samples, 0.03%)
ns3::LteSpectrumSignalParametersDlCtrlFrame::LteSpectrumSignalParametersDlCtrlFrame (6,566,512 samples, 0.68%)
std::_Rb_tree_iterator<std::pair<unsigned short const, ns3::pfsFlowPerf_t> >::operator* (187,135 samples, 0.02%)
std::vector<ns3::Ptr<ns3::PacketBurst>, std::allocator<ns3::Ptr<ns3::PacketBurst> > >::at (420,921 samples, 0.04%)
operator new (217,527 samples, 0.02%)
std::__detail::_List_node_header::_M_base (142,742 samples, 0.01%)
std::__cxx11::_List_base<ns3::Ptr<ns3::LteControlMessage>, std::allocator<ns3::Ptr<ns3::LteControlMessage> > >::_M_clear (148,437 samples, 0.02%)
std::_Rb_tree<int, std::pair<int const, double>, std::_Select1st<std::pair<int const, double> >, std::less<int>, std::allocator<std::pair<int const, double> > >::_M_get_node (128,987 samples, 0.01%)
std::map<ns3::Scheduler::EventKey, ns3::EventImpl*, std::less<ns3::Scheduler::EventKey>, std::allocator<std::pair<ns3::Scheduler::EventKey const, ns3::EventImpl*> > >::begin (1,458,842 samples, 0.15%)
std::_Vector_base<double, std::allocator<double> >::~_Vector_base (285,804 samples, 0.03%)
ns3::MakeEvent<void (200,168 samples, 0.02%)
ns3::DlInfoListElement_s::operator= (234,084 samples, 0.02%)
std::_Vector_base<ns3::DlInfoListElement_s::HarqStatus_e, std::allocator<ns3::DlInfoListElement_s::HarqStatus_e> >::~_Vector_base (271,191 samples, 0.03%)
std::operator== (126,322 samples, 0.01%)
__gnu_cxx::__normal_iterator<ns3::VendorSpecificListElement_s*, std::vector<ns3::VendorSpecificListElement_s, std::allocator<ns3::VendorSpecificListElement_s> > > std::copy<__gnu_cxx::__normal_iterator<ns3::VendorSpecificListElement_s const*, std::vector<ns3::VendorSpecificListElement_s, std::allocator<ns3::VendorSpecificListElement_s> > >, __gnu_cxx::__normal_iterator<ns3::VendorSpecificListElement_s*, std::vector<ns3::VendorSpecificListElement_s, std::allocator<ns3::VendorSpecificListElement_s> > > > (603,286 samples, 0.06%)
std::_Tuple_impl<3ul, ns3::Ptr<ns3::SpectrumSignalParameters>, ns3::Ptr<ns3::SpectrumPhy>, std::map<unsigned int, ns3::Ptr<ns3::SpectrumValue>, std::less<unsigned int>, std::allocator<std::pair<unsigned int const, ns3::Ptr<ns3::SpectrumValue> > > > >::_Tuple_impl<ns3::Ptr<ns3::SpectrumSignalParameters>&, ns3::Ptr<ns3::SpectrumPhy>&, std::map<unsigned int, ns3::Ptr<ns3::SpectrumValue>, std::less<unsigned int>, std::allocator<std::pair<unsigned int const, ns3::Ptr<ns3::SpectrumValue> > > >&, void> (395,163 samples, 0.04%)
ns3::MacCeValue_u::MacCeValue_u (1,932,297 samples, 0.20%)
std::_List_node<ns3::Ptr<ns3::Packet> >::_M_valptr (161,864 samples, 0.02%)
std::vector<ns3::CqiListElement_s, std::allocator<ns3::CqiListElement_s> >::empty (704,819 samples, 0.07%)
ns3::SpectrumValue::operator-= (2,676,966 samples, 0.28%)
bool __gnu_cxx::operator==<double*, std::vector<double, std::allocator<double> > > (358,959 samples, 0.04%)
ns3::LteEnbMac::DoUlInfoListElementHarqFeedback (373,450 samples, 0.04%)
std::_Rb_tree<int, std::pair<int const, double>, std::_Select1st<std::pair<int const, double> >, std::less<int>, std::allocator<std::pair<int const, double> > >::_M_erase (518,709 samples, 0.05%)
ns3::DlInfoListElement_s::HarqStatus_e* std::__copy_move_a<false, __gnu_cxx::__normal_iterator<ns3::DlInfoListElement_s::HarqStatus_e const*, std::vector<ns3::DlInfoListElement_s::HarqStatus_e, std::allocator<ns3::DlInfoListElement_s::HarqStatus_e> > >, ns3::DlInfoListElement_s::HarqStatus_e*> (147,743 samples, 0.02%)
ns3::Ptr<ns3::DlDciLteControlMessage>::operator (240,645 samples, 0.02%)
std::vector<unsigned short, std::allocator<unsigned short> >::size (208,545 samples, 0.02%)
std::_Rb_tree<ns3::Scheduler::EventKey, std::pair<ns3::Scheduler::EventKey const, ns3::EventImpl*>, std::_Select1st<std::pair<ns3::Scheduler::EventKey const, ns3::EventImpl*> >, std::less<ns3::Scheduler::EventKey>, std::allocator<std::pair<ns3::Scheduler::EventKey const, ns3::EventImpl*> > >::_M_begin (234,091 samples, 0.02%)
__log10_finite (150,649 samples, 0.02%)
std::vector<ns3::DlInfoListElement_s, std::allocator<ns3::DlInfoListElement_s> >::clear (1,509,367 samples, 0.16%)
ns3::Time::From (518,604 samples, 0.05%)
ns3::SpectrumValue::SpectrumValue (242,130 samples, 0.02%)
std::vector<double, std::allocator<double> >::~vector (390,089 samples, 0.04%)
void std::destroy_at<std::pair<unsigned short const, std::vector<unsigned short, std::allocator<unsigned short> > > > (266,588 samples, 0.03%)
__gnu_cxx::__aligned_membuf<std::pair<ns3::Scheduler::EventKey const, ns3::EventImpl*> >::_M_ptr (153,808 samples, 0.02%)
std::_Rb_tree<unsigned short, std::pair<unsigned short const, unsigned int>, std::_Select1st<std::pair<unsigned short const, unsigned int> >, std::less<unsigned short>, std::allocator<std::pair<unsigned short const, unsigned int> > >::find (178,285 samples, 0.02%)
ns3::SpectrumValue::GetSpectrumModelUid (275,599 samples, 0.03%)
ns3::DlInfoListElement_s::HarqStatus_e* std::copy<__gnu_cxx::__normal_iterator<ns3::DlInfoListElement_s::HarqStatus_e const*, std::vector<ns3::DlInfoListElement_s::HarqStatus_e, std::allocator<ns3::DlInfoListElement_s::HarqStatus_e> > >, ns3::DlInfoListElement_s::HarqStatus_e*> (147,743 samples, 0.02%)
ns3::LteUePowerControl::GetPucchTxPower (379,341 samples, 0.04%)
ns3::PfFfMacScheduler::DoSchedUlMacCtrlInfoReq (867,311 samples, 0.09%)
std::_Vector_base<double, std::allocator<double> >::_M_get_Tp_allocator (158,214 samples, 0.02%)
double std::reduce<__gnu_cxx::__normal_iterator<double const*, std::vector<double, std::allocator<double> > >, double, std::plus<void> > (335,268 samples, 0.03%)
std::_Rb_tree_node<std::pair<unsigned int const, ns3::Ptr<ns3::SpectrumValue> > >* std::_Rb_tree<unsigned int, std::pair<unsigned int const, ns3::Ptr<ns3::SpectrumValue> >, std::_Select1st<std::pair<unsigned int const, ns3::Ptr<ns3::SpectrumValue> > >, std::less<unsigned int>, std::allocator<std::pair<unsigned int const, ns3::Ptr<ns3::SpectrumValue> > > >::_M_clone_node<false, std::_Rb_tree<unsigned int, std::pair<unsigned int const, ns3::Ptr<ns3::SpectrumValue> >, std::_Select1st<std::pair<unsigned int const, ns3::Ptr<ns3::SpectrumValue> > >, std::less<unsigned int>, std::allocator<std::pair<unsigned int const, ns3::Ptr<ns3::SpectrumValue> > > >::_Alloc_node> (156,128 samples, 0.02%)
std::_Rb_tree<unsigned int, std::pair<unsigned int const, ns3::Ptr<ns3::SpectrumValue> >, std::_Select1st<std::pair<unsigned int const, ns3::Ptr<ns3::SpectrumValue> > >, std::less<unsigned int>, std::allocator<std::pair<unsigned int const, ns3::Ptr<ns3::SpectrumValue> > > >::_M_erase (821,493 samples, 0.08%)
int* std::uninitialized_copy<__gnu_cxx::__normal_iterator<int const*, std::vector<int, std::allocator<int> > >, int*> (831,586 samples, 0.09%)
ns3::Object::~Object (158,753 samples, 0.02%)
std::vector<ns3::DlInfoListElement_s::HarqStatus_e, std::allocator<ns3::DlInfoListElement_s::HarqStatus_e> >::max_size (243,139 samples, 0.03%)
std::_Rb_tree<ns3::Scheduler::EventKey, std::pair<ns3::Scheduler::EventKey const, ns3::EventImpl*>, std::_Select1st<std::pair<ns3::Scheduler::EventKey const, ns3::EventImpl*> >, std::less<ns3::Scheduler::EventKey>, std::allocator<std::pair<ns3::Scheduler::EventKey const, ns3::EventImpl*> > >::_Auto_node::_Auto_node<std::pair<ns3::Scheduler::EventKey, ns3::EventImpl*> > (297,286 samples, 0.03%)
ns3::DlDciLteControlMessage::~DlDciLteControlMessage (361,458 samples, 0.04%)
ns3::MemberLteCcmRrcSapUser<ns3::LteEnbRrc>::GetUeManager (297,730 samples, 0.03%)
std::enable_if<is_member_pointer_v<void (3,010,892 samples, 0.31%)
std::move_iterator<ns3::DlInfoListElement_s::HarqStatus_e*> std::__make_move_if_noexcept_iterator<ns3::DlInfoListElement_s::HarqStatus_e, std::move_iterator<ns3::DlInfoListElement_s::HarqStatus_e*> > (147,819 samples, 0.02%)
std::_List_node<ns3::Ptr<ns3::LteControlMessage> >* std::__cxx11::list<ns3::Ptr<ns3::LteControlMessage>, std::allocator<ns3::Ptr<ns3::LteControlMessage> > >::_M_create_node<ns3::Ptr<ns3::LteControlMessage> const&> (1,304,199 samples, 0.13%)
ns3::LteSpectrumPhy* ns3::PeekPointer<ns3::LteSpectrumPhy> (451,162 samples, 0.05%)
void std::_Destroy<ns3::VendorSpecificListElement_s*> (162,953 samples, 0.02%)
ns3::MultiModelSpectrumChannel::StartTx (774,582 samples, 0.08%)
std::pair<std::__strip_reference_wrapper<std::decay<ns3::Scheduler::EventKey const&>::type>::__type, std::__strip_reference_wrapper<std::decay<ns3::EventImpl* const&>::type>::__type> std::make_pair<ns3::Scheduler::EventKey const&, ns3::EventImpl* const&> (831,665 samples, 0.09%)
ns3::SimpleRefCount<ns3::SpectrumSignalParameters, ns3::Empty, ns3::DefaultDeleter<ns3::SpectrumSignalParameters> >::Unref (3,444,708 samples, 0.36%)
ns3::Ptr<ns3::LteControlMessage>::Ptr (405,134 samples, 0.04%)
ns3::CqiListElement_s* std::__uninitialized_move_if_noexcept_a<ns3::CqiListElement_s*, ns3::CqiListElement_s*, std::allocator<ns3::CqiListElement_s> > (437,706 samples, 0.05%)
std::_Vector_base<ns3::DlInfoListElement_s::HarqStatus_e, std::allocator<ns3::DlInfoListElement_s::HarqStatus_e> >::_Vector_impl_data::_Vector_impl_data (236,955 samples, 0.02%)
std::_Rb_tree<unsigned short, std::pair<unsigned short const, std::vector<ns3::UlDciListElement_s, std::allocator<ns3::UlDciListElement_s> > >, std::_Select1st<std::pair<unsigned short const, std::vector<ns3::UlDciListElement_s, std::allocator<ns3::UlDciListElement_s> > > >, std::less<unsigned short>, std::allocator<std::pair<unsigned short const, std::vector<ns3::UlDciListElement_s, std::allocator<ns3::UlDciListElement_s> > > > >::find (1,009,230 samples, 0.10%)
ns3::TypeId::TypeId (242,821 samples, 0.03%)
ns3::IidManager::LookupInformation (451,443 samples, 0.05%)
std::pair<ns3::Scheduler::EventKey const, ns3::EventImpl*>::pair<ns3::Scheduler::EventKey, ns3::EventImpl*> (201,303 samples, 0.02%)
void std::__cxx11::list<ns3::Ptr<ns3::LteControlMessage>, std::allocator<ns3::Ptr<ns3::LteControlMessage> > >::_M_initialize_dispatch<std::_List_const_iterator<ns3::Ptr<ns3::LteControlMessage> > > (143,971 samples, 0.01%)
std::_Rb_tree_header::_Rb_tree_header (152,827 samples, 0.02%)
std::_Rb_tree_iterator<std::pair<unsigned char const, ns3::LteUeMac::LcInfo> >::operator* (213,471 samples, 0.02%)
ns3::Object::SetTypeId (468,464 samples, 0.05%)
ns3::MultiModelSpectrumChannel::FindAndEventuallyAddTxSpectrumModel (301,073 samples, 0.03%)
std::_Rb_tree<unsigned short, std::pair<unsigned short const, ns3::pfsFlowPerf_t>, std::_Select1st<std::pair<unsigned short const, ns3::pfsFlowPerf_t> >, std::less<unsigned short>, std::allocator<std::pair<unsigned short const, ns3::pfsFlowPerf_t> > >::_S_key (304,080 samples, 0.03%)
std::vector<ns3::HigherLayerSelected_s, std::allocator<ns3::HigherLayerSelected_s> >::push_back (1,945,265 samples, 0.20%)
ns3::ByteTagList::ByteTagList (163,282 samples, 0.02%)
std::enable_if<is_member_pointer_v<void (605,810 samples, 0.06%)
ns3::LteUeRrc::DoRecvRrcConnectionReconfiguration (156,981 samples, 0.02%)
std::vector<signed char, std::allocator<signed char> >::back (312,069 samples, 0.03%)
void std::allocator_traits<std::allocator<std::_List_node<ns3::Ptr<ns3::Packet> > > >::destroy<ns3::Ptr<ns3::Packet> > (274,123 samples, 0.03%)
ns3::Ptr<ns3::Packet> ns3::Create<ns3::Packet, unsigned int&> (2,698,693 samples, 0.28%)
(237,842 samples, 0.02%)
__gnu_cxx::__aligned_membuf<std::pair<unsigned short const, unsigned char> >::_M_ptr (151,024 samples, 0.02%)
std::__cxx11::list<ns3::Ptr<ns3::LteControlMessage>, std::allocator<ns3::Ptr<ns3::LteControlMessage> > >::~list (318,396 samples, 0.03%)
ns3::MakeEvent<void (566,805 samples, 0.06%)
ns3::MultiModelSpectrumChannel::StartTx (34,755,711 samples, 3.58%) n..
__gnu_cxx::__normal_iterator<ns3::HigherLayerSelected_s*, std::vector<ns3::HigherLayerSelected_s, std::allocator<ns3::HigherLayerSelected_s> > > std::copy<__gnu_cxx::__normal_iterator<ns3::HigherLayerSelected_s const*, std::vector<ns3::HigherLayerSelected_s, std::allocator<ns3::HigherLayerSelected_s> > >, __gnu_cxx::__normal_iterator<ns3::HigherLayerSelected_s*, std::vector<ns3::HigherLayerSelected_s, std::allocator<ns3::HigherLayerSelected_s> > > > (231,948 samples, 0.02%)
std::vector<int, std::allocator<int> >::_M_range_check (157,629 samples, 0.02%)
std::map<int, double, std::less<int>, std::allocator<std::pair<int const, double> > >::map (2,417,353 samples, 0.25%)
std::_Rb_tree<ns3::Scheduler::EventKey, std::pair<ns3::Scheduler::EventKey const, ns3::EventImpl*>, std::_Select1st<std::pair<ns3::Scheduler::EventKey const, ns3::EventImpl*> >, std::less<ns3::Scheduler::EventKey>, std::allocator<std::pair<ns3::Scheduler::EventKey const, ns3::EventImpl*> > >::_Auto_node::_Auto_node<std::pair<ns3::Scheduler::EventKey, ns3::EventImpl*> > (1,948,514 samples, 0.20%)
ns3::MemberSchedSapProvider<ns3::PfFfMacScheduler>::SchedDlCqiInfoReq (1,099,949 samples, 0.11%)
ns3::Ptr<ns3::PacketBurst> ns3::Create<ns3::PacketBurst> (619,901 samples, 0.06%)
std::_Rb_tree_node<std::pair<unsigned short const, std::vector<std::vector<ns3::HarqProcessInfoElement_t, std::allocator<ns3::HarqProcessInfoElement_t> >, std::allocator<std::vector<ns3::HarqProcessInfoElement_t, std::allocator<ns3::HarqProcessInfoElement_t> > > > > >::_M_valptr (246,841 samples, 0.03%)
std::vector<bool, std::allocator<bool> >::_M_range_check (423,259 samples, 0.04%)
ns3::PacketBurst::~PacketBurst (650,228 samples, 0.07%)
std::__cxx11::list<ns3::Ptr<ns3::LteControlMessage>, std::allocator<ns3::Ptr<ns3::LteControlMessage> > >::splice (569,667 samples, 0.06%)
std::_Identity<unsigned short>::operator (157,285 samples, 0.02%)
ns3::Angles::Angles (2,693,187 samples, 0.28%)
std::_Vector_base<ns3::UlInfoListElement_s, std::allocator<ns3::UlInfoListElement_s> >::_Vector_base (164,622 samples, 0.02%)
std::_Rb_tree<unsigned char, std::pair<unsigned char const, ns3::LteMacSapProvider*>, std::_Select1st<std::pair<unsigned char const, ns3::LteMacSapProvider*> >, std::less<unsigned char>, std::allocator<std::pair<unsigned char const, ns3::LteMacSapProvider*> > >::_M_begin (168,913 samples, 0.02%)
std::set<unsigned short, std::less<unsigned short>, std::allocator<unsigned short> >::find (313,960 samples, 0.03%)
void std::allocator_traits<std::allocator<ns3::Ptr<ns3::PacketBurst> > >::construct<ns3::Ptr<ns3::PacketBurst>, ns3::Ptr<ns3::PacketBurst> > (181,678 samples, 0.02%)
ns3::SimpleRefCount<ns3::Object, ns3::ObjectBase, ns3::ObjectDeleter>::Ref (125,424 samples, 0.01%)
ns3::Ptr<ns3::EventImpl>::operator= (648,075 samples, 0.07%)
ns3::Buffer::Create (159,596 samples, 0.02%)
std::map<unsigned int, ns3::RxSpectrumModelInfo, std::less<unsigned int>, std::allocator<std::pair<unsigned int const, ns3::RxSpectrumModelInfo> > >::end (198,183 samples, 0.02%)
std::_Vector_base<unsigned char, std::allocator<unsigned char> >::_Vector_impl::_Vector_impl (259,221 samples, 0.03%)
void std::_Destroy<ns3::DlInfoListElement_s> (1,227,211 samples, 0.13%)
ns3::MakeEvent<void (405,218 samples, 0.04%)
std::__cxx11::_List_base<ns3::Ptr<ns3::Packet>, std::allocator<ns3::Ptr<ns3::Packet> > >::_List_impl::_List_impl (197,757 samples, 0.02%)
std::tuple_element<1ul, std::pair<unsigned int const&, ns3::Ptr<ns3::SpectrumValue>&> >::type&& std::get<1ul, unsigned int const&, ns3::Ptr<ns3::SpectrumValue>&> (152,590 samples, 0.02%)
ns3::SpectrumValue::~SpectrumValue (189,290 samples, 0.02%)
ns3::Ptr<ns3::LteControlMessage>& std::__cxx11::list<ns3::Ptr<ns3::LteControlMessage>, std::allocator<ns3::Ptr<ns3::LteControlMessage> > >::emplace_back<ns3::Ptr<ns3::LteControlMessage> const&> (225,934 samples, 0.02%)
std::_Rb_tree<int, std::pair<int const, double>, std::_Select1st<std::pair<int const, double> >, std::less<int>, std::allocator<std::pair<int const, double> > >::_M_lower_bound (639,648 samples, 0.07%)
ns3::PhichListElement_s* std::__uninitialized_copy<false>::__uninit_copy<__gnu_cxx::__normal_iterator<ns3::PhichListElement_s const*, std::vector<ns3::PhichListElement_s, std::allocator<ns3::PhichListElement_s> > >, ns3::PhichListElement_s*> (202,017 samples, 0.02%)
unsigned short* std::__relocate_a<unsigned short*, unsigned short*, std::allocator<unsigned short> > (305,556 samples, 0.03%)
std::_Vector_base<ns3::VendorSpecificListElement_s, std::allocator<ns3::VendorSpecificListElement_s> >::_Vector_base (159,454 samples, 0.02%)
ns3::Packet::Packet (409,200 samples, 0.04%)
std::function<void (16,491,026 samples, 1.70%)
std::_Vector_base<double, std::allocator<double> >::_M_create_storage (747,048 samples, 0.08%)
std::vector<double, std::allocator<double> >::vector (745,343 samples, 0.08%)
ns3::Object::Object (146,079 samples, 0.02%)
ns3::EventId ns3::Simulator::Schedule<void (3,817,837 samples, 0.39%)
std::_List_node<ns3::Ptr<ns3::Packet> >* std::__cxx11::list<ns3::Ptr<ns3::Packet>, std::allocator<ns3::Ptr<ns3::Packet> > >::_M_create_node<ns3::Ptr<ns3::Packet> const&> (1,799,993 samples, 0.19%)
std::_Vector_base<unsigned char, std::allocator<unsigned char> >::~_Vector_base (162,616 samples, 0.02%)
std::_Rb_tree_node<std::pair<unsigned int const, ns3::Ptr<ns3::SpectrumValue> > >* std::_Rb_tree<unsigned int, std::pair<unsigned int const, ns3::Ptr<ns3::SpectrumValue> >, std::_Select1st<std::pair<unsigned int const, ns3::Ptr<ns3::SpectrumValue> > >, std::less<unsigned int>, std::allocator<std::pair<unsigned int const, ns3::Ptr<ns3::SpectrumValue> > > >::_M_clone_node<false, std::_Rb_tree<unsigned int, std::pair<unsigned int const, ns3::Ptr<ns3::SpectrumValue> >, std::_Select1st<std::pair<unsigned int const, ns3::Ptr<ns3::SpectrumValue> > >, std::less<unsigned int>, std::allocator<std::pair<unsigned int const, ns3::Ptr<ns3::SpectrumValue> > > >::_Alloc_node> (578,209 samples, 0.06%)
std::vector<short, std::allocator<short> >::operator[] (262,863 samples, 0.03%)
std::vector<int, std::allocator<int> >::~vector (426,273 samples, 0.04%)
void std::_Destroy<__gnu_cxx::__normal_iterator<ns3::DlInfoListElement_s*, std::vector<ns3::DlInfoListElement_s, std::allocator<ns3::DlInfoListElement_s> > > > (300,135 samples, 0.03%)
ns3::Simulator::ScheduleWithContext (5,518,602 samples, 0.57%)
std::enable_if<is_member_pointer_v<void (2,862,534 samples, 0.30%)
std::vector<ns3::BuildBroadcastListElement_s, std::allocator<ns3::BuildBroadcastListElement_s> >::vector (318,568 samples, 0.03%)
operator new (275,672 samples, 0.03%)
ns3::DlInfoListElement_s::HarqStatus_e const* std::__niter_base<ns3::DlInfoListElement_s::HarqStatus_e const*, std::vector<ns3::DlInfoListElement_s::HarqStatus_e, std::allocator<ns3::DlInfoListElement_s::HarqStatus_e> > > (201,685 samples, 0.02%)
std::_Rb_tree_iterator<std::pair<unsigned short const, std::vector<unsigned short, std::allocator<unsigned short> > > > std::_Rb_tree<unsigned short, std::pair<unsigned short const, std::vector<unsigned short, std::allocator<unsigned short> > >, std::_Select1st<std::pair<unsigned short const, std::vector<unsigned short, std::allocator<unsigned short> > > >, std::less<unsigned short>, std::allocator<std::pair<unsigned short const, std::vector<unsigned short, std::allocator<unsigned short> > > > >::_M_emplace_hint_unique<std::piecewise_construct_t const&, std::tuple<unsigned short const&>, std::tuple<> > (2,400,209 samples, 0.25%)
ns3::Ptr<ns3::SpectrumValue>::operator= (266,358 samples, 0.03%)
std::_Tuple_impl<4ul, ns3::Ptr<ns3::SpectrumPhy>, std::map<unsigned int, ns3::Ptr<ns3::SpectrumValue>, std::less<unsigned int>, std::allocator<std::pair<unsigned int const, ns3::Ptr<ns3::SpectrumValue> > > > >::_M_head (235,982 samples, 0.02%)
std::vector<ns3::DlInfoListElement_s::HarqStatus_e, std::allocator<ns3::DlInfoListElement_s::HarqStatus_e> >::size (236,264 samples, 0.02%)
std::vector<ns3::RlcPduListElement_s, std::allocator<ns3::RlcPduListElement_s> >* std::uninitialized_copy<__gnu_cxx::__normal_iterator<std::vector<ns3::RlcPduListElement_s, std::allocator<ns3::RlcPduListElement_s> > const*, std::vector<std::vector<ns3::RlcPduListElement_s, std::allocator<ns3::RlcPduListElement_s> >, std::allocator<std::vector<ns3::RlcPduListElement_s, std::allocator<ns3::RlcPduListElement_s> > > > >, std::vector<ns3::RlcPduListElement_s, std::allocator<ns3::RlcPduListElement_s> >*> (338,383 samples, 0.03%)
ns3::LteHelper::InstallSingleUeDevice (533,991 samples, 0.06%)
std::_Vector_base<int, std::allocator<int> >::_Vector_base (1,201,262 samples, 0.12%)
ns3::Ptr<ns3::SpectrumValue>::operator= (508,044 samples, 0.05%)
ns3::Ptr<ns3::LteInterference>::operator (201,121 samples, 0.02%)
__gnu_cxx::__normal_iterator<double*, std::vector<double, std::allocator<double> > > std::__copy_move_a<false, __gnu_cxx::__normal_iterator<double const*, std::vector<double, std::allocator<double> > >, __gnu_cxx::__normal_iterator<double*, std::vector<double, std::allocator<double> > > > (1,070,364 samples, 0.11%)
std::__new_allocator<unsigned char>::deallocate (197,176 samples, 0.02%)
std::_Rb_tree_iterator<std::pair<ns3::Scheduler::EventKey const, ns3::EventImpl*> >&& std::forward<std::_Rb_tree_iterator<std::pair<ns3::Scheduler::EventKey const, ns3::EventImpl*> > > (194,342 samples, 0.02%)
ns3::Tag::Tag (159,113 samples, 0.02%)
void std::_Function_base::_Base_manager<std::_Bind<void (945,769 samples, 0.10%)
std::pair<ns3::TbId_t const, ns3::tbInfo_t>::pair<ns3::TbId_t, ns3::tbInfo_t> (979,889 samples, 0.10%)
std::__new_allocator<std::_List_node<ns3::Ptr<ns3::Packet> > >::allocate (366,512 samples, 0.04%)
std::vector<unsigned short, std::allocator<unsigned short> >::vector (546,034 samples, 0.06%)
ns3::Ptr<ns3::LteInterference>::operator (124,598 samples, 0.01%)
ns3::EnbMacMemberFfMacSchedSapUser::SchedDlConfigInd (2,983,151 samples, 0.31%)
std::_Rb_tree<unsigned int, std::pair<unsigned int const, ns3::Ptr<ns3::SpectrumValue> >, std::_Select1st<std::pair<unsigned int const, ns3::Ptr<ns3::SpectrumValue> > >, std::less<unsigned int>, std::allocator<std::pair<unsigned int const, ns3::Ptr<ns3::SpectrumValue> > > >::_Rb_tree (160,265 samples, 0.02%)
unsigned short* std::copy<__gnu_cxx::__normal_iterator<unsigned short const*, std::vector<unsigned short, std::allocator<unsigned short> > >, unsigned short*> (545,960 samples, 0.06%)
std::vector<double, std::allocator<double> >::~vector (195,505 samples, 0.02%)
__gnu_cxx::__aligned_membuf<std::pair<unsigned short const, std::vector<std::vector<std::vector<ns3::RlcPduListElement_s, std::allocator<ns3::RlcPduListElement_s> >, std::allocator<std::vector<ns3::RlcPduListElement_s, std::allocator<ns3::RlcPduListElement_s> > > >, std::allocator<std::vector<std::vector<ns3::RlcPduListElement_s, std::allocator<ns3::RlcPduListElement_s> >, std::allocator<std::vector<ns3::RlcPduListElement_s, std::allocator<ns3::RlcPduListElement_s> > > > > > > >::_M_ptr (160,795 samples, 0.02%)
ns3::Ptr<ns3::SpectrumModel const>::Ptr (152,357 samples, 0.02%)
std::_Function_base::_Base_manager<std::_Bind<void (169,831 samples, 0.02%)
std::_Bind<void (522,269 samples, 0.05%)
std::pair<unsigned short const, std::vector<double, std::allocator<double> > >::~pair (514,929 samples, 0.05%)
std::__cxx11::_List_base<ns3::Ptr<ns3::Packet>, std::allocator<ns3::Ptr<ns3::Packet> > >::_M_clear (1,296,666 samples, 0.13%)
ns3::HigherLayerSelected_s* std::uninitialized_copy<__gnu_cxx::__normal_iterator<ns3::HigherLayerSelected_s const*, std::vector<ns3::HigherLayerSelected_s, std::allocator<ns3::HigherLayerSelected_s> > >, ns3::HigherLayerSelected_s*> (213,295 samples, 0.02%)
ns3::LteRlcSm::DoNotifyTxOpportunity (6,454,365 samples, 0.67%)
ns3::SpectrumValue::Copy (4,171,628 samples, 0.43%)
void std::__invoke_impl<void, void (22,443,594 samples, 2.31%)
std::function<void (411,411 samples, 0.04%)
std::_Rb_tree_node<std::pair<unsigned short const, std::vector<std::vector<ns3::HarqProcessInfoElement_t, std::allocator<ns3::HarqProcessInfoElement_t> >, std::allocator<std::vector<ns3::HarqProcessInfoElement_t, std::allocator<ns3::HarqProcessInfoElement_t> > > > > >::_M_valptr (433,714 samples, 0.04%)
ns3::HarqProcessInfoElement_t* std::__copy_move_a1<false, ns3::HarqProcessInfoElement_t const*, ns3::HarqProcessInfoElement_t*> (363,923 samples, 0.04%)
std::vector<unsigned short, std::allocator<unsigned short> >::vector (234,034 samples, 0.02%)
ns3::MakeEvent<void (746,893 samples, 0.08%)
double* std::__fill_n_a<double*, unsigned long, double> (387,157 samples, 0.04%)
__gnu_cxx::__aligned_membuf<std::pair<unsigned short const, unsigned char> >::_M_ptr (152,886 samples, 0.02%)
std::map<unsigned short, ns3::LteEnbComponentCarrierManager::UeInfo, std::less<unsigned short>, std::allocator<std::pair<unsigned short const, ns3::LteEnbComponentCarrierManager::UeInfo> > >::key_comp (161,213 samples, 0.02%)
ns3::Ptr<ns3::SpectrumValue> ns3::Create<ns3::SpectrumValue, ns3::Ptr<ns3::SpectrumModel const> const&> (1,570,376 samples, 0.16%)
std::vector<std::__cxx11::list<ns3::Ptr<ns3::LteControlMessage>, std::allocator<ns3::Ptr<ns3::LteControlMessage> > >, std::allocator<std::__cxx11::list<ns3::Ptr<ns3::LteControlMessage>, std::allocator<ns3::Ptr<ns3::LteControlMessage> > > > >::size (333,221 samples, 0.03%)
ns3::SimpleUeCcmMacSapProvider::TransmitPdu (7,708,007 samples, 0.79%)
int* std::__copy_move_a2<false, int const*, int*> (197,211 samples, 0.02%)
std::_Rb_tree<unsigned short, std::pair<unsigned short const, std::vector<ns3::DlDciListElement_s, std::allocator<ns3::DlDciListElement_s> > >, std::_Select1st<std::pair<unsigned short const, std::vector<ns3::DlDciListElement_s, std::allocator<ns3::DlDciListElement_s> > > >, std::less<unsigned short>, std::allocator<std::pair<unsigned short const, std::vector<ns3::DlDciListElement_s, std::allocator<ns3::DlDciListElement_s> > > > >::_M_lower_bound (576,429 samples, 0.06%)
ns3::LteMiErrorModel::GetTbDecodificationStats (2,544,923 samples, 0.26%)
ns3::SimpleRefCount<ns3::EventImpl, ns3::Empty, ns3::DefaultDeleter<ns3::EventImpl> >::Ref (587,755 samples, 0.06%)
std::_Rb_tree_node<std::pair<int const, double> >* std::_Rb_tree<int, std::pair<int const, double>, std::_Select1st<std::pair<int const, double> >, std::less<int>, std::allocator<std::pair<int const, double> > >::_M_copy<false, std::_Rb_tree<int, std::pair<int const, double>, std::_Select1st<std::pair<int const, double> >, std::less<int>, std::allocator<std::pair<int const, double> > >::_Alloc_node> (167,564 samples, 0.02%)
ns3::operator- (4,813,626 samples, 0.50%)
std::_List_const_iterator<ns3::UlDciLteControlMessage>::operator* (302,866 samples, 0.03%)
void std::allocator_traits<std::allocator<ns3::Ptr<ns3::PacketBurst> > >::destroy<ns3::Ptr<ns3::PacketBurst> > (359,626 samples, 0.04%)
ns3::TypeId::TypeId (279,495 samples, 0.03%)
ns3::Ptr<ns3::SpectrumValue>::operator= (483,084 samples, 0.05%)
__gnu_cxx::__normal_iterator<double const*, std::vector<double, std::allocator<double> > >::operator++ (206,864 samples, 0.02%)
std::_Rb_tree_node<std::pair<unsigned short const, std::vector<double, std::allocator<double> > > >* std::_Rb_tree<unsigned short, std::pair<unsigned short const, std::vector<double, std::allocator<double> > >, std::_Select1st<std::pair<unsigned short const, std::vector<double, std::allocator<double> > > >, std::less<unsigned short>, std::allocator<std::pair<unsigned short const, std::vector<double, std::allocator<double> > > > >::_M_copy<false, std::_Rb_tree<unsigned short, std::pair<unsigned short const, std::vector<double, std::allocator<double> > >, std::_Select1st<std::pair<unsigned short const, std::vector<double, std::allocator<double> > > >, std::less<unsigned short>, std::allocator<std::pair<unsigned short const, std::vector<double, std::allocator<double> > > > >::_Alloc_node> (4,497,480 samples, 0.46%)
std::vector<ns3::MacCeListElement_s, std::allocator<ns3::MacCeListElement_s> >::_M_range_check (199,808 samples, 0.02%)
ns3::int64x64_t::Mul (321,020 samples, 0.03%)
std::vector<unsigned char, std::allocator<unsigned char> >::at (161,842 samples, 0.02%)
std::_Rb_tree<ns3::LteFlowId_t, std::pair<ns3::LteFlowId_t const, ns3::FfMacSchedSapProvider::SchedDlRlcBufferReqParameters>, std::_Select1st<std::pair<ns3::LteFlowId_t const, ns3::FfMacSchedSapProvider::SchedDlRlcBufferReqParameters> >, std::less<ns3::LteFlowId_t>, std::allocator<std::pair<ns3::LteFlowId_t const, ns3::FfMacSchedSapProvider::SchedDlRlcBufferReqParameters> > >::_M_begin (226,804 samples, 0.02%)
std::vector<ns3::BuildDataListElement_s, std::allocator<ns3::BuildDataListElement_s> >::~vector (1,027,011 samples, 0.11%)
__gnu_cxx::__normal_iterator<ns3::Ptr<ns3::PacketBurst>*, std::vector<ns3::Ptr<ns3::PacketBurst>, std::allocator<ns3::Ptr<ns3::PacketBurst> > > > std::__copy_move_a<true, __gnu_cxx::__normal_iterator<ns3::Ptr<ns3::PacketBurst>*, std::vector<ns3::Ptr<ns3::PacketBurst>, std::allocator<ns3::Ptr<ns3::PacketBurst> > > >, __gnu_cxx::__normal_iterator<ns3::Ptr<ns3::PacketBurst>*, std::vector<ns3::Ptr<ns3::PacketBurst>, std::allocator<ns3::Ptr<ns3::PacketBurst> > > > > (6,281,286 samples, 0.65%)
__gnu_cxx::__normal_iterator<std::vector<ns3::HarqProcessInfoElement_t, std::allocator<ns3::HarqProcessInfoElement_t> >*, std::vector<std::vector<ns3::HarqProcessInfoElement_t, std::allocator<ns3::HarqProcessInfoElement_t> >, std::allocator<std::vector<ns3::HarqProcessInfoElement_t, std::allocator<ns3::HarqProcessInfoElement_t> > > > > std::__copy_move_a<true, __gnu_cxx::__normal_iterator<std::vector<ns3::HarqProcessInfoElement_t, std::allocator<ns3::HarqProcessInfoElement_t> >*, std::vector<std::vector<ns3::HarqProcessInfoElement_t, std::allocator<ns3::HarqProcessInfoElement_t> >, std::allocator<std::vector<ns3::HarqProcessInfoElement_t, std::allocator<ns3::HarqProcessInfoElement_t> > > > >, __gnu_cxx::__normal_iterator<std::vector<ns3::HarqProcessInfoElement_t, std::allocator<ns3::HarqProcessInfoElement_t> >*, std::vector<std::vector<ns3::HarqProcessInfoElement_t, std::allocator<ns3::HarqProcessInfoElement_t> >, std::allocator<std::vector<ns3::HarqProcessInfoElement_t, std::allocator<ns3::HarqProcessInfoElement_t> > > > > > (2,950,423 samples, 0.30%)
std::vector<int, std::allocator<int> >::reserve (275,928 samples, 0.03%)
std::vector<ns3::BuildRarListElement_s, std::allocator<ns3::BuildRarListElement_s> >::~vector (359,781 samples, 0.04%)
ns3::Ptr<ns3::LteUePhy>::Ptr (241,564 samples, 0.02%)
std::__cxx11::list<ns3::Ptr<ns3::LteControlMessage>, std::allocator<ns3::Ptr<ns3::LteControlMessage> > >::list (143,971 samples, 0.01%)
ns3::MultiModelSpectrumChannel::StartTx (41,833,100 samples, 4.31%) ns..
ns3::SpectrumValue::GetSpectrumModelUid (187,543 samples, 0.02%)
std::__cxx11::list<ns3::Ptr<ns3::Packet>, std::allocator<ns3::Ptr<ns3::Packet> > >::push_back (2,043,826 samples, 0.21%)
std::operator== (317,205 samples, 0.03%)
ns3::LteEnbMac::DoReceivePhyPdu (13,857,739 samples, 1.43%)
ns3::LteEnbMac::DoReportBufferStatus (3,928,142 samples, 0.41%)
ns3::UeManager::GetComponentCarrierId (352,536 samples, 0.04%)
bool __gnu_cxx::operator==<ns3::DlInfoListElement_s const*, std::vector<ns3::DlInfoListElement_s, std::allocator<ns3::DlInfoListElement_s> > > (279,570 samples, 0.03%)
ns3::Scheduler::EventKey const& std::forward<ns3::Scheduler::EventKey const&> (206,377 samples, 0.02%)
ns3::LogComponent::IsEnabled (129,958 samples, 0.01%)
std::_Rb_tree_node<std::pair<unsigned int const, ns3::Ptr<ns3::SpectrumValue> > >* std::_Rb_tree<unsigned int, std::pair<unsigned int const, ns3::Ptr<ns3::SpectrumValue> >, std::_Select1st<std::pair<unsigned int const, ns3::Ptr<ns3::SpectrumValue> > >, std::less<unsigned int>, std::allocator<std::pair<unsigned int const, ns3::Ptr<ns3::SpectrumValue> > > >::_Alloc_node::operator (500,996 samples, 0.05%)
std::_Head_base<5ul, std::map<unsigned int, ns3::Ptr<ns3::SpectrumValue>, std::less<unsigned int>, std::allocator<std::pair<unsigned int const, ns3::Ptr<ns3::SpectrumValue> > > >, false>::_M_head (220,389 samples, 0.02%)
ns3::Ptr<ns3::LteSpectrumSignalParametersDlCtrlFrame>::~Ptr (273,890 samples, 0.03%)
std::vector<ns3::CqiListElement_s, std::allocator<ns3::CqiListElement_s> >::empty (335,401 samples, 0.03%)
std::_Rb_tree<ns3::Scheduler::EventKey, std::pair<ns3::Scheduler::EventKey const, ns3::EventImpl*>, std::_Select1st<std::pair<ns3::Scheduler::EventKey const, ns3::EventImpl*> >, std::less<ns3::Scheduler::EventKey>, std::allocator<std::pair<ns3::Scheduler::EventKey const, ns3::EventImpl*> > >::_Auto_node::_M_insert (362,836 samples, 0.04%)
double std::reduce<__gnu_cxx::__normal_iterator<double const*, std::vector<double, std::allocator<double> > >, double> (335,268 samples, 0.03%)
std::vector<ns3::HigherLayerSelected_s, std::allocator<ns3::HigherLayerSelected_s> >::~vector (126,894 samples, 0.01%)
ns3::SimpleRefCount<ns3::LteControlMessage, ns3::Empty, ns3::DefaultDeleter<ns3::LteControlMessage> >::Unref (269,841 samples, 0.03%)
unsigned char* std::uninitialized_copy<__gnu_cxx::__normal_iterator<unsigned char const*, std::vector<unsigned char, std::allocator<unsigned char> > >, unsigned char*> (407,753 samples, 0.04%)
ns3::DlInfoListElement_s::HarqStatus_e* std::uninitialized_copy<__gnu_cxx::__normal_iterator<ns3::DlInfoListElement_s::HarqStatus_e const*, std::vector<ns3::DlInfoListElement_s::HarqStatus_e, std::allocator<ns3::DlInfoListElement_s::HarqStatus_e> > >, ns3::DlInfoListElement_s::HarqStatus_e*> (2,097,386 samples, 0.22%)
ns3::EnbMacMemberLteMacSapProvider<ns3::NoOpComponentCarrierManager>::TransmitPdu (5,821,892 samples, 0.60%)
ns3::SpectrumValue::Add (355,914 samples, 0.04%)
ns3::MakeEvent<void (2,295,946 samples, 0.24%)
std::vector<ns3::BandInfo, std::allocator<ns3::BandInfo> >::size (125,001 samples, 0.01%)
std::_Rb_tree<ns3::LteSpectrumModelId, std::pair<ns3::LteSpectrumModelId const, ns3::Ptr<ns3::SpectrumModel> >, std::_Select1st<std::pair<ns3::LteSpectrumModelId const, ns3::Ptr<ns3::SpectrumModel> > >, std::less<ns3::LteSpectrumModelId>, std::allocator<std::pair<ns3::LteSpectrumModelId const, ns3::Ptr<ns3::SpectrumModel> > > >::_M_lower_bound (860,518 samples, 0.09%)
std::__cxx11::list<ns3::Ptr<ns3::LteControlMessage>, std::allocator<ns3::Ptr<ns3::LteControlMessage> > >* std::__copy_move_a2<true, std::__cxx11::list<ns3::Ptr<ns3::LteControlMessage>, std::allocator<ns3::Ptr<ns3::LteControlMessage> > >*, std::__cxx11::list<ns3::Ptr<ns3::LteControlMessage>, std::allocator<ns3::Ptr<ns3::LteControlMessage> > >*> (802,162 samples, 0.08%)
ns3::LteRadioBearerTag::GetInstanceTypeId (294,229 samples, 0.03%)
ns3::tbInfo_t::tbInfo_t (180,616 samples, 0.02%)
std::vector<ns3::RlcPduListElement_s, std::allocator<ns3::RlcPduListElement_s> >* std::__uninitialized_copy_a<__gnu_cxx::__normal_iterator<std::vector<ns3::RlcPduListElement_s, std::allocator<ns3::RlcPduListElement_s> > const*, std::vector<std::vector<ns3::RlcPduListElement_s, std::allocator<ns3::RlcPduListElement_s> >, std::allocator<std::vector<ns3::RlcPduListElement_s, std::allocator<ns3::RlcPduListElement_s> > > > >, std::vector<ns3::RlcPduListElement_s, std::allocator<ns3::RlcPduListElement_s> >*, std::vector<ns3::RlcPduListElement_s, std::allocator<ns3::RlcPduListElement_s> > > (379,647 samples, 0.04%)
std::_Rb_tree<unsigned char, std::pair<unsigned char const, ns3::LteMacSapUser*>, std::_Select1st<std::pair<unsigned char const, ns3::LteMacSapUser*> >, std::less<unsigned char>, std::allocator<std::pair<unsigned char const, ns3::LteMacSapUser*> > >::lower_bound (305,767 samples, 0.03%)
ns3::Buffer::~Buffer (935,423 samples, 0.10%)
std::_Rb_tree<ns3::TbId_t, std::pair<ns3::TbId_t const, ns3::tbInfo_t>, std::_Select1st<std::pair<ns3::TbId_t const, ns3::tbInfo_t> >, std::less<ns3::TbId_t>, std::allocator<std::pair<ns3::TbId_t const, ns3::tbInfo_t> > >::_M_begin (195,833 samples, 0.02%)
std::_Vector_base<unsigned char, std::allocator<unsigned char> >::_Vector_base (158,373 samples, 0.02%)
ns3::LteSpectrumPhy::GetMobility (675,169 samples, 0.07%)
double* std::__copy_move_a1<false, double const*, double*> (148,743 samples, 0.02%)
std::_Rb_tree_node<std::pair<ns3::Scheduler::EventKey const, ns3::EventImpl*> >::_M_valptr (272,221 samples, 0.03%)
ns3::Ptr<ns3::MobilityModel const>::Ptr<ns3::MobilityModel> (371,286 samples, 0.04%)
std::vector<ns3::HarqProcessInfoElement_t, std::allocator<ns3::HarqProcessInfoElement_t> >::size (156,363 samples, 0.02%)
std::function<void (358,805 samples, 0.04%)
std::_Rb_tree<ns3::Scheduler::EventKey, std::pair<ns3::Scheduler::EventKey const, ns3::EventImpl*>, std::_Select1st<std::pair<ns3::Scheduler::EventKey const, ns3::EventImpl*> >, std::less<ns3::Scheduler::EventKey>, std::allocator<std::pair<ns3::Scheduler::EventKey const, ns3::EventImpl*> > >::_Auto_node::_Auto_node<std::pair<ns3::Scheduler::EventKey, ns3::EventImpl*> > (1,386,008 samples, 0.14%)
ns3::Ptr<ns3::PacketBurst> ns3::CompleteConstruct<ns3::PacketBurst> (267,173 samples, 0.03%)
std::vector<ns3::Ptr<ns3::Object>, std::allocator<ns3::Ptr<ns3::Object> > >::~vector (272,555 samples, 0.03%)
std::__new_allocator<ns3::DlInfoListElement_s::HarqStatus_e>::allocate (160,414 samples, 0.02%)
ns3::LteEnbMac::DoUlCqiReport (763,690 samples, 0.08%)
std::_Rb_tree<unsigned short, std::pair<unsigned short const, std::vector<unsigned short, std::allocator<unsigned short> > >, std::_Select1st<std::pair<unsigned short const, std::vector<unsigned short, std::allocator<unsigned short> > > >, std::less<unsigned short>, std::allocator<std::pair<unsigned short const, std::vector<unsigned short, std::allocator<unsigned short> > > > >::erase[abi:cxx11] (940,554 samples, 0.10%)
ns3::EnbMacMemberLteMacSapProvider<ns3::NoOpComponentCarrierManager>::ReportBufferStatus (6,485,597 samples, 0.67%)
std::_Vector_base<ns3::DlInfoListElement_s::HarqStatus_e, std::allocator<ns3::DlInfoListElement_s::HarqStatus_e> >::~_Vector_base (496,198 samples, 0.05%)
unsigned char& std::vector<unsigned char, std::allocator<unsigned char> >::emplace_back<unsigned char> (1,247,040 samples, 0.13%)
ns3::FfMacSchedSapProvider::SchedDlCqiInfoReqParameters::~SchedDlCqiInfoReqParameters (153,009 samples, 0.02%)
std::_Rb_tree_node<std::pair<ns3::Scheduler::EventKey const, ns3::EventImpl*> >::_M_valptr (512,316 samples, 0.05%)
std::vector<unsigned char, std::allocator<unsigned char> >::_S_relocate (191,891 samples, 0.02%)
ns3::HarqProcessInfoElement_t* std::copy<__gnu_cxx::__normal_iterator<ns3::HarqProcessInfoElement_t const*, std::vector<ns3::HarqProcessInfoElement_t, std::allocator<ns3::HarqProcessInfoElement_t> > >, ns3::HarqProcessInfoElement_t*> (1,453,727 samples, 0.15%)
std::_List_iterator<ns3::Ptr<ns3::Packet> >::_List_iterator (173,879 samples, 0.02%)
std::vector<bool, std::allocator<bool> >::end (277,788 samples, 0.03%)
__gnu_cxx::__enable_if<std::__is_scalar<unsigned short>::__value, void>::__type std::__fill_a1<unsigned short*, unsigned short> (151,573 samples, 0.02%)
std::_Rb_tree_iterator<std::pair<unsigned int const, ns3::RxSpectrumModelInfo> >::operator (451,603 samples, 0.05%)
std::map<unsigned char, ns3::LteMacSapUser*, std::less<unsigned char>, std::allocator<std::pair<unsigned char const, ns3::LteMacSapUser*> > >::find (1,845,503 samples, 0.19%)
std::__cxx11::list<ns3::Ptr<ns3::LteControlMessage>, std::allocator<ns3::Ptr<ns3::LteControlMessage> > >::list<std::_List_const_iterator<ns3::Ptr<ns3::LteControlMessage> >, void> (724,578 samples, 0.07%)
ns3::FfMacSchedSapUser::SchedDlConfigIndParameters::SchedDlConfigIndParameters (703,718 samples, 0.07%)
std::_Rb_tree<ns3::TbId_t, std::pair<ns3::TbId_t const, ns3::tbInfo_t>, std::_Select1st<std::pair<ns3::TbId_t const, ns3::tbInfo_t> >, std::less<ns3::TbId_t>, std::allocator<std::pair<ns3::TbId_t const, ns3::tbInfo_t> > >::_S_key (335,546 samples, 0.03%)
std::__cxx11::_List_base<ns3::Ptr<ns3::LteControlMessage>, std::allocator<ns3::Ptr<ns3::LteControlMessage> > >::_M_clear (343,413 samples, 0.04%)
std::_Rb_tree<unsigned short, std::pair<unsigned short const, std::vector<std::vector<ns3::HarqProcessInfoElement_t, std::allocator<ns3::HarqProcessInfoElement_t> >, std::allocator<std::vector<ns3::HarqProcessInfoElement_t, std::allocator<ns3::HarqProcessInfoElement_t> > > > >, std::_Select1st<std::pair<unsigned short const, std::vector<std::vector<ns3::HarqProcessInfoElement_t, std::allocator<ns3::HarqProcessInfoElement_t> >, std::allocator<std::vector<ns3::HarqProcessInfoElement_t, std::allocator<ns3::HarqProcessInfoElement_t> > > > > >, std::less<unsigned short>, std::allocator<std::pair<unsigned short const, std::vector<std::vector<ns3::HarqProcessInfoElement_t, std::allocator<ns3::HarqProcessInfoElement_t> >, std::allocator<std::vector<ns3::HarqProcessInfoElement_t, std::allocator<ns3::HarqProcessInfoElement_t> > > > > > >::_M_lower_bound (1,211,299 samples, 0.12%)
std::map<unsigned short, ns3::pfsFlowPerf_t, std::less<unsigned short>, std::allocator<std::pair<unsigned short const, ns3::pfsFlowPerf_t> > >::find (767,082 samples, 0.08%)
std::_Rb_tree<unsigned short, std::pair<unsigned short const, ns3::SbMeasResult_s>, std::_Select1st<std::pair<unsigned short const, ns3::SbMeasResult_s> >, std::less<unsigned short>, std::allocator<std::pair<unsigned short const, ns3::SbMeasResult_s> > >::find (873,028 samples, 0.09%)
std::_Vector_base<double, std::allocator<double> >::_M_create_storage (275,818 samples, 0.03%)
std::tuple_element<0ul, std::tuple<ns3::LteInterference*, ns3::Ptr<ns3::SpectrumValue const>, unsigned int> >::type& std::get<0ul, ns3::LteInterference*, ns3::Ptr<ns3::SpectrumValue const>, unsigned int> (694,870 samples, 0.07%)
ns3::HigherLayerSelected_s* std::__uninitialized_copy<false>::__uninit_copy<__gnu_cxx::__normal_iterator<ns3::HigherLayerSelected_s const*, std::vector<ns3::HigherLayerSelected_s, std::allocator<ns3::HigherLayerSelected_s> > >, ns3::HigherLayerSelected_s*> (151,182 samples, 0.02%)
std::vector<double, std::allocator<double> >::size (251,934 samples, 0.03%)
ns3::Packet::FindFirstMatchingByteTag (1,329,273 samples, 0.14%)
ns3::MakeEvent<void (444,360 samples, 0.05%)
ns3::BuildDataListElement_s::BuildDataListElement_s (2,525,517 samples, 0.26%)
ns3::Ptr<ns3::EventImpl>::~Ptr (159,762 samples, 0.02%)
__gnu_cxx::__normal_iterator<ns3::DlInfoListElement_s const*, std::vector<ns3::DlInfoListElement_s, std::allocator<ns3::DlInfoListElement_s> > >::__normal_iterator (193,090 samples, 0.02%)
void std::_Destroy<ns3::Ptr<ns3::Object>*> (209,811 samples, 0.02%)
std::vector<unsigned char, std::allocator<unsigned char> >::push_back (1,837,360 samples, 0.19%)
ns3::Ptr<ns3::EventImpl>::operator= (1,128,226 samples, 0.12%)
__gnu_cxx::__normal_iterator<double*, std::vector<double, std::allocator<double> > > std::copy<__gnu_cxx::__normal_iterator<double const*, std::vector<double, std::allocator<double> > >, __gnu_cxx::__normal_iterator<double*, std::vector<double, std::allocator<double> > > > (474,207 samples, 0.05%)
ns3::MemberLteCcmMacSapUser<ns3::NoOpComponentCarrierManager>::NotifyTxOpportunity (2,715,978 samples, 0.28%)
std::__cxx11::_List_base<ns3::Ptr<ns3::LteControlMessage>, std::allocator<ns3::Ptr<ns3::LteControlMessage> > >::~_List_base (166,752 samples, 0.02%)
std::vector<ns3::ByteTagListData*, std::allocator<ns3::ByteTagListData*> >::end (274,095 samples, 0.03%)
[ld-linux-x86-64.so.2] (155,299 samples, 0.02%)
std::_Rb_tree<unsigned short, std::pair<unsigned short const, ns3::DlInfoListElement_s>, std::_Select1st<std::pair<unsigned short const, ns3::DlInfoListElement_s> >, std::less<unsigned short>, std::allocator<std::pair<unsigned short const, ns3::DlInfoListElement_s> > >::_Auto_node::_M_insert (220,367 samples, 0.02%)
std::_Rb_tree<unsigned char, std::pair<unsigned char const, ns3::LteUeMac::LcInfo>, std::_Select1st<std::pair<unsigned char const, ns3::LteUeMac::LcInfo> >, std::less<unsigned char>, std::allocator<std::pair<unsigned char const, ns3::LteUeMac::LcInfo> > >::_S_key (545,949 samples, 0.06%)
ns3::UeMemberLteUePhySapProvider::SendMacPdu (702,652 samples, 0.07%)
std::vector<double, std::allocator<double> >::_M_default_initialize (525,076 samples, 0.05%)
(151,109 samples, 0.02%)
ns3::Ptr<ns3::MobilityModel>::Ptr (340,915 samples, 0.04%)
std::vector<ns3::Ptr<ns3::Object>, std::allocator<ns3::Ptr<ns3::Object> > >::clear (375,571 samples, 0.04%)
ns3::Ptr<ns3::EventImpl>::Ptr (255,646 samples, 0.03%)
ns3::DlInfoListElement_s::HarqStatus_e* std::__copy_move_a2<false, ns3::DlInfoListElement_s::HarqStatus_e const*, ns3::DlInfoListElement_s::HarqStatus_e*> (670,916 samples, 0.07%)
ns3::LteEnbMac::ReceiveDlCqiLteControlMessage (923,023 samples, 0.10%)
ns3::Ptr<ns3::PacketBurst>::operator= (5,294,156 samples, 0.55%)
ns3::TagBuffer::Write (162,161 samples, 0.02%)
erff32x (379,457 samples, 0.04%)
ns3::Scheduler::EventKey&& std::forward<ns3::Scheduler::EventKey> (155,928 samples, 0.02%)
ns3::Object::DoDelete (1,777,558 samples, 0.18%)
__gnu_cxx::__normal_iterator<double*, std::vector<double, std::allocator<double> > >::__normal_iterator (196,324 samples, 0.02%)
__gnu_cxx::__aligned_membuf<std::pair<unsigned short const, unsigned char> >::_M_ptr (324,216 samples, 0.03%)
std::function<void (73,736,893 samples, 7.60%) std::f..
ns3::TracedCallback<ns3::Ptr<ns3::PacketBurst const> >::operator (308,568 samples, 0.03%)
ns3::PacketMetadata::Create (1,337,353 samples, 0.14%)
ns3::Ptr<ns3::MatrixArray<std::complex<double> > const>::operator= (192,272 samples, 0.02%)
acosf32x (225,910 samples, 0.02%)
std::_Rb_tree<unsigned short, std::pair<unsigned short const, std::vector<ns3::DlDciListElement_s, std::allocator<ns3::DlDciListElement_s> > >, std::_Select1st<std::pair<unsigned short const, std::vector<ns3::DlDciListElement_s, std::allocator<ns3::DlDciListElement_s> > > >, std::less<unsigned short>, std::allocator<std::pair<unsigned short const, std::vector<ns3::DlDciListElement_s, std::allocator<ns3::DlDciListElement_s> > > > >::find (184,813 samples, 0.02%)
void std::_Rb_tree<unsigned short, std::pair<unsigned short const, ns3::DlInfoListElement_s>, std::_Select1st<std::pair<unsigned short const, ns3::DlInfoListElement_s> >, std::less<unsigned short>, std::allocator<std::pair<unsigned short const, ns3::DlInfoListElement_s> > >::_M_construct_node<std::pair<unsigned short, ns3::DlInfoListElement_s> > (882,128 samples, 0.09%)
std::_Vector_base<unsigned short, std::allocator<unsigned short> >::_Vector_impl::_Vector_impl (165,262 samples, 0.02%)
std::less<unsigned short>::operator (125,937 samples, 0.01%)
std::_Function_handler<void (22,443,594 samples, 2.31%)
std::vector<unsigned char, std::allocator<unsigned char> >::operator[] (167,625 samples, 0.02%)
ns3::Ptr<ns3::SpectrumValue>::operator= (313,424 samples, 0.03%)
std::allocator_traits<std::allocator<unsigned char> >::deallocate (194,524 samples, 0.02%)
std::vector<double, std::allocator<double> >::end (127,798 samples, 0.01%)
std::_Rb_tree<int, std::pair<int const, double>, std::_Select1st<std::pair<int const, double> >, std::less<int>, std::allocator<std::pair<int const, double> > >::_M_erase (477,626 samples, 0.05%)
std::vector<ns3::UlInfoListElement_s, std::allocator<ns3::UlInfoListElement_s> >::push_back (373,450 samples, 0.04%)
std::_Rb_tree<unsigned int, std::pair<unsigned int const, ns3::Ptr<ns3::SpectrumValue> >, std::_Select1st<std::pair<unsigned int const, ns3::Ptr<ns3::SpectrumValue> > >, std::less<unsigned int>, std::allocator<std::pair<unsigned int const, ns3::Ptr<ns3::SpectrumValue> > > >::_M_get_node (235,059 samples, 0.02%)
ns3::LteEnbPhy::GenerateCtrlCqiReport (284,425 samples, 0.03%)
ns3::Ptr<ns3::Packet> ns3::Create<ns3::Packet, unsigned int&> (2,446,167 samples, 0.25%)
std::vector<ns3::Ptr<ns3::Object>, std::allocator<ns3::Ptr<ns3::Object> > >::vector (158,991 samples, 0.02%)
ns3-dev-lena-fr (969,771,633 samples, 100.00%) ns3-dev-lena-fr
std::_Head_base<0ul, ns3::LteSpectrumPhy*, false>::_Head_base<ns3::LteSpectrumPhy*&> (197,669 samples, 0.02%)
decltype (762,055 samples, 0.08%)
ns3::PacketBurst::PacketBurst (409,656 samples, 0.04%)
std::operator+ (509,535 samples, 0.05%)
std::vector<double, std::allocator<double> >::vector (202,066 samples, 0.02%)
std::allocator<double>::deallocate (276,642 samples, 0.03%)
std::__invoke_result<void (2,105,662 samples, 0.22%)
malloc (191,680 samples, 0.02%)
std::vector<signed char, std::allocator<signed char> >::cbegin (165,764 samples, 0.02%)
ns3::IidManager::GetAttributeN (430,734 samples, 0.04%)
std::_Bind<void (237,306 samples, 0.02%)
std::vector<ns3::Ptr<ns3::Object>, std::allocator<ns3::Ptr<ns3::Object> > >::vector (659,463 samples, 0.07%)
std::_Rb_tree<unsigned short, std::pair<unsigned short const, ns3::Ptr<ns3::UeManager> >, std::_Select1st<std::pair<unsigned short const, ns3::Ptr<ns3::UeManager> > >, std::less<unsigned short>, std::allocator<std::pair<unsigned short const, ns3::Ptr<ns3::UeManager> > > >::_M_begin (151,422 samples, 0.02%)
ns3::Ptr<ns3::SpectrumValue> ns3::Create<ns3::SpectrumValue, ns3::Ptr<ns3::SpectrumModel>&> (1,879,121 samples, 0.19%)
std::__cxx11::list<ns3::UlDciLteControlMessage, std::allocator<ns3::UlDciLteControlMessage> >::back (265,587 samples, 0.03%)
ns3::PfFfMacScheduler::DoSchedUlTriggerReq (3,881,896 samples, 0.40%)
ns3::Ptr<ns3::SpectrumModel const>::operator (126,110 samples, 0.01%)
std::_Rb_tree<unsigned short, std::pair<unsigned short const, std::vector<std::vector<ns3::Ptr<ns3::PacketBurst>, std::allocator<ns3::Ptr<ns3::PacketBurst> > >, std::allocator<std::vector<ns3::Ptr<ns3::PacketBurst>, std::allocator<ns3::Ptr<ns3::PacketBurst> > > > > >, std::_Select1st<std::pair<unsigned short const, std::vector<std::vector<ns3::Ptr<ns3::PacketBurst>, std::allocator<ns3::Ptr<ns3::PacketBurst> > >, std::allocator<std::vector<ns3::Ptr<ns3::PacketBurst>, std::allocator<ns3::Ptr<ns3::PacketBurst> > > > > > >, std::less<unsigned short>, std::allocator<std::pair<unsigned short const, std::vector<std::vector<ns3::Ptr<ns3::PacketBurst>, std::allocator<ns3::Ptr<ns3::PacketBurst> > >, std::allocator<std::vector<ns3::Ptr<ns3::PacketBurst>, std::allocator<ns3::Ptr<ns3::PacketBurst> > > > > > > >::find (1,277,007 samples, 0.13%)
std::_Rb_tree_iterator<std::pair<unsigned char const, ns3::LteMacSapProvider::ReportBufferStatusParameters> >::operator (303,690 samples, 0.03%)
std::_List_iterator<ns3::Ptr<ns3::LteControlMessage> >::_List_iterator (153,672 samples, 0.02%)
std::__cxx11::list<ns3::Ptr<ns3::LteControlMessage>, std::allocator<ns3::Ptr<ns3::LteControlMessage> > >::list (148,291 samples, 0.02%)
std::vector<ns3::UlInfoListElement_s, std::allocator<ns3::UlInfoListElement_s> >::_M_erase_at_end (312,181 samples, 0.03%)
void std::_Construct<double> (155,953 samples, 0.02%)
std::_Vector_base<ns3::VendorSpecificListElement_s, std::allocator<ns3::VendorSpecificListElement_s> >::_M_allocate (152,912 samples, 0.02%)
std::_Rb_tree<ns3::LteSpectrumModelId, std::pair<ns3::LteSpectrumModelId const, ns3::Ptr<ns3::SpectrumModel> >, std::_Select1st<std::pair<ns3::LteSpectrumModelId const, ns3::Ptr<ns3::SpectrumModel> > >, std::less<ns3::LteSpectrumModelId>, std::allocator<std::pair<ns3::LteSpectrumModelId const, ns3::Ptr<ns3::SpectrumModel> > > >::_M_begin (159,151 samples, 0.02%)
ns3::LteUePhy::DoSendLteControlMessage (416,875 samples, 0.04%)
ns3::Packet::~Packet (4,222,593 samples, 0.44%)
ns3::EventId::EventId (335,084 samples, 0.03%)
std::_Bvector_base<std::allocator<bool> >::_Bvector_impl::_M_end_addr (154,284 samples, 0.02%)
std::allocator_traits<std::allocator<unsigned long> >::allocate (271,783 samples, 0.03%)
std::less<unsigned short>::operator (224,387 samples, 0.02%)
std::vector<std::vector<int, std::allocator<int> >, std::allocator<std::vector<int, std::allocator<int> > > >::_M_range_check (265,329 samples, 0.03%)
std::vector<unsigned short, std::allocator<unsigned short> >::resize (3,219,505 samples, 0.33%)
std::allocator_traits<std::allocator<double> >::allocate (126,483 samples, 0.01%)
std::_List_node<ns3::Ptr<ns3::LteControlMessage> >* std::__cxx11::list<ns3::Ptr<ns3::LteControlMessage>, std::allocator<ns3::Ptr<ns3::LteControlMessage> > >::_M_create_node<ns3::Ptr<ns3::LteControlMessage> const&> (413,599 samples, 0.04%)
void std::__cxx11::list<ns3::Ptr<ns3::LteControlMessage>, std::allocator<ns3::Ptr<ns3::LteControlMessage> > >::_M_assign_dispatch<std::_List_const_iterator<ns3::Ptr<ns3::LteControlMessage> > > (411,083 samples, 0.04%)
std::_Vector_base<ns3::HigherLayerSelected_s, std::allocator<ns3::HigherLayerSelected_s> >::_Vector_base (199,135 samples, 0.02%)
std::_List_iterator<ns3::Ptr<ns3::LteChunkProcessor> >::operator++ (161,286 samples, 0.02%)
std::vector<std::__cxx11::list<ns3::UlDciLteControlMessage, std::allocator<ns3::UlDciLteControlMessage> >, std::allocator<std::__cxx11::list<ns3::UlDciLteControlMessage, std::allocator<ns3::UlDciLteControlMessage> > > >::push_back (202,678 samples, 0.02%)
std::vector<std::vector<ns3::RlcPduListElement_s, std::allocator<ns3::RlcPduListElement_s> >, std::allocator<std::vector<ns3::RlcPduListElement_s, std::allocator<ns3::RlcPduListElement_s> > > >::size (188,805 samples, 0.02%)
std::vector<double, std::allocator<double> >::operator= (821,681 samples, 0.08%)
std::__detail::_List_node_header::_List_node_header (148,982 samples, 0.02%)
operator new (487,893 samples, 0.05%)
std::_Rb_tree<unsigned short, std::pair<unsigned short const, std::vector<double, std::allocator<double> > >, std::_Select1st<std::pair<unsigned short const, std::vector<double, std::allocator<double> > > >, std::less<unsigned short>, std::allocator<std::pair<unsigned short const, std::vector<double, std::allocator<double> > > > >::_M_destroy_node (198,551 samples, 0.02%)
ns3::ObjectBase::ObjectBase (412,873 samples, 0.04%)
double* std::fill_n<double*, unsigned long, double> (248,267 samples, 0.03%)
ns3::IidManager::LookupInformation (308,302 samples, 0.03%)
std::allocator_traits<std::allocator<double> >::allocate (156,472 samples, 0.02%)
std::_Rb_tree<ns3::Scheduler::EventKey, std::pair<ns3::Scheduler::EventKey const, ns3::EventImpl*>, std::_Select1st<std::pair<ns3::Scheduler::EventKey const, ns3::EventImpl*> >, std::less<ns3::Scheduler::EventKey>, std::allocator<std::pair<ns3::Scheduler::EventKey const, ns3::EventImpl*> > >::end (714,185 samples, 0.07%)
std::__cxx11::_List_base<ns3::Ptr<ns3::Packet>, std::allocator<ns3::Ptr<ns3::Packet> > >::_M_get_node (272,817 samples, 0.03%)
void std::_Construct<ns3::BuildDataListElement_s, ns3::BuildDataListElement_s const&> (154,123 samples, 0.02%)
ns3::SimpleRefCount<ns3::Packet, ns3::Empty, ns3::DefaultDeleter<ns3::Packet> >::SimpleRefCount (194,468 samples, 0.02%)
__fixunsxfti (459,077 samples, 0.05%)
std::_Bind<void (196,912 samples, 0.02%)
double* std::__uninitialized_default_n<double*, unsigned long> (1,351,343 samples, 0.14%)
void ns3::Simulator::ScheduleWithContext<void (696,602 samples, 0.07%)
std::vector<unsigned short, std::allocator<unsigned short> >::at (274,992 samples, 0.03%)
std::_List_iterator<ns3::Ptr<ns3::LteControlMessage> >::operator* (197,417 samples, 0.02%)
ns3::PacketBurst::AddPacket (193,356 samples, 0.02%)
ns3::HigherLayerSelected_s::HigherLayerSelected_s (333,368 samples, 0.03%)
std::_Rb_tree_iterator<std::pair<unsigned short const, std::vector<std::vector<ns3::Ptr<ns3::PacketBurst>, std::allocator<ns3::Ptr<ns3::PacketBurst> > >, std::allocator<std::vector<ns3::Ptr<ns3::PacketBurst>, std::allocator<ns3::Ptr<ns3::PacketBurst> > > > > > >::operator* (234,968 samples, 0.02%)
std::_Rb_tree<unsigned short, std::pair<unsigned short const, std::map<unsigned char, ns3::LteMacSapUser*, std::less<unsigned char>, std::allocator<std::pair<unsigned char const, ns3::LteMacSapUser*> > > >, std::_Select1st<std::pair<unsigned short const, std::map<unsigned char, ns3::LteMacSapUser*, std::less<unsigned char>, std::allocator<std::pair<unsigned char const, ns3::LteMacSapUser*> > > > >, std::less<unsigned short>, std::allocator<std::pair<unsigned short const, std::map<unsigned char, ns3::LteMacSapUser*, std::less<unsigned char>, std::allocator<std::pair<unsigned char const, ns3::LteMacSapUser*> > > > > >::find (1,823,746 samples, 0.19%)
ns3::ByteTagList::~ByteTagList (239,815 samples, 0.02%)
ns3::Time::To (417,636 samples, 0.04%)
ns3::Packet::PeekPacketTag (2,187,603 samples, 0.23%)
ns3::Ptr<ns3::SpectrumModel const>::Acquire (235,730 samples, 0.02%)
std::map<unsigned char, ns3::LteMacSapProvider*, std::less<unsigned char>, std::allocator<std::pair<unsigned char const, ns3::LteMacSapProvider*> > >::find (1,809,407 samples, 0.19%)
std::_Rb_tree_node<std::pair<unsigned int const, ns3::Ptr<ns3::SpectrumValue> > >* std::_Rb_tree<unsigned int, std::pair<unsigned int const, ns3::Ptr<ns3::SpectrumValue> >, std::_Select1st<std::pair<unsigned int const, ns3::Ptr<ns3::SpectrumValue> > >, std::less<unsigned int>, std::allocator<std::pair<unsigned int const, ns3::Ptr<ns3::SpectrumValue> > > >::_M_create_node<unsigned int const&, ns3::Ptr<ns3::SpectrumValue>&> (420,658 samples, 0.04%)
ns3::LteSpectrumPhy::StartTxDataFrame (35,782,100 samples, 3.69%) ns..
ns3::LogComponent::IsEnabled (153,177 samples, 0.02%)
ns3::LteSpectrumValueHelper::CreateTxPowerSpectralDensity (7,568,442 samples, 0.78%)
ns3::LteRlcSm::ReportBufferStatus (1,019,985 samples, 0.11%)
ns3::EnbMemberLteEnbPhySapProvider::SendLteControlMessage (197,391 samples, 0.02%)
__gnu_cxx::__normal_iterator<std::__cxx11::list<ns3::Ptr<ns3::LteControlMessage>, std::allocator<ns3::Ptr<ns3::LteControlMessage> > >*, std::vector<std::__cxx11::list<ns3::Ptr<ns3::LteControlMessage>, std::allocator<ns3::Ptr<ns3::LteControlMessage> > >, std::allocator<std::__cxx11::list<ns3::Ptr<ns3::LteControlMessage>, std::allocator<ns3::Ptr<ns3::LteControlMessage> > > > > > std::move<__gnu_cxx::__normal_iterator<std::__cxx11::list<ns3::Ptr<ns3::LteControlMessage>, std::allocator<ns3::Ptr<ns3::LteControlMessage> > >*, std::vector<std::__cxx11::list<ns3::Ptr<ns3::LteControlMessage>, std::allocator<ns3::Ptr<ns3::LteControlMessage> > >, std::allocator<std::__cxx11::list<ns3::Ptr<ns3::LteControlMessage>, std::allocator<ns3::Ptr<ns3::LteControlMessage> > > > > >, __gnu_cxx::__normal_iterator<std::__cxx11::list<ns3::Ptr<ns3::LteControlMessage>, std::allocator<ns3::Ptr<ns3::LteControlMessage> > >*, std::vector<std::__cxx11::list<ns3::Ptr<ns3::LteControlMessage>, std::allocator<ns3::Ptr<ns3::LteControlMessage> > >, std::allocator<std::__cxx11::list<ns3::Ptr<ns3::LteControlMessage>, std::allocator<ns3::Ptr<ns3::LteControlMessage> > > > > > > (264,157 samples, 0.03%)
ns3::MacCeListElement_s::MacCeListElement_s (1,017,736 samples, 0.10%)
std::__cxx11::_List_base<ns3::Ptr<ns3::Packet>, std::allocator<ns3::Ptr<ns3::Packet> > >::_M_get_node (491,620 samples, 0.05%)
ns3::ByteTagList::Deallocate (244,736 samples, 0.03%)
std::vector<ns3::HigherLayerSelected_s, std::allocator<ns3::HigherLayerSelected_s> >::_S_relocate (1,209,596 samples, 0.12%)
std::_Rb_tree<unsigned short, unsigned short, std::_Identity<unsigned short>, std::less<unsigned short>, std::allocator<unsigned short> >::_M_begin (261,904 samples, 0.03%)
ns3::HigherLayerSelected_s::HigherLayerSelected_s (418,936 samples, 0.04%)
ns3::MobilityModel::GetDistanceFrom (1,223,688 samples, 0.13%)
ns3::BuildBroadcastListElement_s* std::__uninitialized_copy_a<__gnu_cxx::__normal_iterator<ns3::BuildBroadcastListElement_s const*, std::vector<ns3::BuildBroadcastListElement_s, std::allocator<ns3::BuildBroadcastListElement_s> > >, ns3::BuildBroadcastListElement_s*, ns3::BuildBroadcastListElement_s> (150,405 samples, 0.02%)
std::enable_if<is_member_pointer_v<void (379,721 samples, 0.04%)
std::function<void (5,321,712 samples, 0.55%)
std::_Vector_base<ns3::DlInfoListElement_s, std::allocator<ns3::DlInfoListElement_s> >::_M_get_Tp_allocator (160,864 samples, 0.02%)
__gnu_cxx::__normal_iterator<unsigned short*, std::vector<unsigned short, std::allocator<unsigned short> > >::difference_type __gnu_cxx::operator-<unsigned short*, std::vector<unsigned short, std::allocator<unsigned short> > > (158,533 samples, 0.02%)
std::map<unsigned short, unsigned int, std::less<unsigned short>, std::allocator<std::pair<unsigned short const, unsigned int> > >::find (178,285 samples, 0.02%)
unsigned char* std::__uninitialized_copy<true>::__uninit_copy<__gnu_cxx::__normal_iterator<unsigned char const*, std::vector<unsigned char, std::allocator<unsigned char> > >, unsigned char*> (592,631 samples, 0.06%)
void std::_Destroy<ns3::UlInfoListElement_s*> (228,697 samples, 0.02%)
operator new (629,966 samples, 0.06%)
std::tuple<ns3::MultiModelSpectrumChannel*, ns3::Ptr<ns3::SpectrumValue>, double, ns3::Ptr<ns3::SpectrumSignalParameters>, ns3::Ptr<ns3::SpectrumPhy>, std::map<unsigned int, ns3::Ptr<ns3::SpectrumValue>, std::less<unsigned int>, std::allocator<std::pair<unsigned int const, ns3::Ptr<ns3::SpectrumValue> > > > >::tuple (495,402 samples, 0.05%)
std::vector<unsigned char, std::allocator<unsigned char> >::~vector (445,109 samples, 0.05%)
ns3::MacCeListElement_s* std::__uninitialized_copy_a<std::move_iterator<ns3::MacCeListElement_s*>, ns3::MacCeListElement_s*, ns3::MacCeListElement_s> (462,292 samples, 0.05%)
ns3::ByteTagList::Iterator::Next (984,877 samples, 0.10%)
std::_Vector_base<ns3::Ptr<ns3::Object>, std::allocator<ns3::Ptr<ns3::Object> > >::~_Vector_base (152,155 samples, 0.02%)
std::_Rb_tree<unsigned short, std::pair<unsigned short const, std::vector<std::vector<ns3::HarqProcessInfoElement_t, std::allocator<ns3::HarqProcessInfoElement_t> >, std::allocator<std::vector<ns3::HarqProcessInfoElement_t, std::allocator<ns3::HarqProcessInfoElement_t> > > > >, std::_Select1st<std::pair<unsigned short const, std::vector<std::vector<ns3::HarqProcessInfoElement_t, std::allocator<ns3::HarqProcessInfoElement_t> >, std::allocator<std::vector<ns3::HarqProcessInfoElement_t, std::allocator<ns3::HarqProcessInfoElement_t> > > > > >, std::less<unsigned short>, std::allocator<std::pair<unsigned short const, std::vector<std::vector<ns3::HarqProcessInfoElement_t, std::allocator<ns3::HarqProcessInfoElement_t> >, std::allocator<std::vector<ns3::HarqProcessInfoElement_t, std::allocator<ns3::HarqProcessInfoElement_t> > > > > > >::begin (303,510 samples, 0.03%)
bool __gnu_cxx::operator==<ns3::Buffer::Data* const*, std::vector<ns3::Buffer::Data*, std::allocator<ns3::Buffer::Data*> > > (150,431 samples, 0.02%)
std::_Vector_base<ns3::VendorSpecificListElement_s, std::allocator<ns3::VendorSpecificListElement_s> >::_Vector_impl_data::_Vector_impl_data (146,682 samples, 0.02%)
std::vector<ns3::Ptr<ns3::PacketBurst>, std::allocator<ns3::Ptr<ns3::PacketBurst> > >::begin (155,092 samples, 0.02%)
double* std::__uninitialized_default_n_a<double*, unsigned long, double> (1,306,729 samples, 0.13%)
ns3::SpectrumValue::SpectrumValue (1,521,016 samples, 0.16%)
std::__cxx11::list<ns3::Ptr<ns3::LteControlMessage>, std::allocator<ns3::Ptr<ns3::LteControlMessage> > >::operator= (211,914 samples, 0.02%)
ns3::LogComponent::IsEnabled (154,612 samples, 0.02%)
std::__cxx11::_List_base<ns3::UlDciLteControlMessage, std::allocator<ns3::UlDciLteControlMessage> >::_M_move_nodes (377,447 samples, 0.04%)
ns3::Time::FromDouble (1,884,228 samples, 0.19%)
std::map<unsigned short, std::vector<unsigned char, std::allocator<unsigned char> >, std::less<unsigned short>, std::allocator<std::pair<unsigned short const, std::vector<unsigned char, std::allocator<unsigned char> > > > >::find (1,373,897 samples, 0.14%)
std::tuple<ns3::LteInterference*, ns3::Ptr<ns3::SpectrumValue const>, unsigned int>::tuple (1,080,236 samples, 0.11%)
ns3::FfMacSchedSapProvider::SchedUlMacCtrlInfoReqParameters::SchedUlMacCtrlInfoReqParameters (182,245 samples, 0.02%)
std::_Vector_base<ns3::DlInfoListElement_s::HarqStatus_e, std::allocator<ns3::DlInfoListElement_s::HarqStatus_e> >::_M_allocate (264,699 samples, 0.03%)
ns3::LteMiErrorModel::MappingMiBler (872,634 samples, 0.09%)
ns3::LteRlcSm::ReportBufferStatus (747,299 samples, 0.08%)
std::vector<unsigned char, std::allocator<unsigned char> >::vector (189,712 samples, 0.02%)
std::function<void (937,122 samples, 0.10%)
std::__cxx11::_List_base<ns3::RarLteControlMessage::Rar, std::allocator<ns3::RarLteControlMessage::Rar> >::~_List_base (234,533 samples, 0.02%)
ns3::tbInfo_t::tbInfo_t (126,859 samples, 0.01%)
ns3::Packet::Packet (358,332 samples, 0.04%)
ns3::LteEnbMac::DoSubframeIndication (1,650,854 samples, 0.17%)
std::vector<double, std::allocator<double> >::~vector (189,290 samples, 0.02%)
std::modf (284,529 samples, 0.03%)
(124,598 samples, 0.01%)
ns3::EnbMacMemberLteEnbPhySapUser::SubframeIndication (178,646,468 samples, 18.42%) ns3::EnbMacMemberL..
__gnu_cxx::__normal_iterator<std::vector<ns3::HarqProcessInfoElement_t, std::allocator<ns3::HarqProcessInfoElement_t> >*, std::vector<std::vector<ns3::HarqProcessInfoElement_t, std::allocator<ns3::HarqProcessInfoElement_t> >, std::allocator<std::vector<ns3::HarqProcessInfoElement_t, std::allocator<ns3::HarqProcessInfoElement_t> > > > > std::__copy_move_a<true, __gnu_cxx::__normal_iterator<std::vector<ns3::HarqProcessInfoElement_t, std::allocator<ns3::HarqProcessInfoElement_t> >*, std::vector<std::vector<ns3::HarqProcessInfoElement_t, std::allocator<ns3::HarqProcessInfoElement_t> >, std::allocator<std::vector<ns3::HarqProcessInfoElement_t, std::allocator<ns3::HarqProcessInfoElement_t> > > > >, __gnu_cxx::__normal_iterator<std::vector<ns3::HarqProcessInfoElement_t, std::allocator<ns3::HarqProcessInfoElement_t> >*, std::vector<std::vector<ns3::HarqProcessInfoElement_t, std::allocator<ns3::HarqProcessInfoElement_t> >, std::allocator<std::vector<ns3::HarqProcessInfoElement_t, std::allocator<ns3::HarqProcessInfoElement_t> > > > > > (148,381 samples, 0.02%)
ns3::PacketBurst::DoDispose (1,132,243 samples, 0.12%)
void std::_Destroy_aux<false>::__destroy<ns3::CqiListElement_s*> (143,980 samples, 0.01%)
std::enable_if<is_invocable_r_v<void, std::_Bind<void (2,105,662 samples, 0.22%)
ns3::TagBuffer::TrimAtEnd (161,048 samples, 0.02%)
std::_Rb_tree<unsigned int, std::pair<unsigned int const, ns3::RxSpectrumModelInfo>, std::_Select1st<std::pair<unsigned int const, ns3::RxSpectrumModelInfo> >, std::less<unsigned int>, std::allocator<std::pair<unsigned int const, ns3::RxSpectrumModelInfo> > >::end (128,201 samples, 0.01%)
ns3::Vector3D::Vector3D (192,806 samples, 0.02%)
std::__cxx11::list<ns3::Ptr<ns3::Packet>, std::allocator<ns3::Ptr<ns3::Packet> > >::clear (224,512 samples, 0.02%)
ns3::DlInfoListElement_s::~DlInfoListElement_s (1,109,198 samples, 0.11%)
__gnu_cxx::__normal_iterator<std::__cxx11::list<ns3::UlDciLteControlMessage, std::allocator<ns3::UlDciLteControlMessage> >*, std::vector<std::__cxx11::list<ns3::UlDciLteControlMessage, std::allocator<ns3::UlDciLteControlMessage> >, std::allocator<std::__cxx11::list<ns3::UlDciLteControlMessage, std::allocator<ns3::UlDciLteControlMessage> > > > > std::move<__gnu_cxx::__normal_iterator<std::__cxx11::list<ns3::UlDciLteControlMessage, std::allocator<ns3::UlDciLteControlMessage> >*, std::vector<std::__cxx11::list<ns3::UlDciLteControlMessage, std::allocator<ns3::UlDciLteControlMessage> >, std::allocator<std::__cxx11::list<ns3::UlDciLteControlMessage, std::allocator<ns3::UlDciLteControlMessage> > > > >, __gnu_cxx::__normal_iterator<std::__cxx11::list<ns3::UlDciLteControlMessage, std::allocator<ns3::UlDciLteControlMessage> >*, std::vector<std::__cxx11::list<ns3::UlDciLteControlMessage, std::allocator<ns3::UlDciLteControlMessage> >, std::allocator<std::__cxx11::list<ns3::UlDciLteControlMessage, std::allocator<ns3::UlDciLteControlMessage> > > > > > (1,862,892 samples, 0.19%)
std::allocator_traits<std::allocator<double> >::allocate (150,187 samples, 0.02%)
ns3::PfFfMacScheduler::GetRbgSize (153,442 samples, 0.02%)
unsigned short* std::fill_n<unsigned short*, unsigned long, unsigned short> (700,494 samples, 0.07%)
std::vector<ns3::IidManager::IidInformation, std::allocator<ns3::IidManager::IidInformation> >::size (188,549 samples, 0.02%)
std::__cxx11::_List_base<ns3::Ptr<ns3::LteControlMessage>, std::allocator<ns3::Ptr<ns3::LteControlMessage> > >::_List_base (459,736 samples, 0.05%)
ns3::TypeId::operator= (127,390 samples, 0.01%)
std::map<ns3::LteFlowId_t, ns3::FfMacSchedSapProvider::SchedDlRlcBufferReqParameters, std::less<ns3::LteFlowId_t>, std::allocator<std::pair<ns3::LteFlowId_t const, ns3::FfMacSchedSapProvider::SchedDlRlcBufferReqParameters> > >::find (1,508,586 samples, 0.16%)
std::__cxx11::list<ns3::Ptr<ns3::LteControlMessage>, std::allocator<ns3::Ptr<ns3::LteControlMessage> > >::list (1,664,663 samples, 0.17%)
operator new (158,241 samples, 0.02%)
operator new (429,586 samples, 0.04%)
ns3::Ptr<ns3::SpectrumPhy const>::Ptr<ns3::SpectrumPhy> (154,425 samples, 0.02%)
ns3::Ptr<ns3::Node>::Ptr (417,289 samples, 0.04%)
std::vector<ns3::UlInfoListElement_s, std::allocator<ns3::UlInfoListElement_s> >::operator= (153,511 samples, 0.02%)
ns3::LteEnbPhy::GetDownlinkSubChannels (240,017 samples, 0.02%)
ns3::Ptr<ns3::SpectrumSignalParameters>::~Ptr (2,493,989 samples, 0.26%)
std::vector<double, std::allocator<double> >::_S_check_init_len (126,790 samples, 0.01%)
ns3::MemberSchedSapProvider<ns3::PfFfMacScheduler>::SchedDlTriggerReq (2,983,151 samples, 0.31%)
__gnu_cxx::__normal_iterator<double*, std::vector<double, std::allocator<double> > > std::__copy_move_a<false, __gnu_cxx::__normal_iterator<double const*, std::vector<double, std::allocator<double> > >, __gnu_cxx::__normal_iterator<double*, std::vector<double, std::allocator<double> > > > (160,870 samples, 0.02%)
std::_Vector_base<int, std::allocator<int> >::_Vector_impl_data::_Vector_impl_data (138,078 samples, 0.01%)
ns3::Ptr<ns3::MobilityModel>::~Ptr (160,100 samples, 0.02%)
ns3::ObjectDeleter::Delete (158,753 samples, 0.02%)
ns3::TracedCallback<ns3::PhyReceptionStatParameters>::operator (278,616 samples, 0.03%)
std::enable_if<std::is_constructible<std::pair<ns3::Scheduler::EventKey const, ns3::EventImpl*>, std::pair<ns3::Scheduler::EventKey, ns3::EventImpl*> >::value, std::pair<std::_Rb_tree_iterator<std::pair<ns3::Scheduler::EventKey const, ns3::EventImpl*> >, bool> >::type std::map<ns3::Scheduler::EventKey, ns3::EventImpl*, std::less<ns3::Scheduler::EventKey>, std::allocator<std::pair<ns3::Scheduler::EventKey const, ns3::EventImpl*> > >::insert<std::pair<ns3::Scheduler::EventKey, ns3::EventImpl*> > (1,644,033 samples, 0.17%)
std::map<unsigned char, ns3::LteMacSapProvider::ReportBufferStatusParameters, std::less<unsigned char>, std::allocator<std::pair<unsigned char const, ns3::LteMacSapProvider::ReportBufferStatusParameters> > >::begin (422,977 samples, 0.04%)
std::_Rb_tree_node<std::pair<unsigned short const, std::vector<unsigned char, std::allocator<unsigned char> > > >::_M_valptr (242,288 samples, 0.02%)
ns3::Ptr<ns3::SpectrumValue>::operator* (163,458 samples, 0.02%)
std::_Vector_base<unsigned short, std::allocator<unsigned short> >::_Vector_base (192,396 samples, 0.02%)
std::__cxx11::list<ns3::Callback<void, unsigned short, unsigned char, unsigned int>, std::allocator<ns3::Callback<void, unsigned short, unsigned char, unsigned int> > >::begin (281,211 samples, 0.03%)
std::map<unsigned int, ns3::Ptr<ns3::SpectrumValue>, std::less<unsigned int>, std::allocator<std::pair<unsigned int const, ns3::Ptr<ns3::SpectrumValue> > > >::at (263,150 samples, 0.03%)
std::_Tuple_impl<1ul, ns3::Ptr<ns3::PacketBurst> >::_Tuple_impl (360,730 samples, 0.04%)
std::_Rb_tree_iterator<std::pair<ns3::Scheduler::EventKey const, ns3::EventImpl*> >::_Rb_tree_iterator (202,210 samples, 0.02%)
__gnu_cxx::__normal_iterator<ns3::Ptr<ns3::PacketBurst>*, std::vector<ns3::Ptr<ns3::PacketBurst>, std::allocator<ns3::Ptr<ns3::PacketBurst> > > > std::move<__gnu_cxx::__normal_iterator<ns3::Ptr<ns3::PacketBurst>*, std::vector<ns3::Ptr<ns3::PacketBurst>, std::allocator<ns3::Ptr<ns3::PacketBurst> > > >, __gnu_cxx::__normal_iterator<ns3::Ptr<ns3::PacketBurst>*, std::vector<ns3::Ptr<ns3::PacketBurst>, std::allocator<ns3::Ptr<ns3::PacketBurst> > > > > (536,978 samples, 0.06%)
std::_Rb_tree_node<std::pair<unsigned short const, std::vector<std::vector<ns3::Ptr<ns3::PacketBurst>, std::allocator<ns3::Ptr<ns3::PacketBurst> > >, std::allocator<std::vector<ns3::Ptr<ns3::PacketBurst>, std::allocator<ns3::Ptr<ns3::PacketBurst> > > > > > >::_M_valptr (232,843 samples, 0.02%)
std::__cxx11::list<ns3::Ptr<ns3::LteControlMessage>, std::allocator<ns3::Ptr<ns3::LteControlMessage> > >::list<std::_List_const_iterator<ns3::Ptr<ns3::LteControlMessage> >, void> (1,560,416 samples, 0.16%)
ns3::MultiModelSpectrumChannel::StartRx (60,346,707 samples, 6.22%) ns3:..
std::_Bit_iterator_base::_M_incr (153,737 samples, 0.02%)
unsigned int& std::__get_helper<1ul, unsigned int, unsigned int> (270,195 samples, 0.03%)
ns3::SbMeasResult_s::SbMeasResult_s (1,067,175 samples, 0.11%)
std::vector<ns3::DlInfoListElement_s::HarqStatus_e, std::allocator<ns3::DlInfoListElement_s::HarqStatus_e> >::_M_range_check (195,616 samples, 0.02%)
std::vector<ns3::HigherLayerSelected_s, std::allocator<ns3::HigherLayerSelected_s> >::operator= (190,707 samples, 0.02%)
ns3::LteSpectrumPhy::StartTxUlSrsFrame (887,136 samples, 0.09%)
ns3::PfFfMacScheduler::DoSchedDlTriggerReq (1,650,854 samples, 0.17%)
ns3::PacketTagList::COWTraverse (191,197 samples, 0.02%)
std::_Vector_base<unsigned char, std::allocator<unsigned char> >::~_Vector_base (204,384 samples, 0.02%)
std::tuple<ns3::LteEnbPhy*>::tuple<ns3::LteEnbPhy*&, true, true> (191,013 samples, 0.02%)
ns3::Time::ToInteger (236,828 samples, 0.02%)
ns3::PacketBurst::PacketBurst (381,561 samples, 0.04%)
double* std::uninitialized_copy<__gnu_cxx::__normal_iterator<double const*, std::vector<double, std::allocator<double> > >, double*> (1,019,777 samples, 0.11%)
std::vector<ns3::UlInfoListElement_s, std::allocator<ns3::UlInfoListElement_s> >::vector (366,390 samples, 0.04%)
ns3::Callback<void, ns3::SpectrumValue const&>::Callback<void (282,374 samples, 0.03%)
std::allocator<std::_List_node<ns3::Ptr<ns3::Packet> > >::allocate (380,371 samples, 0.04%)
__gnu_cxx::__normal_iterator<unsigned char*, std::vector<unsigned char, std::allocator<unsigned char> > > std::__copy_move_a<false, __gnu_cxx::__normal_iterator<unsigned char const*, std::vector<unsigned char, std::allocator<unsigned char> > >, __gnu_cxx::__normal_iterator<unsigned char*, std::vector<unsigned char, std::allocator<unsigned char> > > > (125,103 samples, 0.01%)
std::map<unsigned int, ns3::RxSpectrumModelInfo, std::less<unsigned int>, std::allocator<std::pair<unsigned int const, ns3::RxSpectrumModelInfo> > >::end (128,149 samples, 0.01%)
std::_Function_base::_Base_manager<void (823,342 samples, 0.08%)
pow (356,086 samples, 0.04%)
decltype (688,656 samples, 0.07%)
std::vector<std::__cxx11::list<ns3::Ptr<ns3::LteControlMessage>, std::allocator<ns3::Ptr<ns3::LteControlMessage> > >, std::allocator<std::__cxx11::list<ns3::Ptr<ns3::LteControlMessage>, std::allocator<ns3::Ptr<ns3::LteControlMessage> > > > >::push_back (445,330 samples, 0.05%)
ns3::Ptr<ns3::EventImpl>::Ptr (787,839 samples, 0.08%)
bool __gnu_cxx::operator==<ns3::HarqProcessInfoElement_t const*, std::vector<ns3::HarqProcessInfoElement_t, std::allocator<ns3::HarqProcessInfoElement_t> > > (159,664 samples, 0.02%)
std::_Rb_tree<unsigned short, std::pair<unsigned short const, std::vector<std::vector<ns3::Ptr<ns3::PacketBurst>, std::allocator<ns3::Ptr<ns3::PacketBurst> > >, std::allocator<std::vector<ns3::Ptr<ns3::PacketBurst>, std::allocator<ns3::Ptr<ns3::PacketBurst> > > > > >, std::_Select1st<std::pair<unsigned short const, std::vector<std::vector<ns3::Ptr<ns3::PacketBurst>, std::allocator<ns3::Ptr<ns3::PacketBurst> > >, std::allocator<std::vector<ns3::Ptr<ns3::PacketBurst>, std::allocator<ns3::Ptr<ns3::PacketBurst> > > > > > >, std::less<unsigned short>, std::allocator<std::pair<unsigned short const, std::vector<std::vector<ns3::Ptr<ns3::PacketBurst>, std::allocator<ns3::Ptr<ns3::PacketBurst> > >, std::allocator<std::vector<ns3::Ptr<ns3::PacketBurst>, std::allocator<ns3::Ptr<ns3::PacketBurst> > > > > > > >::_M_lower_bound (816,432 samples, 0.08%)
std::vector<unsigned char, std::allocator<unsigned char> >::vector (533,840 samples, 0.06%)
std::remove_reference<double&>::type&& std::move<double&> (160,528 samples, 0.02%)
std::_Vector_base<unsigned int, std::allocator<unsigned int> >::~_Vector_base (574,638 samples, 0.06%)
ns3::DefaultDeleter<ns3::SpectrumValue>::Delete (190,332 samples, 0.02%)
std::vector<bool, std::allocator<bool> >::operator[] (162,486 samples, 0.02%)
ns3::PacketBurst::GetSize (1,573,815 samples, 0.16%)
void std::_Rb_tree<unsigned short, std::pair<unsigned short const, std::vector<unsigned short, std::allocator<unsigned short> > >, std::_Select1st<std::pair<unsigned short const, std::vector<unsigned short, std::allocator<unsigned short> > > >, std::less<unsigned short>, std::allocator<std::pair<unsigned short const, std::vector<unsigned short, std::allocator<unsigned short> > > > >::_M_construct_node<std::piecewise_construct_t const&, std::tuple<unsigned short const&>, std::tuple<> > (803,124 samples, 0.08%)
double* std::__uninitialized_default_n_a<double*, unsigned long, double> (1,391,465 samples, 0.14%)
std::allocator_traits<std::allocator<std::_Rb_tree_node<std::pair<unsigned int const, ns3::Ptr<ns3::SpectrumValue> > > > >::deallocate (164,554 samples, 0.02%)
ns3::LteEnbPhy*& std::forward<ns3::LteEnbPhy*&> (184,660 samples, 0.02%)
ns3::MakeEvent<void (682,798 samples, 0.07%)
void (163,364 samples, 0.02%)
ns3::Object::Object (314,930 samples, 0.03%)
std::_Rb_tree<unsigned short, std::pair<unsigned short const, std::vector<unsigned short, std::allocator<unsigned short> > >, std::_Select1st<std::pair<unsigned short const, std::vector<unsigned short, std::allocator<unsigned short> > > >, std::less<unsigned short>, std::allocator<std::pair<unsigned short const, std::vector<unsigned short, std::allocator<unsigned short> > > > >::_M_get_Node_allocator (152,998 samples, 0.02%)
ns3::HarqProcessInfoElement_t* std::__copy_move_a1<false, ns3::HarqProcessInfoElement_t const*, ns3::HarqProcessInfoElement_t*> (437,467 samples, 0.05%)
ns3::Ptr<ns3::NetDevice>::Ptr (273,026 samples, 0.03%)
void std::destroy_at<ns3::Ptr<ns3::Packet> > (1,143,303 samples, 0.12%)
std::__cxx11::list<ns3::Ptr<ns3::LteControlMessage>, std::allocator<ns3::Ptr<ns3::LteControlMessage> > >::splice (371,326 samples, 0.04%)
std::vector<ns3::HigherLayerSelected_s, std::allocator<ns3::HigherLayerSelected_s> >::~vector (154,796 samples, 0.02%)
ns3::LteInterference::ConditionallyEvaluateChunk (447,530 samples, 0.05%)
ns3::SimpleRefCount<ns3::Object, ns3::ObjectBase, ns3::ObjectDeleter>::~SimpleRefCount (225,570 samples, 0.02%)
ns3::RlcTag::GetTypeId (274,825 samples, 0.03%)
ns3::SimpleRefCount<ns3::SpectrumValue, ns3::Empty, ns3::DefaultDeleter<ns3::SpectrumValue> >::SimpleRefCount (199,860 samples, 0.02%)
std::_Rb_tree_node<std::pair<ns3::Scheduler::EventKey const, ns3::EventImpl*> >* std::_Rb_tree<ns3::Scheduler::EventKey, std::pair<ns3::Scheduler::EventKey const, ns3::EventImpl*>, std::_Select1st<std::pair<ns3::Scheduler::EventKey const, ns3::EventImpl*> >, std::less<ns3::Scheduler::EventKey>, std::allocator<std::pair<ns3::Scheduler::EventKey const, ns3::EventImpl*> > >::_M_create_node<std::pair<ns3::Scheduler::EventKey, ns3::EventImpl*> > (1,347,530 samples, 0.14%)
ns3::HigherLayerSelected_s* std::__do_uninit_copy<__gnu_cxx::__normal_iterator<ns3::HigherLayerSelected_s const*, std::vector<ns3::HigherLayerSelected_s, std::allocator<ns3::HigherLayerSelected_s> > >, ns3::HigherLayerSelected_s*> (151,182 samples, 0.02%)
ns3::Ptr<ns3::LteControlMessage>& std::__cxx11::list<ns3::Ptr<ns3::LteControlMessage>, std::allocator<ns3::Ptr<ns3::LteControlMessage> > >::emplace_back<ns3::Ptr<ns3::LteControlMessage> const&> (912,598 samples, 0.09%)
std::_Rb_tree<unsigned int, std::pair<unsigned int const, ns3::TxSpectrumModelInfo>, std::_Select1st<std::pair<unsigned int const, ns3::TxSpectrumModelInfo> >, std::less<unsigned int>, std::allocator<std::pair<unsigned int const, ns3::TxSpectrumModelInfo> > >::_M_lower_bound (188,402 samples, 0.02%)
std::vector<bool, std::allocator<bool> >::at (666,536 samples, 0.07%)
bool __gnu_cxx::operator==<ns3::BuildRarListElement_s const*, std::vector<ns3::BuildRarListElement_s, std::allocator<ns3::BuildRarListElement_s> > > (158,059 samples, 0.02%)
void std::_Construct<ns3::HigherLayerSelected_s, ns3::HigherLayerSelected_s const&> (371,159 samples, 0.04%)
ns3::MemberLteFfrSapProvider<ns3::LteFrNoOpAlgorithm>::ReportUlCqiInfo (1,540,622 samples, 0.16%)
std::vector<ns3::DlInfoListElement_s, std::allocator<ns3::DlInfoListElement_s> >::operator= (153,607 samples, 0.02%)
std::_Rb_tree<ns3::Scheduler::EventKey, std::pair<ns3::Scheduler::EventKey const, ns3::EventImpl*>, std::_Select1st<std::pair<ns3::Scheduler::EventKey const, ns3::EventImpl*> >, std::less<ns3::Scheduler::EventKey>, std::allocator<std::pair<ns3::Scheduler::EventKey const, ns3::EventImpl*> > >::_M_get_node (203,653 samples, 0.02%)
std::_Vector_base<int, std::allocator<int> >::_M_allocate (450,221 samples, 0.05%)
std::vector<ns3::DlInfoListElement_s, std::allocator<ns3::DlInfoListElement_s> >::operator= (6,381,662 samples, 0.66%)
ns3::UeManager::DoInitialize (214,377 samples, 0.02%)
std::_Rb_tree_iterator<std::pair<unsigned short const, ns3::SbMeasResult_s> >::operator* (303,780 samples, 0.03%)
ns3::FfMacSchedSapProvider::SchedUlTriggerReqParameters::SchedUlTriggerReqParameters (437,313 samples, 0.05%)
std::vector<bool, std::allocator<bool> >::_M_fill_insert (276,956 samples, 0.03%)
std::_Rb_tree<unsigned char, std::pair<unsigned char const, ns3::LteMacSapUser*>, std::_Select1st<std::pair<unsigned char const, ns3::LteMacSapUser*> >, std::less<unsigned char>, std::allocator<std::pair<unsigned char const, ns3::LteMacSapUser*> > >::_S_key (486,894 samples, 0.05%)
std::__cxx11::_List_base<ns3::AttributeConstructionList::Item, std::allocator<ns3::AttributeConstructionList::Item> >::_List_base (187,407 samples, 0.02%)
double* std::__uninitialized_copy_a<__gnu_cxx::__normal_iterator<double const*, std::vector<double, std::allocator<double> > >, double*, double> (500,128 samples, 0.05%)
ns3::LteUePhy::CreateTxPowerSpectralDensity (151,318 samples, 0.02%)
ns3::LteSpectrumSignalParametersDlCtrlFrame::~LteSpectrumSignalParametersDlCtrlFrame (452,654 samples, 0.05%)
std::__cxx11::list<ns3::Ptr<ns3::LteControlMessage>, std::allocator<ns3::Ptr<ns3::LteControlMessage> > >::~list (309,041 samples, 0.03%)
std::_Bind_helper<std::__or_<std::is_integral<std::decay<void (662,137 samples, 0.07%)
std::_Rb_tree_node<std::pair<unsigned short const, std::vector<std::vector<std::vector<ns3::RlcPduListElement_s, std::allocator<ns3::RlcPduListElement_s> >, std::allocator<std::vector<ns3::RlcPduListElement_s, std::allocator<ns3::RlcPduListElement_s> > > >, std::allocator<std::vector<std::vector<ns3::RlcPduListElement_s, std::allocator<ns3::RlcPduListElement_s> >, std::allocator<std::vector<ns3::RlcPduListElement_s, std::allocator<ns3::RlcPduListElement_s> > > > > > > >::_M_valptr (160,795 samples, 0.02%)
std::vector<std::__cxx11::list<ns3::Ptr<ns3::LteControlMessage>, std::allocator<ns3::Ptr<ns3::LteControlMessage> > >, std::allocator<std::__cxx11::list<ns3::Ptr<ns3::LteControlMessage>, std::allocator<ns3::Ptr<ns3::LteControlMessage> > > > >::erase (3,046,130 samples, 0.31%)
std::vector<ns3::PhichListElement_s, std::allocator<ns3::PhichListElement_s> >::~vector (308,027 samples, 0.03%)
std::__cxx11::_List_base<ns3::Ptr<ns3::LteControlMessage>, std::allocator<ns3::Ptr<ns3::LteControlMessage> > >::_List_base (164,136 samples, 0.02%)
std::__cxx11::_List_base<ns3::AttributeConstructionList::Item, std::allocator<ns3::AttributeConstructionList::Item> >::_List_impl::_List_impl (147,640 samples, 0.02%)
std::allocator_traits<std::allocator<std::_Rb_tree_node<std::pair<unsigned short const, std::vector<double, std::allocator<double> > > > > >::allocate (474,197 samples, 0.05%)
ns3::AntennaModel* ns3::PeekPointer<ns3::AntennaModel> (215,390 samples, 0.02%)
std::_Vector_base<int, std::allocator<int> >::_Vector_base (166,957 samples, 0.02%)
std::allocator<std::_List_node<ns3::Ptr<ns3::LteControlMessage> > >::allocate (267,808 samples, 0.03%)
void std::destroy_at<ns3::Ptr<ns3::LteControlMessage> > (210,243 samples, 0.02%)
std::_Rb_tree<unsigned char, std::pair<unsigned char const, ns3::LteMacSapUser*>, std::_Select1st<std::pair<unsigned char const, ns3::LteMacSapUser*> >, std::less<unsigned char>, std::allocator<std::pair<unsigned char const, ns3::LteMacSapUser*> > >::_M_begin (165,524 samples, 0.02%)
void std::destroy_at<std::pair<ns3::Scheduler::EventKey const, ns3::EventImpl*> > (682,837 samples, 0.07%)
std::_Vector_base<double, std::allocator<double> >::_Vector_base (306,796 samples, 0.03%)
std::vector<unsigned char, std::allocator<unsigned char> >::~vector (143,941 samples, 0.01%)
std::function<void (32,042,329 samples, 3.30%) s..
void std::_Function_base::_Base_manager<std::_Bind<void (495,402 samples, 0.05%)
ns3::Packet::Copy (449,334 samples, 0.05%)
std::pair<std::_Rb_tree_iterator<std::pair<ns3::Scheduler::EventKey const, ns3::EventImpl*> >, bool>::operator= (194,342 samples, 0.02%)
std::_Function_base::_Base_manager<ns3::Callback<void, std::__cxx11::list<ns3::Ptr<ns3::LteControlMessage>, std::allocator<ns3::Ptr<ns3::LteControlMessage> > > >::Callback<void (334,381 samples, 0.03%)
std::_List_node<ns3::UlDciLteControlMessage>::_M_valptr (143,958 samples, 0.01%)
double* std::__uninitialized_default_n_1<true>::__uninit_default_n<double*, unsigned long> (1,142,786 samples, 0.12%)
ns3::MacCeValue_u::operator= (1,023,273 samples, 0.11%)
ns3::Object::DoDelete (3,074,446 samples, 0.32%)
std::_Vector_base<int, std::allocator<int> >::_Vector_impl_data::_Vector_impl_data (124,596 samples, 0.01%)
std::__allocated_ptr<std::allocator<std::_List_node<ns3::Ptr<ns3::Packet> > > >::operator= (187,028 samples, 0.02%)
std::_Bit_iterator std::copy<std::_Bit_const_iterator, std::_Bit_iterator> (308,999 samples, 0.03%)
operator delete (159,299 samples, 0.02%)
ns3::EventImpl*&& std::forward<ns3::EventImpl*> (154,501 samples, 0.02%)
ns3::MacCeListElement_s::MacCeListElement_s (314,209 samples, 0.03%)
ns3::ByteTagIterator::Next (1,253,201 samples, 0.13%)
std::_Rb_tree<unsigned short, std::pair<unsigned short const, std::vector<unsigned short, std::allocator<unsigned short> > >, std::_Select1st<std::pair<unsigned short const, std::vector<unsigned short, std::allocator<unsigned short> > > >, std::less<unsigned short>, std::allocator<std::pair<unsigned short const, std::vector<unsigned short, std::allocator<unsigned short> > > > >::find (741,040 samples, 0.08%)
ns3::SpectrumValue::SpectrumValue (2,710,426 samples, 0.28%)
ns3::SimpleRefCount<ns3::Packet, ns3::Empty, ns3::DefaultDeleter<ns3::Packet> >::Unref (439,896 samples, 0.05%)
std::_Tuple_impl<4ul, ns3::Ptr<ns3::SpectrumPhy>, std::map<unsigned int, ns3::Ptr<ns3::SpectrumValue>, std::less<unsigned int>, std::allocator<std::pair<unsigned int const, ns3::Ptr<ns3::SpectrumValue> > > > >::_Tuple_impl (185,055 samples, 0.02%)
std::vector<unsigned short, std::allocator<unsigned short> >::operator[] (127,693 samples, 0.01%)
std::_Rb_tree_iterator<std::pair<ns3::Scheduler::EventKey const, ns3::EventImpl*> >::_Rb_tree_iterator (701,037 samples, 0.07%)
std::operator== (157,371 samples, 0.02%)
ns3::DlInfoListElement_s::HarqStatus_e* std::__uninitialized_move_if_noexcept_a<ns3::DlInfoListElement_s::HarqStatus_e*, ns3::DlInfoListElement_s::HarqStatus_e*, std::allocator<ns3::DlInfoListElement_s::HarqStatus_e> > (535,507 samples, 0.06%)
std::_Tuple_impl<3ul, ns3::Ptr<ns3::SpectrumSignalParameters>, ns3::Ptr<ns3::SpectrumPhy>, std::map<unsigned int, ns3::Ptr<ns3::SpectrumValue>, std::less<unsigned int>, std::allocator<std::pair<unsigned int const, ns3::Ptr<ns3::SpectrumValue> > > > >::~_Tuple_impl (4,416,635 samples, 0.46%)
void std::allocator_traits<std::allocator<std::_Rb_tree_node<std::pair<ns3::Scheduler::EventKey const, ns3::EventImpl*> > > >::destroy<std::pair<ns3::Scheduler::EventKey const, ns3::EventImpl*> > (682,837 samples, 0.07%)
std::_Rb_tree<unsigned short, std::pair<unsigned short const, std::vector<double, std::allocator<double> > >, std::_Select1st<std::pair<unsigned short const, std::vector<double, std::allocator<double> > > >, std::less<unsigned short>, std::allocator<std::pair<unsigned short const, std::vector<double, std::allocator<double> > > > >::_M_erase (193,911 samples, 0.02%)
std::_Rb_tree_header::_M_reset (155,888 samples, 0.02%)
std::_Rb_tree<ns3::Scheduler::EventKey, std::pair<ns3::Scheduler::EventKey const, ns3::EventImpl*>, std::_Select1st<std::pair<ns3::Scheduler::EventKey const, ns3::EventImpl*> >, std::less<ns3::Scheduler::EventKey>, std::allocator<std::pair<ns3::Scheduler::EventKey const, ns3::EventImpl*> > >::_M_begin (350,813 samples, 0.04%)
std::tuple<ns3::LteEnbPhy*>::tuple<ns3::LteEnbPhy*&, true, true> (308,535 samples, 0.03%)
ns3::Ptr<ns3::Packet>::Acquire (125,666 samples, 0.01%)
(367,419 samples, 0.04%)
std::vector<int, std::allocator<int> >::end (160,898 samples, 0.02%)
std::vector<std::vector<int, std::allocator<int> >, std::allocator<std::vector<int, std::allocator<int> > > >::at (596,297 samples, 0.06%)
std::allocator<std::_Rb_tree_node<std::pair<ns3::Scheduler::EventKey const, ns3::EventImpl*> > >::allocate (185,306 samples, 0.02%)
std::_Rb_tree_node<std::pair<ns3::Scheduler::EventKey const, ns3::EventImpl*> >* std::_Rb_tree<ns3::Scheduler::EventKey, std::pair<ns3::Scheduler::EventKey const, ns3::EventImpl*>, std::_Select1st<std::pair<ns3::Scheduler::EventKey const, ns3::EventImpl*> >, std::less<ns3::Scheduler::EventKey>, std::allocator<std::pair<ns3::Scheduler::EventKey const, ns3::EventImpl*> > >::_M_create_node<std::pair<ns3::Scheduler::EventKey, ns3::EventImpl*> > (1,753,857 samples, 0.18%)
ns3::MakeEvent<void (892,230,301 samples, 92.00%) ns3::MakeEvent<void
std::_List_node<ns3::Ptr<ns3::LteControlMessage> >* std::__cxx11::list<ns3::Ptr<ns3::LteControlMessage>, std::allocator<ns3::Ptr<ns3::LteControlMessage> > >::_M_create_node<ns3::Ptr<ns3::LteControlMessage> const&> (1,255,265 samples, 0.13%)
ns3::ObjectDeleter::Delete (1,777,558 samples, 0.18%)
std::vector<bool, std::allocator<bool> >::_M_check_len (436,269 samples, 0.04%)
malloc (487,893 samples, 0.05%)
std::__cxx11::_List_base<ns3::Ptr<ns3::LteControlMessage>, std::allocator<ns3::Ptr<ns3::LteControlMessage> > >::_List_impl::_List_impl (336,148 samples, 0.03%)
std::map<unsigned char, std::map<unsigned char, ns3::LteMacSapProvider*, std::less<unsigned char>, std::allocator<std::pair<unsigned char const, ns3::LteMacSapProvider*> > >, std::less<unsigned char>, std::allocator<std::pair<unsigned char const, std::map<unsigned char, ns3::LteMacSapProvider*, std::less<unsigned char>, std::allocator<std::pair<unsigned char const, ns3::LteMacSapProvider*> > > > > >::end (242,528 samples, 0.03%)
std::_Rb_tree<unsigned short, std::pair<unsigned short const, ns3::pfsFlowPerf_t>, std::_Select1st<std::pair<unsigned short const, ns3::pfsFlowPerf_t> >, std::less<unsigned short>, std::allocator<std::pair<unsigned short const, ns3::pfsFlowPerf_t> > >::find (767,082 samples, 0.08%)
ns3::LteEnbMac::DoSchedUlConfigInd (308,659 samples, 0.03%)
ns3::PacketBurst::GetSize (264,448 samples, 0.03%)
std::__cxx11::list<ns3::Callback<void, ns3::Ptr<ns3::MobilityModel const>, ns3::Ptr<ns3::MobilityModel const>, double, double, double, double>, std::allocator<ns3::Callback<void, ns3::Ptr<ns3::MobilityModel const>, ns3::Ptr<ns3::MobilityModel const>, double, double, double, double> > >::begin (239,520 samples, 0.02%)
std::vector<ns3::Buffer::Data*, std::allocator<ns3::Buffer::Data*> >::back (335,354 samples, 0.03%)
ns3::Ptr<ns3::SpectrumModel const>::~Ptr (199,027 samples, 0.02%)
ns3::Object::DoDelete (4,924,388 samples, 0.51%)
ns3::DlInfoListElement_s::HarqStatus_e* std::__uninitialized_copy_a<std::move_iterator<ns3::DlInfoListElement_s::HarqStatus_e*>, ns3::DlInfoListElement_s::HarqStatus_e*, ns3::DlInfoListElement_s::HarqStatus_e> (347,263 samples, 0.04%)
ns3::DlInfoListElement_s::HarqStatus_e* std::__uninitialized_copy<true>::__uninit_copy<__gnu_cxx::__normal_iterator<ns3::DlInfoListElement_s::HarqStatus_e const*, std::vector<ns3::DlInfoListElement_s::HarqStatus_e, std::allocator<ns3::DlInfoListElement_s::HarqStatus_e> > >, ns3::DlInfoListElement_s::HarqStatus_e*> (683,830 samples, 0.07%)
std::_Rb_tree<unsigned short, std::pair<unsigned short const, std::vector<double, std::allocator<double> > >, std::_Select1st<std::pair<unsigned short const, std::vector<double, std::allocator<double> > > >, std::less<unsigned short>, std::allocator<std::pair<unsigned short const, std::vector<double, std::allocator<double> > > > >::_Rb_tree (459,078 samples, 0.05%)
ns3::LogComponent::IsEnabled (288,439 samples, 0.03%)
ns3::Ptr<ns3::LteSpectrumSignalParametersDlCtrlFrame> ns3::DynamicCast<ns3::LteSpectrumSignalParametersDlCtrlFrame, ns3::SpectrumSignalParameters> (649,747 samples, 0.07%)
std::vector<bool, std::allocator<bool> >::resize (2,656,618 samples, 0.27%)
std::vector<int, std::allocator<int> >::_M_check_len (294,493 samples, 0.03%)
std::_Rb_tree<unsigned short, std::pair<unsigned short const, std::vector<unsigned short, std::allocator<unsigned short> > >, std::_Select1st<std::pair<unsigned short const, std::vector<unsigned short, std::allocator<unsigned short> > > >, std::less<unsigned short>, std::allocator<std::pair<unsigned short const, std::vector<unsigned short, std::allocator<unsigned short> > > > >::_M_destroy_node (419,586 samples, 0.04%)
std::_Any_data::_M_access (156,527 samples, 0.02%)
std::_Vector_base<double, std::allocator<double> >::_Vector_impl::_Vector_impl (221,723 samples, 0.02%)
ns3::HigherLayerSelected_s* std::uninitialized_copy<__gnu_cxx::__normal_iterator<ns3::HigherLayerSelected_s const*, std::vector<ns3::HigherLayerSelected_s, std::allocator<ns3::HigherLayerSelected_s> > >, ns3::HigherLayerSelected_s*> (324,739 samples, 0.03%)
void std::__relocate_object_a<ns3::HigherLayerSelected_s, ns3::HigherLayerSelected_s, std::allocator<ns3::HigherLayerSelected_s> > (878,397 samples, 0.09%)
std::__cxx11::_List_base<ns3::Ptr<ns3::LteControlMessage>, std::allocator<ns3::Ptr<ns3::LteControlMessage> > >::_List_impl::_List_impl (210,164 samples, 0.02%)
std::_Bvector_base<std::allocator<bool> >::_Bvector_impl_data::_M_reset (230,239 samples, 0.02%)
std::_Vector_base<double, std::allocator<double> >::_M_deallocate (276,642 samples, 0.03%)
ns3::LteInterference::StartRx (5,493,483 samples, 0.57%)
std::_Function_handler<void (16,143,749 samples, 1.66%)
ns3::Object::~Object (187,951 samples, 0.02%)
ns3::EnbMacMemberFfMacSchedSapUser::SchedUlConfigInd (577,569 samples, 0.06%)
std::tuple<ns3::MultiModelSpectrumChannel*, ns3::Ptr<ns3::SpectrumValue>, double, ns3::Ptr<ns3::SpectrumSignalParameters>, ns3::Ptr<ns3::SpectrumPhy>, std::map<unsigned int, ns3::Ptr<ns3::SpectrumValue>, std::less<unsigned int>, std::allocator<std::pair<unsigned int const, ns3::Ptr<ns3::SpectrumValue> > > > >::tuple (411,266 samples, 0.04%)
ns3::TagBuffer::WriteU8 (158,006 samples, 0.02%)
ns3::RlcTag::RlcTag (398,815 samples, 0.04%)
std::vector<double, std::allocator<double> >::operator= (476,320 samples, 0.05%)
ns3::SpectrumValue::operator[] (159,219 samples, 0.02%)
ns3::DlInfoListElement_s::HarqStatus_e* std::__copy_move_a1<true, ns3::DlInfoListElement_s::HarqStatus_e*, ns3::DlInfoListElement_s::HarqStatus_e*> (155,079 samples, 0.02%)
[libm.so.6] (156,224 samples, 0.02%)
std::__cxx11::_List_base<ns3::Ptr<ns3::LteControlMessage>, std::allocator<ns3::Ptr<ns3::LteControlMessage> > >::_List_impl::_List_impl (241,099 samples, 0.02%)
__gnu_cxx::__normal_iterator<ns3::Ptr<ns3::PacketBurst>*, std::vector<ns3::Ptr<ns3::PacketBurst>, std::allocator<ns3::Ptr<ns3::PacketBurst> > > > std::__copy_move_a<true, __gnu_cxx::__normal_iterator<ns3::Ptr<ns3::PacketBurst>*, std::vector<ns3::Ptr<ns3::PacketBurst>, std::allocator<ns3::Ptr<ns3::PacketBurst> > > >, __gnu_cxx::__normal_iterator<ns3::Ptr<ns3::PacketBurst>*, std::vector<ns3::Ptr<ns3::PacketBurst>, std::allocator<ns3::Ptr<ns3::PacketBurst> > > > > (536,978 samples, 0.06%)
ns3::SimpleRefCount<ns3::EventImpl, ns3::Empty, ns3::DefaultDeleter<ns3::EventImpl> >::Unref (977,824 samples, 0.10%)
ns3::IidManager::GetAttributeN (954,513 samples, 0.10%)
std::_Rb_tree_node<std::pair<unsigned short const, std::vector<std::vector<ns3::Ptr<ns3::PacketBurst>, std::allocator<ns3::Ptr<ns3::PacketBurst> > >, std::allocator<std::vector<ns3::Ptr<ns3::PacketBurst>, std::allocator<ns3::Ptr<ns3::PacketBurst> > > > > > >::_M_valptr (275,542 samples, 0.03%)
ns3::Ptr<ns3::PacketBurst>* std::__copy_move_a1<true, ns3::Ptr<ns3::PacketBurst>*, ns3::Ptr<ns3::PacketBurst>*> (497,602 samples, 0.05%)
ns3::LteRadioBearerTag::LteRadioBearerTag (284,170 samples, 0.03%)
ns3::PacketBurst::GetTypeId (206,883 samples, 0.02%)
std::__cxx11::list<ns3::Ptr<ns3::PacketBurst>, std::allocator<ns3::Ptr<ns3::PacketBurst> > >::push_back (3,021,585 samples, 0.31%)
ns3::Time::ToInteger (261,832 samples, 0.03%)
ns3::SpectrumValue::SpectrumValue (1,206,985 samples, 0.12%)
std::__new_allocator<unsigned short>::allocate (337,690 samples, 0.03%)
void std::destroy_at<ns3::Ptr<ns3::Packet> > (142,224 samples, 0.01%)
ns3::Angles::CheckIfValid (194,633 samples, 0.02%)
ns3::PfFfMacScheduler::RefreshUlCqiMaps (631,523 samples, 0.07%)
std::_Vector_base<unsigned short, std::allocator<unsigned short> >::_M_get_Tp_allocator (239,915 samples, 0.02%)
std::_Vector_base<unsigned short, std::allocator<unsigned short> >::_Vector_impl_data::_Vector_impl_data (204,699 samples, 0.02%)
ns3::Callback<void, unsigned short, ns3::Ptr<ns3::SpectrumValue> >::operator (1,399,576 samples, 0.14%)
void std::__cxx11::list<ns3::Ptr<ns3::Packet>, std::allocator<ns3::Ptr<ns3::Packet> > >::_M_insert<ns3::Ptr<ns3::Packet> const&> (645,709 samples, 0.07%)
ns3::PacketBurst::AddPacket (307,397 samples, 0.03%)
operator new[] (234,036 samples, 0.02%)
__gnu_cxx::__normal_iterator<ns3::HigherLayerSelected_s*, std::vector<ns3::HigherLayerSelected_s, std::allocator<ns3::HigherLayerSelected_s> > > std::__copy_move_a<false, __gnu_cxx::__normal_iterator<ns3::HigherLayerSelected_s const*, std::vector<ns3::HigherLayerSelected_s, std::allocator<ns3::HigherLayerSelected_s> > >, __gnu_cxx::__normal_iterator<ns3::HigherLayerSelected_s*, std::vector<ns3::HigherLayerSelected_s, std::allocator<ns3::HigherLayerSelected_s> > > > (337,592 samples, 0.03%)
std::_Function_base::_Base_manager<std::_Bind<void (151,215 samples, 0.02%)
std::vector<double, std::allocator<double> >::operator= (865,226 samples, 0.09%)
std::vector<std::__cxx11::list<ns3::UlDciLteControlMessage, std::allocator<ns3::UlDciLteControlMessage> >, std::allocator<std::__cxx11::list<ns3::UlDciLteControlMessage, std::allocator<ns3::UlDciLteControlMessage> > > >::_M_erase (330,114 samples, 0.03%)
double* std::__uninitialized_default_n<double*, unsigned long> (355,888 samples, 0.04%)
std::map<unsigned short, unsigned char, std::less<unsigned short>, std::allocator<std::pair<unsigned short const, unsigned char> > >::find (1,128,415 samples, 0.12%)
std::_Rb_tree<unsigned int, std::pair<unsigned int const, ns3::Ptr<ns3::SpectrumValue> >, std::_Select1st<std::pair<unsigned int const, ns3::Ptr<ns3::SpectrumValue> > >, std::less<unsigned int>, std::allocator<std::pair<unsigned int const, ns3::Ptr<ns3::SpectrumValue> > > >::_M_get_node (153,956 samples, 0.02%)
std::_Vector_base<ns3::HigherLayerSelected_s, std::allocator<ns3::HigherLayerSelected_s> >::_M_allocate (160,120 samples, 0.02%)
std::less<unsigned char>::operator (167,620 samples, 0.02%)
(199,807 samples, 0.02%)
std::this_thread::get_id (811,600 samples, 0.08%)
ns3::PacketTagList::~PacketTagList (284,832 samples, 0.03%)
std::_Bind<void (1,517,738 samples, 0.16%)
ns3::LteSpectrumPhy::StartTxDataFrame (46,273,897 samples, 4.77%) ns3..
ns3::LteSpectrumPhy::StartRxDlCtrl (11,425,137 samples, 1.18%)
ns3::MemberLteFfrSapProvider<ns3::LteFrNoOpAlgorithm>::GetAvailableDlRbg (918,216 samples, 0.09%)
ns3::MacCeListElement_s::MacCeListElement_s (1,971,723 samples, 0.20%)
std::__cxx11::_List_base<ns3::Ptr<ns3::LteControlMessage>, std::allocator<ns3::Ptr<ns3::LteControlMessage> > >::_List_base (195,602 samples, 0.02%)
std::vector<ns3::CqiListElement_s, std::allocator<ns3::CqiListElement_s> >::max_size (266,439 samples, 0.03%)
std::vector<ns3::HarqProcessInfoElement_t, std::allocator<ns3::HarqProcessInfoElement_t> > const& std::forward<std::vector<ns3::HarqProcessInfoElement_t, std::allocator<ns3::HarqProcessInfoElement_t> > const&> (158,064 samples, 0.02%)
ns3::Object::~Object (194,631 samples, 0.02%)
__gnu_cxx::__normal_iterator<signed char const*, std::vector<signed char, std::allocator<signed char> > >::difference_type __gnu_cxx::operator-<signed char const*, std::vector<signed char, std::allocator<signed char> > > (153,078 samples, 0.02%)
ns3::LteEnbPhy::GeneratePowerAllocationMap (4,944,219 samples, 0.51%)
std::vector<ns3::Ptr<ns3::PacketBurst>, std::allocator<ns3::Ptr<ns3::PacketBurst> > >::push_back (875,814 samples, 0.09%)
std::__fill_a1 (312,132 samples, 0.03%)
std::vector<bool, std::allocator<bool> >::cbegin (159,970 samples, 0.02%)
void std::allocator_traits<std::allocator<std::_Rb_tree_node<std::pair<int const, double> > > >::construct<std::pair<int const, double>, std::pair<int const, double> const&> (164,321 samples, 0.02%)
ns3::LteSpectrumPhy*& std::forward<ns3::LteSpectrumPhy*&> (158,008 samples, 0.02%)
std::__cxx11::_List_base<ns3::Ptr<ns3::LteControlMessage>, std::allocator<ns3::Ptr<ns3::LteControlMessage> > >::_M_clear (414,587 samples, 0.04%)
[libc.so.6] (158,177 samples, 0.02%)
ns3::IidManager::GetAttributeN (771,224 samples, 0.08%)
void std::_Function_base::_Base_manager<std::_Bind<void (151,076 samples, 0.02%)
ns3::LteUePhy*& std::__get_helper<0ul, ns3::LteUePhy*, unsigned int, unsigned int> (184,584 samples, 0.02%)
std::_Rb_tree_node<std::pair<unsigned short const, std::vector<unsigned short, std::allocator<unsigned short> > > >* std::_Rb_tree<unsigned short, std::pair<unsigned short const, std::vector<unsigned short, std::allocator<unsigned short> > >, std::_Select1st<std::pair<unsigned short const, std::vector<unsigned short, std::allocator<unsigned short> > > >, std::less<unsigned short>, std::allocator<std::pair<unsigned short const, std::vector<unsigned short, std::allocator<unsigned short> > > > >::_M_create_node<std::piecewise_construct_t const&, std::tuple<unsigned short const&>, std::tuple<> > (1,505,468 samples, 0.16%)
std::vector<int, std::allocator<int> >::at (320,661 samples, 0.03%)
std::vector<ns3::Ptr<ns3::Object>, std::allocator<ns3::Ptr<ns3::Object> > >::clear (202,759 samples, 0.02%)
ns3::Object::~Object (611,395 samples, 0.06%)
[libm.so.6] (230,207 samples, 0.02%)
std::vector<double, std::allocator<double> >::begin (158,175 samples, 0.02%)
void std::allocator_traits<std::allocator<std::_List_node<ns3::Ptr<ns3::LteControlMessage> > > >::construct<ns3::Ptr<ns3::LteControlMessage>, ns3::Ptr<ns3::LteControlMessage> const&> (153,618 samples, 0.02%)
ns3::SimpleRefCount<ns3::Object, ns3::ObjectBase, ns3::ObjectDeleter>::~SimpleRefCount (245,743 samples, 0.03%)
std::_Vector_base<ns3::HigherLayerSelected_s, std::allocator<ns3::HigherLayerSelected_s> >::_M_allocate (201,689 samples, 0.02%)
std::map<unsigned char, ns3::LteMacSapUser*, std::less<unsigned char>, std::allocator<std::pair<unsigned char const, ns3::LteMacSapUser*> > >::at (497,296 samples, 0.05%)
std::__cxx11::list<ns3::Ptr<ns3::LteControlMessage>, std::allocator<ns3::Ptr<ns3::LteControlMessage> > >::operator= (149,250 samples, 0.02%)
ns3::EnbMacMemberLteEnbPhySapUser::ReceivePhyPdu (14,054,177 samples, 1.45%)
__gnu_cxx::__aligned_membuf<ns3::Ptr<ns3::Packet> >::_M_addr (270,625 samples, 0.03%)
ns3::SpectrumValue::SpectrumValue (323,152 samples, 0.03%)
std::__cxx11::_List_base<ns3::AttributeConstructionList::Item, std::allocator<ns3::AttributeConstructionList::Item> >::_List_impl::_List_impl (461,286 samples, 0.05%)
std::_Bind<void (151,076 samples, 0.02%)
std::operator+ (162,486 samples, 0.02%)
std::_Rb_tree<unsigned int, std::pair<unsigned int const, ns3::Ptr<ns3::SpectrumValue> >, std::_Select1st<std::pair<unsigned int const, ns3::Ptr<ns3::SpectrumValue> > >, std::less<unsigned int>, std::allocator<std::pair<unsigned int const, ns3::Ptr<ns3::SpectrumValue> > > >::_Rb_tree (158,119 samples, 0.02%)
ns3::PacketBurst::PacketBurst (1,087,646 samples, 0.11%)
ns3::operator< (412,114 samples, 0.04%)
unsigned int* std::__uninitialized_fill_n<true>::__uninit_fill_n<unsigned int*, unsigned long, unsigned int> (908,274 samples, 0.09%)
ns3::Ptr<ns3::PacketBurst const>::Ptr<ns3::PacketBurst> (233,298 samples, 0.02%)
ns3::MacCeListElement_s* std::__uninitialized_copy<false>::__uninit_copy<__gnu_cxx::__normal_iterator<ns3::MacCeListElement_s*, std::vector<ns3::MacCeListElement_s, std::allocator<ns3::MacCeListElement_s> > >, ns3::MacCeListElement_s*> (921,768 samples, 0.10%)
std::vector<unsigned short, std::allocator<unsigned short> >::vector (485,304 samples, 0.05%)
std::_Bind_helper<std::__or_<std::is_integral<std::decay<void (266,478 samples, 0.03%)
std::_Rb_tree<unsigned short, std::pair<unsigned short const, std::vector<std::vector<std::vector<ns3::RlcPduListElement_s, std::allocator<ns3::RlcPduListElement_s> >, std::allocator<std::vector<ns3::RlcPduListElement_s, std::allocator<ns3::RlcPduListElement_s> > > >, std::allocator<std::vector<std::vector<ns3::RlcPduListElement_s, std::allocator<ns3::RlcPduListElement_s> >, std::allocator<std::vector<ns3::RlcPduListElement_s, std::allocator<ns3::RlcPduListElement_s> > > > > > >, std::_Select1st<std::pair<unsigned short const, std::vector<std::vector<std::vector<ns3::RlcPduListElement_s, std::allocator<ns3::RlcPduListElement_s> >, std::allocator<std::vector<ns3::RlcPduListElement_s, std::allocator<ns3::RlcPduListElement_s> > > >, std::allocator<std::vector<std::vector<ns3::RlcPduListElement_s, std::allocator<ns3::RlcPduListElement_s> >, std::allocator<std::vector<ns3::RlcPduListElement_s, std::allocator<ns3::RlcPduListElement_s> > > > > > > >, std::less<unsigned short>, std::allocator<std::pair<unsigned short const, std::vector<std::vector<std::vector<ns3::RlcPduListElement_s, std::allocator<ns3::RlcPduListElement_s> >, std::allocator<std::vector<ns3::RlcPduListElement_s, std::allocator<ns3::RlcPduListElement_s> > > >, std::allocator<std::vector<std::vector<ns3::RlcPduListElement_s, std::allocator<ns3::RlcPduListElement_s> >, std::allocator<std::vector<ns3::RlcPduListElement_s, std::allocator<ns3::RlcPduListElement_s> > > > > > > > >::_S_key (686,320 samples, 0.07%)
std::__new_allocator<int>::allocate (152,677 samples, 0.02%)
std::_Rb_tree_node<std::pair<unsigned int const, ns3::Ptr<ns3::SpectrumValue> > >* std::_Rb_tree<unsigned int, std::pair<unsigned int const, ns3::Ptr<ns3::SpectrumValue> >, std::_Select1st<std::pair<unsigned int const, ns3::Ptr<ns3::SpectrumValue> > >, std::less<unsigned int>, std::allocator<std::pair<unsigned int const, ns3::Ptr<ns3::SpectrumValue> > > >::_M_copy<false, std::_Rb_tree<unsigned int, std::pair<unsigned int const, ns3::Ptr<ns3::SpectrumValue> >, std::_Select1st<std::pair<unsigned int const, ns3::Ptr<ns3::SpectrumValue> > >, std::less<unsigned int>, std::allocator<std::pair<unsigned int const, ns3::Ptr<ns3::SpectrumValue> > > >::_Alloc_node> (155,456 samples, 0.02%)
std::_List_node<ns3::Ptr<ns3::Packet> >::_M_valptr (361,692 samples, 0.04%)
decltype (194,571 samples, 0.02%)
std::_Rb_tree<unsigned char, std::pair<unsigned char const, ns3::LteUeMac::LcInfo>, std::_Select1st<std::pair<unsigned char const, ns3::LteUeMac::LcInfo> >, std::less<unsigned char>, std::allocator<std::pair<unsigned char const, ns3::LteUeMac::LcInfo> > >::find (1,135,998 samples, 0.12%)
std::_Rb_tree<unsigned short, std::pair<unsigned short const, std::vector<std::vector<ns3::HarqProcessInfoElement_t, std::allocator<ns3::HarqProcessInfoElement_t> >, std::allocator<std::vector<ns3::HarqProcessInfoElement_t, std::allocator<ns3::HarqProcessInfoElement_t> > > > >, std::_Select1st<std::pair<unsigned short const, std::vector<std::vector<ns3::HarqProcessInfoElement_t, std::allocator<ns3::HarqProcessInfoElement_t> >, std::allocator<std::vector<ns3::HarqProcessInfoElement_t, std::allocator<ns3::HarqProcessInfoElement_t> > > > > >, std::less<unsigned short>, std::allocator<std::pair<unsigned short const, std::vector<std::vector<ns3::HarqProcessInfoElement_t, std::allocator<ns3::HarqProcessInfoElement_t> >, std::allocator<std::vector<ns3::HarqProcessInfoElement_t, std::allocator<ns3::HarqProcessInfoElement_t> > > > > > >::_M_mbegin (309,940 samples, 0.03%)
ns3::Singleton<ns3::IidManager>::Get (195,646 samples, 0.02%)
void std::destroy_at<ns3::CqiListElement_s> (933,761 samples, 0.10%)
unsigned char* std::__uninitialized_fill_n_a<unsigned char*, unsigned long, unsigned char, unsigned char> (492,278 samples, 0.05%)
std::_Rb_tree_node<std::pair<unsigned short const, ns3::pfsFlowPerf_t> >::_M_valptr (433,705 samples, 0.04%)
ns3::Object::SetTypeId (871,023 samples, 0.09%)
ns3::PacketMetadata::~PacketMetadata (1,016,942 samples, 0.10%)
__gnu_cxx::__aligned_membuf<std::pair<unsigned short const, unsigned int> >::_M_addr (218,793 samples, 0.02%)
void std::_Destroy<ns3::Ptr<ns3::Object>*> (283,533 samples, 0.03%)
std::_Vector_base<double, std::allocator<double> >::_M_allocate (198,702 samples, 0.02%)
std::__cxx11::_List_base<ns3::Ptr<ns3::Packet>, std::allocator<ns3::Ptr<ns3::Packet> > >::~_List_base (241,713 samples, 0.02%)
std::vector<ns3::MacCeListElement_s, std::allocator<ns3::MacCeListElement_s> >::max_size (163,785 samples, 0.02%)
__gnu_cxx::__normal_iterator<double const*, std::vector<double, std::allocator<double> > > std::__miter_base<__gnu_cxx::__normal_iterator<double const*, std::vector<double, std::allocator<double> > > > (194,496 samples, 0.02%)
ns3::Ptr<ns3::LteSpectrumSignalParametersDlCtrlFrame>::Ptr (189,795 samples, 0.02%)
std::vector<ns3::HarqProcessInfoElement_t, std::allocator<ns3::HarqProcessInfoElement_t> >::operator= (148,381 samples, 0.02%)
std::_Rb_tree<unsigned short, std::pair<unsigned short const, std::vector<unsigned short, std::allocator<unsigned short> > >, std::_Select1st<std::pair<unsigned short const, std::vector<unsigned short, std::allocator<unsigned short> > > >, std::less<unsigned short>, std::allocator<std::pair<unsigned short const, std::vector<unsigned short, std::allocator<unsigned short> > > > >::_Auto_node::_Auto_node<std::piecewise_construct_t const&, std::tuple<unsigned short const&>, std::tuple<> > (151,184 samples, 0.02%)
std::_Function_handler<void (1,235,121 samples, 0.13%)
std::_Bind<void (613,231 samples, 0.06%)
std::allocator_traits<std::allocator<int> >::allocate (169,207 samples, 0.02%)
std::__cxx11::_List_base<ns3::Ptr<ns3::Packet>, std::allocator<ns3::Ptr<ns3::Packet> > >::_List_impl::_List_impl (394,429 samples, 0.04%)
ns3::Object::SetTypeId (654,252 samples, 0.07%)
std::map<ns3::TbId_t, ns3::tbInfo_t, std::less<ns3::TbId_t>, std::allocator<std::pair<ns3::TbId_t const, ns3::tbInfo_t> > >::find (1,512,230 samples, 0.16%)
std::_Rb_tree<unsigned int, std::pair<unsigned int const, ns3::TxSpectrumModelInfo>, std::_Select1st<std::pair<unsigned int const, ns3::TxSpectrumModelInfo> >, std::less<unsigned int>, std::allocator<std::pair<unsigned int const, ns3::TxSpectrumModelInfo> > >::find (1,760,133 samples, 0.18%)
void std::allocator_traits<std::allocator<std::_List_node<ns3::Ptr<ns3::LteControlMessage> > > >::destroy<ns3::Ptr<ns3::LteControlMessage> > (152,858 samples, 0.02%)
std::__cxx11::list<ns3::Ptr<ns3::LteControlMessage>, std::allocator<ns3::Ptr<ns3::LteControlMessage> > >::list (3,992,341 samples, 0.41%)
unsigned char* std::uninitialized_copy<__gnu_cxx::__normal_iterator<unsigned char const*, std::vector<unsigned char, std::allocator<unsigned char> > >, unsigned char*> (592,631 samples, 0.06%)
ns3::SbMeasResult_s::operator= (850,226 samples, 0.09%)
ns3::DlHarqFeedbackLteControlMessage::DlHarqFeedbackLteControlMessage (507,137 samples, 0.05%)
[libc.so.6] (159,006 samples, 0.02%)
ns3::SpectrumValue::SpectrumValue (1,462,868 samples, 0.15%)
std::_List_const_iterator<ns3::Callback<void, ns3::Ptr<ns3::SpectrumSignalParameters> > >::_List_const_iterator (197,677 samples, 0.02%)
ns3::SpectrumValue::~SpectrumValue (190,332 samples, 0.02%)
std::_Rb_tree_node<std::pair<ns3::Scheduler::EventKey const, ns3::EventImpl*> >::_M_valptr (199,039 samples, 0.02%)
int* std::__copy_move_a1<false, int const*, int*> (162,673 samples, 0.02%)
ns3::Ptr<ns3::Packet>::Ptr (124,350 samples, 0.01%)
std::_List_const_iterator<ns3::Callback<void, ns3::Ptr<ns3::Packet const> > >::_List_const_iterator (161,515 samples, 0.02%)
std::_Vector_base<int, std::allocator<int> >::_Vector_base (198,351 samples, 0.02%)
void std::_Construct<ns3::DlInfoListElement_s, ns3::DlInfoListElement_s const&> (411,592 samples, 0.04%)
std::vector<std::__cxx11::list<ns3::UlDciLteControlMessage, std::allocator<ns3::UlDciLteControlMessage> >, std::allocator<std::__cxx11::list<ns3::UlDciLteControlMessage, std::allocator<ns3::UlDciLteControlMessage> > > >::cbegin (266,872 samples, 0.03%)
double const* std::__niter_base<double const*, std::vector<double, std::allocator<double> > > (274,054 samples, 0.03%)
ns3::PacketBurst::PacketBurst (146,079 samples, 0.02%)
std::_List_const_iterator<ns3::Callback<void, unsigned short, unsigned char, unsigned int> >::_List_const_iterator (240,206 samples, 0.02%)
ns3::LteUePhy::ReportRsReceivedPower (3,913,990 samples, 0.40%)
ns3::Ptr<ns3::UlDciLteControlMessage> ns3::Create<ns3::UlDciLteControlMessage> (305,849 samples, 0.03%)
std::vector<unsigned short, std::allocator<unsigned short> >::vector (2,378,553 samples, 0.25%)
unsigned short* std::copy<std::move_iterator<unsigned short*>, unsigned short*> (154,651 samples, 0.02%)
std::_List_node<ns3::Ptr<ns3::Packet> >::_M_valptr (444,952 samples, 0.05%)
std::vector<ns3::CqiListElement_s, std::allocator<ns3::CqiListElement_s> >::vector (187,210 samples, 0.02%)
std::_Vector_base<unsigned short, std::allocator<unsigned short> >::_Vector_base (159,388 samples, 0.02%)
ns3::MobilityModel::GetPosition (542,316 samples, 0.06%)
ns3::Ptr<ns3::Packet>::~Ptr (2,803,402 samples, 0.29%)
std::__cxx11::list<ns3::AttributeConstructionList::Item, std::allocator<ns3::AttributeConstructionList::Item> >::~list (194,036 samples, 0.02%)
bool ns3::operator==<ns3::SpectrumModel const, ns3::SpectrumModel const> (290,035 samples, 0.03%)
ns3::Ptr<ns3::PacketBurst> ns3::Create<ns3::PacketBurst> (409,956 samples, 0.04%)
ns3::PfFfMacScheduler::HarqProcessAvailability (1,102,343 samples, 0.11%)
std::_Head_base<2ul, double, false>::_M_head (124,767 samples, 0.01%)
double const& std::max<double> (155,216 samples, 0.02%)
void std::_Construct<double> (403,637 samples, 0.04%)
std::allocator_traits<std::allocator<std::_List_node<ns3::Ptr<ns3::LteControlMessage> > > >::allocate (185,442 samples, 0.02%)
ns3::LteEnbPhy::StartSubFrame (4,972,136 samples, 0.51%)
std::_Rb_tree<unsigned int, std::pair<unsigned int const, ns3::Ptr<ns3::SpectrumValue> >, std::_Select1st<std::pair<unsigned int const, ns3::Ptr<ns3::SpectrumValue> > >, std::less<unsigned int>, std::allocator<std::pair<unsigned int const, ns3::Ptr<ns3::SpectrumValue> > > >::_M_lower_bound (193,630 samples, 0.02%)
void std::_Destroy<ns3::DlInfoListElement_s*, ns3::DlInfoListElement_s> (1,227,211 samples, 0.13%)
double* std::uninitialized_copy<__gnu_cxx::__normal_iterator<double const*, std::vector<double, std::allocator<double> > >, double*> (1,091,128 samples, 0.11%)
std::_Rb_tree<unsigned short, std::pair<unsigned short const, ns3::Ptr<ns3::UeManager> >, std::_Select1st<std::pair<unsigned short const, ns3::Ptr<ns3::UeManager> > >, std::less<unsigned short>, std::allocator<std::pair<unsigned short const, ns3::Ptr<ns3::UeManager> > > >::find (186,495 samples, 0.02%)
std::operator== (203,617 samples, 0.02%)
ns3::DlDciListElement_s::~DlDciListElement_s (529,836 samples, 0.05%)
ns3::Callback<void, std::__cxx11::list<ns3::Ptr<ns3::LteControlMessage>, std::allocator<ns3::Ptr<ns3::LteControlMessage> > > >::DoPeekImpl (126,102 samples, 0.01%)
std::__cxx11::_List_base<ns3::Ptr<ns3::LteControlMessage>, std::allocator<ns3::Ptr<ns3::LteControlMessage> > >::_M_clear (221,766 samples, 0.02%)
ns3::LteSpectrumPhy::StartRxUlSrs (233,781 samples, 0.02%)
std::operator== (148,898 samples, 0.02%)
std::_Bind_helper<std::__or_<std::is_integral<std::decay<void (1,903,866 samples, 0.20%)
std::_Rb_tree<unsigned short, std::pair<unsigned short const, unsigned int>, std::_Select1st<std::pair<unsigned short const, unsigned int> >, std::less<unsigned short>, std::allocator<std::pair<unsigned short const, unsigned int> > >::_M_begin (156,571 samples, 0.02%)
std::__cxx11::_List_base<ns3::UlDciLteControlMessage, std::allocator<ns3::UlDciLteControlMessage> >::_M_put_node (278,972 samples, 0.03%)
std::__cxx11::_List_base<ns3::UlDciLteControlMessage, std::allocator<ns3::UlDciLteControlMessage> >::~_List_base (1,543,193 samples, 0.16%)
ns3::Callback<void, ns3::SpectrumValue const&>::Callback<void (167,033 samples, 0.02%)
std::_Rb_tree_node<std::pair<unsigned short const, std::vector<std::vector<ns3::HarqProcessInfoElement_t, std::allocator<ns3::HarqProcessInfoElement_t> >, std::allocator<std::vector<ns3::HarqProcessInfoElement_t, std::allocator<ns3::HarqProcessInfoElement_t> > > > > >::_M_valptr (404,825 samples, 0.04%)
std::allocator<std::_Rb_tree_node<std::pair<ns3::Scheduler::EventKey const, ns3::EventImpl*> > >::allocate (163,549 samples, 0.02%)
std::pair<ns3::TbId_t, ns3::tbInfo_t>::pair<ns3::TbId_t&, ns3::tbInfo_t&> (126,859 samples, 0.01%)
ns3::ObjectDeleter::Delete (667,572 samples, 0.07%)
std::_Rb_tree<int, std::pair<int const, double>, std::_Select1st<std::pair<int const, double> >, std::less<int>, std::allocator<std::pair<int const, double> > >::_M_erase (702,211 samples, 0.07%)
ns3::ObjectDeleter::Delete (1,796,083 samples, 0.19%)
std::__cxx11::list<ns3::AttributeConstructionList::Item, std::allocator<ns3::AttributeConstructionList::Item> >::~list (290,552 samples, 0.03%)
std::_Rb_tree<unsigned char, std::pair<unsigned char const, ns3::LteMacSapProvider*>, std::_Select1st<std::pair<unsigned char const, ns3::LteMacSapProvider*> >, std::less<unsigned char>, std::allocator<std::pair<unsigned char const, ns3::LteMacSapProvider*> > >::_M_mbegin (127,985 samples, 0.01%)
ns3::DefaultDeleter<ns3::SpectrumValue>::Delete (236,969 samples, 0.02%)
ns3::DlInfoListElement_s* std::__uninitialized_copy_a<__gnu_cxx::__normal_iterator<ns3::DlInfoListElement_s const*, std::vector<ns3::DlInfoListElement_s, std::allocator<ns3::DlInfoListElement_s> > >, ns3::DlInfoListElement_s*, ns3::DlInfoListElement_s> (451,449 samples, 0.05%)
ns3::Ptr<ns3::Packet> const& std::forward<ns3::Ptr<ns3::Packet> const&> (156,451 samples, 0.02%)
std::_Rb_tree<unsigned short, std::pair<unsigned short const, ns3::DlInfoListElement_s>, std::_Select1st<std::pair<unsigned short const, ns3::DlInfoListElement_s> >, std::less<unsigned short>, std::allocator<std::pair<unsigned short const, ns3::DlInfoListElement_s> > >::begin (164,101 samples, 0.02%)
operator new (143,903 samples, 0.01%)
unsigned short* std::__uninitialized_fill_n_a<unsigned short*, unsigned long, unsigned short, unsigned short> (897,210 samples, 0.09%)
void std::allocator_traits<std::allocator<unsigned short> >::construct<unsigned short, unsigned short const&> (146,680 samples, 0.02%)
__gnu_cxx::__normal_iterator<std::__cxx11::list<ns3::Ptr<ns3::LteControlMessage>, std::allocator<ns3::Ptr<ns3::LteControlMessage> > >*, std::vector<std::__cxx11::list<ns3::Ptr<ns3::LteControlMessage>, std::allocator<ns3::Ptr<ns3::LteControlMessage> > >, std::allocator<std::__cxx11::list<ns3::Ptr<ns3::LteControlMessage>, std::allocator<ns3::Ptr<ns3::LteControlMessage> > > > > > std::__copy_move_a<true, __gnu_cxx::__normal_iterator<std::__cxx11::list<ns3::Ptr<ns3::LteControlMessage>, std::allocator<ns3::Ptr<ns3::LteControlMessage> > >*, std::vector<std::__cxx11::list<ns3::Ptr<ns3::LteControlMessage>, std::allocator<ns3::Ptr<ns3::LteControlMessage> > >, std::allocator<std::__cxx11::list<ns3::Ptr<ns3::LteControlMessage>, std::allocator<ns3::Ptr<ns3::LteControlMessage> > > > > >, __gnu_cxx::__normal_iterator<std::__cxx11::list<ns3::Ptr<ns3::LteControlMessage>, std::allocator<ns3::Ptr<ns3::LteControlMessage> > >*, std::vector<std::__cxx11::list<ns3::Ptr<ns3::LteControlMessage>, std::allocator<ns3::Ptr<ns3::LteControlMessage> > >, std::allocator<std::__cxx11::list<ns3::Ptr<ns3::LteControlMessage>, std::allocator<ns3::Ptr<ns3::LteControlMessage> > > > > > > (226,371 samples, 0.02%)
ns3::DlInfoListElement_s* std::uninitialized_copy<__gnu_cxx::__normal_iterator<ns3::DlInfoListElement_s const*, std::vector<ns3::DlInfoListElement_s, std::allocator<ns3::DlInfoListElement_s> > >, ns3::DlInfoListElement_s*> (4,951,937 samples, 0.51%)
std::_Vector_base<ns3::VendorSpecificListElement_s, std::allocator<ns3::VendorSpecificListElement_s> >::_M_create_storage (308,409 samples, 0.03%)
ns3::TypeId::TypeId (431,756 samples, 0.04%)
std::_Rb_tree<unsigned int, std::pair<unsigned int const, ns3::Ptr<ns3::SpectrumValue> >, std::_Select1st<std::pair<unsigned int const, ns3::Ptr<ns3::SpectrumValue> > >, std::less<unsigned int>, std::allocator<std::pair<unsigned int const, ns3::Ptr<ns3::SpectrumValue> > > >::_M_get_insert_unique_pos (157,629 samples, 0.02%)
ns3::Ptr<ns3::LteSpectrumSignalParametersDlCtrlFrame> ns3::Create<ns3::LteSpectrumSignalParametersDlCtrlFrame, ns3::LteSpectrumSignalParametersDlCtrlFrame const&> (7,022,110 samples, 0.72%)
std::map<unsigned short, unsigned int, std::less<unsigned short>, std::allocator<std::pair<unsigned short const, unsigned int> > >::clear (355,870 samples, 0.04%)
std::_Rb_tree_node<std::pair<int const, double> >::_M_valptr (124,708 samples, 0.01%)
std::vector<ns3::BuildRarListElement_s, std::allocator<ns3::BuildRarListElement_s> >::empty (194,427 samples, 0.02%)
ns3::MacCeListElement_s* std::uninitialized_copy<__gnu_cxx::__normal_iterator<ns3::MacCeListElement_s*, std::vector<ns3::MacCeListElement_s, std::allocator<ns3::MacCeListElement_s> > >, ns3::MacCeListElement_s*> (957,513 samples, 0.10%)
ns3::LteEnbPhy::SetDownlinkSubChannels (1,402,168 samples, 0.14%)
std::map<unsigned short, std::vector<unsigned short, std::allocator<unsigned short> >, std::less<unsigned short>, std::allocator<std::pair<unsigned short const, std::vector<unsigned short, std::allocator<unsigned short> > > > >::erase[abi:cxx11] (940,554 samples, 0.10%)
ns3::FfMacSchedSapProvider::SchedUlCqiInfoReqParameters::SchedUlCqiInfoReqParameters (3,384,993 samples, 0.35%)
ns3::Ptr<ns3::PacketBurst>::Ptr (143,275 samples, 0.01%)
ns3::IidManager::LookupInformation (331,597 samples, 0.03%)
void std::allocator_traits<std::allocator<std::_Rb_tree_node<std::pair<ns3::Scheduler::EventKey const, ns3::EventImpl*> > > >::construct<std::pair<ns3::Scheduler::EventKey const, ns3::EventImpl*>, std::pair<ns3::Scheduler::EventKey, ns3::EventImpl*> > (426,539 samples, 0.04%)
ns3::LteChunkProcessor::End (37,821,975 samples, 3.90%) ns..
ns3::MacCeListElement_s* std::uninitialized_copy<std::move_iterator<ns3::MacCeListElement_s*>, ns3::MacCeListElement_s*> (350,102 samples, 0.04%)
__gnu_cxx::__aligned_membuf<std::pair<unsigned short const, std::map<unsigned char, ns3::LteMacSapUser*, std::less<unsigned char>, std::allocator<std::pair<unsigned char const, ns3::LteMacSapUser*> > > > >::_M_addr (233,529 samples, 0.02%)
std::_Tuple_impl<1ul, ns3::Ptr<ns3::PacketBurst> >::~_Tuple_impl (307,442 samples, 0.03%)
std::_Tuple_impl<0ul, ns3::MultiModelSpectrumChannel*, ns3::Ptr<ns3::SpectrumValue>, double, ns3::Ptr<ns3::SpectrumSignalParameters>, ns3::Ptr<ns3::SpectrumPhy>, std::map<unsigned int, ns3::Ptr<ns3::SpectrumValue>, std::less<unsigned int>, std::allocator<std::pair<unsigned int const, ns3::Ptr<ns3::SpectrumValue> > > > >::_Tuple_impl (589,946 samples, 0.06%)
ns3::LteRlcSm::DoNotifyTxOpportunity (17,080,246 samples, 1.76%)
std::_Vector_base<ns3::VendorSpecificListElement_s, std::allocator<ns3::VendorSpecificListElement_s> >::_Vector_impl::_Vector_impl (231,916 samples, 0.02%)
__gnu_cxx::__aligned_membuf<ns3::Ptr<ns3::Packet> >::_M_ptr (444,952 samples, 0.05%)
ns3::TagBuffer::WriteU32 (388,268 samples, 0.04%)
std::_List_node<ns3::Ptr<ns3::Packet> >* std::__cxx11::list<ns3::Ptr<ns3::Packet>, std::allocator<ns3::Ptr<ns3::Packet> > >::_M_create_node<ns3::Ptr<ns3::Packet> const&> (1,438,749 samples, 0.15%)
std::__cxx11::list<ns3::Ptr<ns3::LteControlMessage>, std::allocator<ns3::Ptr<ns3::LteControlMessage> > >::end (192,716 samples, 0.02%)
ns3::ByteTagList::~ByteTagList (1,622,543 samples, 0.17%)
std::_Rb_tree<ns3::Scheduler::EventKey, std::pair<ns3::Scheduler::EventKey const, ns3::EventImpl*>, std::_Select1st<std::pair<ns3::Scheduler::EventKey const, ns3::EventImpl*> >, std::less<ns3::Scheduler::EventKey>, std::allocator<std::pair<ns3::Scheduler::EventKey const, ns3::EventImpl*> > >::_M_insert_node (362,836 samples, 0.04%)
std::_Rb_tree_rebalance_for_erase (2,258,588 samples, 0.23%)
std::vector<ns3::HigherLayerSelected_s, std::allocator<ns3::HigherLayerSelected_s> >::vector (1,025,719 samples, 0.11%)
ns3::Buffer::Recycle (836,248 samples, 0.09%)
(201,121 samples, 0.02%)
unsigned char* std::uninitialized_fill_n<unsigned char*, unsigned long, unsigned char> (189,712 samples, 0.02%)
std::_Head_base<3ul, ns3::Ptr<ns3::SpectrumSignalParameters>, false>::~_Head_base (3,402,650 samples, 0.35%)
ns3::UlInfoListElement_s* std::__do_uninit_copy<__gnu_cxx::__normal_iterator<ns3::UlInfoListElement_s const*, std::vector<ns3::UlInfoListElement_s, std::allocator<ns3::UlInfoListElement_s> > >, ns3::UlInfoListElement_s*> (794,783 samples, 0.08%)
std::enable_if<is_invocable_r_v<void, ns3::Callback<void, ns3::DlInfoListElement_s>::Callback<void (3,763,206 samples, 0.39%)
std::tuple_element<0ul, std::pair<unsigned int const&, ns3::Ptr<ns3::SpectrumValue>&> >::type&& std::get<0ul, unsigned int const&, ns3::Ptr<ns3::SpectrumValue>&> (189,759 samples, 0.02%)
ns3::LteNetDevice::GetNode (377,687 samples, 0.04%)
std::__cxx11::_List_base<ns3::Ptr<ns3::Packet>, std::allocator<ns3::Ptr<ns3::Packet> > >::_List_impl::_List_impl (126,871 samples, 0.01%)
std::__cxx11::_List_base<ns3::Ptr<ns3::LteControlMessage>, std::allocator<ns3::Ptr<ns3::LteControlMessage> > >::~_List_base (466,245 samples, 0.05%)
std::vector<unsigned char, std::allocator<unsigned char> >::_M_range_check (144,021 samples, 0.01%)
std::_Rb_tree<int, std::pair<int const, double>, std::_Select1st<std::pair<int const, double> >, std::less<int>, std::allocator<std::pair<int const, double> > >::_M_put_node (203,534 samples, 0.02%)
ns3::Packet::Copy (3,461,375 samples, 0.36%)
std::_List_iterator<ns3::Ptr<ns3::LteControlMessage> > std::__cxx11::list<ns3::Ptr<ns3::LteControlMessage>, std::allocator<ns3::Ptr<ns3::LteControlMessage> > >::insert<std::_List_const_iterator<ns3::Ptr<ns3::LteControlMessage> >, void> (2,409,911 samples, 0.25%)
ns3::LteUePhy::DoSendMacPdu (539,944 samples, 0.06%)
std::allocator_traits<std::allocator<std::_List_node<ns3::Ptr<ns3::Packet> > > >::allocate (493,183 samples, 0.05%)
void std::allocator_traits<std::allocator<std::_List_node<ns3::Ptr<ns3::LteControlMessage> > > >::destroy<ns3::Ptr<ns3::LteControlMessage> > (652,707 samples, 0.07%)
ns3::UeSelected_s::operator= (148,008 samples, 0.02%)
std::__cxx11::list<ns3::Ptr<ns3::LteControlMessage>, std::allocator<ns3::Ptr<ns3::LteControlMessage> > >::~list (148,437 samples, 0.02%)
std::map<unsigned short, unsigned int, std::less<unsigned short>, std::allocator<std::pair<unsigned short const, unsigned int> > >::find (241,202 samples, 0.02%)
std::map<unsigned short, unsigned int, std::less<unsigned short>, std::allocator<std::pair<unsigned short const, unsigned int> > >::find (1,368,772 samples, 0.14%)
ns3::SimpleRefCount<ns3::SpectrumSignalParameters, ns3::Empty, ns3::DefaultDeleter<ns3::SpectrumSignalParameters> >::SimpleRefCount (152,528 samples, 0.02%)
std::_Rb_tree_iterator<std::pair<unsigned int const, ns3::RxSpectrumModelInfo> >::operator (368,315 samples, 0.04%)
std::_Vector_base<ns3::VendorSpecificListElement_s, std::allocator<ns3::VendorSpecificListElement_s> >::_Vector_impl::_Vector_impl (228,046 samples, 0.02%)
ns3::SimpleRefCount<ns3::Packet, ns3::Empty, ns3::DefaultDeleter<ns3::Packet> >::Unref (392,648 samples, 0.04%)
std::_Vector_base<unsigned char, std::allocator<unsigned char> >::_M_allocate (157,055 samples, 0.02%)
ns3::Ptr<ns3::SpectrumModel const>::Ptr (236,748 samples, 0.02%)
void ns3::Callback<void, ns3::UlInfoListElement_s>::Callback<void (2,014,597 samples, 0.21%)
ns3::NoOpComponentCarrierManager::DoNotifyTxOpportunity (17,080,246 samples, 1.76%)
ns3::LteEnbMac::DoSchedDlConfigInd (415,834 samples, 0.04%)
std::_Vector_base<unsigned short, std::allocator<unsigned short> >::_Vector_base (326,261 samples, 0.03%)
std::_Rb_tree<unsigned short, std::pair<unsigned short const, std::vector<std::vector<ns3::Ptr<ns3::PacketBurst>, std::allocator<ns3::Ptr<ns3::PacketBurst> > >, std::allocator<std::vector<ns3::Ptr<ns3::PacketBurst>, std::allocator<ns3::Ptr<ns3::PacketBurst> > > > > >, std::_Select1st<std::pair<unsigned short const, std::vector<std::vector<ns3::Ptr<ns3::PacketBurst>, std::allocator<ns3::Ptr<ns3::PacketBurst> > >, std::allocator<std::vector<ns3::Ptr<ns3::PacketBurst>, std::allocator<ns3::Ptr<ns3::PacketBurst> > > > > > >, std::less<unsigned short>, std::allocator<std::pair<unsigned short const, std::vector<std::vector<ns3::Ptr<ns3::PacketBurst>, std::allocator<ns3::Ptr<ns3::PacketBurst> > >, std::allocator<std::vector<ns3::Ptr<ns3::PacketBurst>, std::allocator<ns3::Ptr<ns3::PacketBurst> > > > > > > >::_S_key (553,029 samples, 0.06%)
ns3::Ptr<ns3::PacketBurst>::operator (164,113 samples, 0.02%)
ns3::Ptr<ns3::PacketBurst>::Ptr (191,494 samples, 0.02%)
std::_Tuple_impl<1ul, ns3::Ptr<ns3::SpectrumValue>, double, ns3::Ptr<ns3::SpectrumSignalParameters>, ns3::Ptr<ns3::SpectrumPhy>, std::map<unsigned int, ns3::Ptr<ns3::SpectrumValue>, std::less<unsigned int>, std::allocator<std::pair<unsigned int const, ns3::Ptr<ns3::SpectrumValue> > > > >::_M_head (260,750 samples, 0.03%)
ns3::SpectrumValue::SpectrumValue (314,226 samples, 0.03%)
std::vector<ns3::MacCeListElement_s, std::allocator<ns3::MacCeListElement_s> >::_M_erase (873,141 samples, 0.09%)
std::_Bind_helper<std::__or_<std::is_integral<std::decay<void (238,561 samples, 0.02%)
ns3::PfFfMacScheduler::DoSchedDlTriggerReq (4,972,136 samples, 0.51%)
std::vector<bool, std::allocator<bool> >::resize (5,979,917 samples, 0.62%)
ns3::Packet::Packet (828,725 samples, 0.09%)
void std::_Destroy<__gnu_cxx::__normal_iterator<ns3::DlInfoListElement_s*, std::vector<ns3::DlInfoListElement_s, std::allocator<ns3::DlInfoListElement_s> > >, ns3::DlInfoListElement_s> (300,135 samples, 0.03%)
ns3::PhichListElement_s* std::__do_uninit_copy<__gnu_cxx::__normal_iterator<ns3::PhichListElement_s const*, std::vector<ns3::PhichListElement_s, std::allocator<ns3::PhichListElement_s> > >, ns3::PhichListElement_s*> (202,017 samples, 0.02%)
ns3::Ptr<ns3::SpectrumPhy>::~Ptr (195,875 samples, 0.02%)
std::_Vector_base<ns3::DlInfoListElement_s, std::allocator<ns3::DlInfoListElement_s> >::~_Vector_base (198,549 samples, 0.02%)
void std::__invoke_impl<void, void (27,633,212 samples, 2.85%) v..
ns3::PacketTagList::TagData::TagData (161,191 samples, 0.02%)
std::vector<ns3::DlInfoListElement_s, std::allocator<ns3::DlInfoListElement_s> >::operator= (640,859 samples, 0.07%)
std::_Tuple_impl<2ul, unsigned int>::_M_head (159,042 samples, 0.02%)
ns3::LteSpectrumPhy::EndTxData (1,667,932 samples, 0.17%)
std::_Vector_base<int, std::allocator<int> >::_Vector_impl::_Vector_impl (124,596 samples, 0.01%)
ns3::SpectrumValue::SpectrumValue (966,311 samples, 0.10%)
std::_Tuple_impl<0ul, ns3::MultiModelSpectrumChannel*, ns3::Ptr<ns3::SpectrumValue>, double, ns3::Ptr<ns3::SpectrumSignalParameters>, ns3::Ptr<ns3::SpectrumPhy>, std::map<unsigned int, ns3::Ptr<ns3::SpectrumValue>, std::less<unsigned int>, std::allocator<std::pair<unsigned int const, ns3::Ptr<ns3::SpectrumValue> > > > >::_Tuple_impl<ns3::MultiModelSpectrumChannel*&, ns3::Ptr<ns3::SpectrumValue>&, double&, ns3::Ptr<ns3::SpectrumSignalParameters>&, ns3::Ptr<ns3::SpectrumPhy>&, std::map<unsigned int, ns3::Ptr<ns3::SpectrumValue>, std::less<unsigned int>, std::allocator<std::pair<unsigned int const, ns3::Ptr<ns3::SpectrumValue> > > >&, void> (550,800 samples, 0.06%)
std::map<unsigned short, ns3::LteEnbComponentCarrierManager::UeInfo, std::less<unsigned short>, std::allocator<std::pair<unsigned short const, ns3::LteEnbComponentCarrierManager::UeInfo> > >::at (305,705 samples, 0.03%)
std::_Tuple_impl<1ul, ns3::Ptr<ns3::SpectrumValue>, double, ns3::Ptr<ns3::SpectrumSignalParameters>, ns3::Ptr<ns3::SpectrumPhy>, std::map<unsigned int, ns3::Ptr<ns3::SpectrumValue>, std::less<unsigned int>, std::allocator<std::pair<unsigned int const, ns3::Ptr<ns3::SpectrumValue> > > > >::_Tuple_impl (417,132 samples, 0.04%)
[libm.so.6] (165,652 samples, 0.02%)
void std::_Destroy<ns3::Ptr<ns3::Object>*, ns3::Ptr<ns3::Object> > (158,025 samples, 0.02%)
std::vector<unsigned short, std::allocator<unsigned short> >::end (314,439 samples, 0.03%)
ns3::LogComponent::IsEnabled (124,630 samples, 0.01%)
ns3::Object::GetTypeId (316,486 samples, 0.03%)
std::__cxx11::list<ns3::Ptr<ns3::Packet>, std::allocator<ns3::Ptr<ns3::Packet> > >::begin (448,394 samples, 0.05%)
ns3::LteHelper::InstallSingleEnbDevice (354,479 samples, 0.04%)
void std::allocator_traits<std::allocator<std::_Rb_tree_node<std::pair<unsigned int const, ns3::Ptr<ns3::SpectrumValue> > > > >::construct<std::pair<unsigned int const, ns3::Ptr<ns3::SpectrumValue> >, std::pair<unsigned int const, ns3::Ptr<ns3::SpectrumValue> > const&> (272,222 samples, 0.03%)
void std::_Rb_tree<ns3::TbId_t, std::pair<ns3::TbId_t const, ns3::tbInfo_t>, std::_Select1st<std::pair<ns3::TbId_t const, ns3::tbInfo_t> >, std::less<ns3::TbId_t>, std::allocator<std::pair<ns3::TbId_t const, ns3::tbInfo_t> > >::_M_construct_node<std::pair<ns3::TbId_t, ns3::tbInfo_t> > (893,221 samples, 0.09%)
ns3::DefaultDeleter<ns3::LteControlMessage>::Delete (528,952 samples, 0.05%)
std::__cxx11::list<ns3::Ptr<ns3::LteControlMessage>, std::allocator<ns3::Ptr<ns3::LteControlMessage> > >::end (163,408 samples, 0.02%)
ns3::Ptr<ns3::PacketBurst>::operator= (8,514,539 samples, 0.88%)
ns3::FfMacSchedSapUser::SchedUlConfigIndParameters::SchedUlConfigIndParameters (191,651 samples, 0.02%)
int* std::__copy_move_a<false, __gnu_cxx::__normal_iterator<int const*, std::vector<int, std::allocator<int> > >, int*> (576,469 samples, 0.06%)
std::__tuple_compare<std::tuple<double const&, double const&, double const&>, std::tuple<double const&, double const&, double const&>, 2ul, 3ul>::__eq (816,676 samples, 0.08%)
std::_Rb_tree<unsigned short, std::pair<unsigned short const, std::vector<double, std::allocator<double> > >, std::_Select1st<std::pair<unsigned short const, std::vector<double, std::allocator<double> > > >, std::less<unsigned short>, std::allocator<std::pair<unsigned short const, std::vector<double, std::allocator<double> > > > >::_M_lower_bound (671,388 samples, 0.07%)
std::_Rb_tree<unsigned short, std::pair<unsigned short const, std::vector<unsigned short, std::allocator<unsigned short> > >, std::_Select1st<std::pair<unsigned short const, std::vector<unsigned short, std::allocator<unsigned short> > > >, std::less<unsigned short>, std::allocator<std::pair<unsigned short const, std::vector<unsigned short, std::allocator<unsigned short> > > > >::_M_lower_bound (189,556 samples, 0.02%)
ns3::Buffer::Buffer (724,999 samples, 0.07%)
main (923,574,718 samples, 95.24%) main
std::vector<ns3::DlInfoListElement_s, std::allocator<ns3::DlInfoListElement_s> >::vector (511,121 samples, 0.05%)
ns3::Object::Construct (267,173 samples, 0.03%)
std::_Head_base<0ul, ns3::LteUePhy*, false>::_Head_base<ns3::LteUePhy*&> (194,018 samples, 0.02%)
std::__cxx11::list<ns3::Ptr<ns3::Packet>, std::allocator<ns3::Ptr<ns3::Packet> > >::end (268,850 samples, 0.03%)
ns3::Buffer::Buffer (1,901,878 samples, 0.20%)
unsigned char* std::__uninitialized_default_n<unsigned char*, unsigned long> (957,537 samples, 0.10%)
ns3::PacketBurst::Copy (3,716,085 samples, 0.38%)
std::_Rb_tree<unsigned short, std::pair<unsigned short const, std::vector<unsigned short, std::allocator<unsigned short> > >, std::_Select1st<std::pair<unsigned short const, std::vector<unsigned short, std::allocator<unsigned short> > > >, std::less<unsigned short>, std::allocator<std::pair<unsigned short const, std::vector<unsigned short, std::allocator<unsigned short> > > > >::_Rb_tree_impl<std::less<unsigned short>, true>::~_Rb_tree_impl (183,623 samples, 0.02%)
std::allocator_traits<std::allocator<double> >::allocate (525,645 samples, 0.05%)
ns3::LteFrNoOpAlgorithm::DoGetAvailableUlRbg (159,757 samples, 0.02%)
ns3::UlInfoListElement_s::UlInfoListElement_s (231,995 samples, 0.02%)
ns3::BsrLteControlMessage::BsrLteControlMessage (515,105 samples, 0.05%)
ns3::Ptr<ns3::Node>::Acquire (155,344 samples, 0.02%)
ns3::Ptr<ns3::DlHarqFeedbackLteControlMessage> ns3::Create<ns3::DlHarqFeedbackLteControlMessage> (705,727 samples, 0.07%)
std::allocator_traits<std::allocator<std::_Rb_tree_node<std::pair<unsigned int const, ns3::Ptr<ns3::SpectrumValue> > > > >::allocate (126,498 samples, 0.01%)
std::_Function_base::~_Function_base (240,849 samples, 0.02%)
__gnu_cxx::__aligned_membuf<ns3::Ptr<ns3::Packet> >::_M_ptr (351,633 samples, 0.04%)
ns3::AttributeConstructionList::~AttributeConstructionList (204,057 samples, 0.02%)
std::_Rb_tree<ns3::Scheduler::EventKey, std::pair<ns3::Scheduler::EventKey const, ns3::EventImpl*>, std::_Select1st<std::pair<ns3::Scheduler::EventKey const, ns3::EventImpl*> >, std::less<ns3::Scheduler::EventKey>, std::allocator<std::pair<ns3::Scheduler::EventKey const, ns3::EventImpl*> > >::key_comp (197,963 samples, 0.02%)
std::_List_node<ns3::Ptr<ns3::Packet> >::_M_valptr (551,416 samples, 0.06%)
ns3::Ptr<ns3::PacketBurst> ns3::CreateObject<ns3::PacketBurst> (5,473,984 samples, 0.56%)
std::vector<ns3::DlInfoListElement_s::HarqStatus_e, std::allocator<ns3::DlInfoListElement_s::HarqStatus_e> >::resize (1,737,961 samples, 0.18%)
std::_Rb_tree<unsigned short, std::pair<unsigned short const, std::map<unsigned char, ns3::LteMacSapUser*, std::less<unsigned char>, std::allocator<std::pair<unsigned char const, ns3::LteMacSapUser*> > > >, std::_Select1st<std::pair<unsigned short const, std::map<unsigned char, ns3::LteMacSapUser*, std::less<unsigned char>, std::allocator<std::pair<unsigned char const, ns3::LteMacSapUser*> > > > >, std::less<unsigned short>, std::allocator<std::pair<unsigned short const, std::map<unsigned char, ns3::LteMacSapUser*, std::less<unsigned char>, std::allocator<std::pair<unsigned char const, ns3::LteMacSapUser*> > > > > >::_S_key (613,037 samples, 0.06%)
std::__detail::_List_node_header::_M_init (148,323 samples, 0.02%)
bool __gnu_cxx::operator==<ns3::VendorSpecificListElement_s const*, std::vector<ns3::VendorSpecificListElement_s, std::allocator<ns3::VendorSpecificListElement_s> > > (308,120 samples, 0.03%)
ns3::PacketBurst::~PacketBurst (158,753 samples, 0.02%)
std::_Tuple_impl<0ul, ns3::MultiModelSpectrumChannel*, ns3::Ptr<ns3::SpectrumValue>, double, ns3::Ptr<ns3::SpectrumSignalParameters>, ns3::Ptr<ns3::SpectrumPhy>, std::map<unsigned int, ns3::Ptr<ns3::SpectrumValue>, std::less<unsigned int>, std::allocator<std::pair<unsigned int const, ns3::Ptr<ns3::SpectrumValue> > > > >::_Tuple_impl (417,132 samples, 0.04%)
std::__cxx11::_List_base<ns3::Ptr<ns3::LteControlMessage>, std::allocator<ns3::Ptr<ns3::LteControlMessage> > >::_M_get_node (185,442 samples, 0.02%)
std::vector<ns3::UlDciListElement_s, std::allocator<ns3::UlDciListElement_s> >::~vector (568,827 samples, 0.06%)
ns3::HarqProcessInfoElement_t* std::__uninitialized_copy_a<__gnu_cxx::__normal_iterator<ns3::HarqProcessInfoElement_t const*, std::vector<ns3::HarqProcessInfoElement_t, std::allocator<ns3::HarqProcessInfoElement_t> > >, ns3::HarqProcessInfoElement_t*, ns3::HarqProcessInfoElement_t> (489,523 samples, 0.05%)
std::_Rb_tree<ns3::LteFlowId_t, std::pair<ns3::LteFlowId_t const, ns3::FfMacSchedSapProvider::SchedDlRlcBufferReqParameters>, std::_Select1st<std::pair<ns3::LteFlowId_t const, ns3::FfMacSchedSapProvider::SchedDlRlcBufferReqParameters> >, std::less<ns3::LteFlowId_t>, std::allocator<std::pair<ns3::LteFlowId_t const, ns3::FfMacSchedSapProvider::SchedDlRlcBufferReqParameters> > >::_S_right (147,258 samples, 0.02%)
[libm.so.6] (162,241 samples, 0.02%)
ns3::int64x64_t::int64x64_t (437,040 samples, 0.05%)
std::_Rb_tree<ns3::TbId_t, std::pair<ns3::TbId_t const, ns3::tbInfo_t>, std::_Select1st<std::pair<ns3::TbId_t const, ns3::tbInfo_t> >, std::less<ns3::TbId_t>, std::allocator<std::pair<ns3::TbId_t const, ns3::tbInfo_t> > >::find (1,429,194 samples, 0.15%)
void std::__invoke_impl<void, void (324,769 samples, 0.03%)
ns3::Ptr<ns3::PacketBurst> ns3::Create<ns3::PacketBurst> (262,299 samples, 0.03%)
std::vector<ns3::RlcPduListElement_s, std::allocator<ns3::RlcPduListElement_s> >::clear (344,275 samples, 0.04%)
ns3::LteSpectrumSignalParametersUlSrsFrame::Copy (151,019 samples, 0.02%)
std::allocator_traits<std::allocator<double> >::allocate (530,824 samples, 0.05%)
ns3::SpectrumValue::operator[] (291,311 samples, 0.03%)
std::enable_if<is_invocable_r_v<void, std::_Bind<void (5,321,712 samples, 0.55%)
std::map<unsigned short, unsigned int, std::less<unsigned short>, std::allocator<std::pair<unsigned short const, unsigned int> > >::begin (224,560 samples, 0.02%)
ns3::LteEnbPhy::SetDownlinkSubChannelsWithPowerAllocation (10,110,206 samples, 1.04%)
ns3::LteHelper::InstallUeDevice (533,991 samples, 0.06%)
std::vector<std::vector<int, std::allocator<int> >, std::allocator<std::vector<int, std::allocator<int> > > >::at (374,007 samples, 0.04%)
__cxxabiv1::__si_class_type_info::__do_dyncast (332,012 samples, 0.03%)
std::_Rb_tree<unsigned short, std::pair<unsigned short const, std::vector<unsigned short, std::allocator<unsigned short> > >, std::_Select1st<std::pair<unsigned short const, std::vector<unsigned short, std::allocator<unsigned short> > > >, std::less<unsigned short>, std::allocator<std::pair<unsigned short const, std::vector<unsigned short, std::allocator<unsigned short> > > > >::_M_lower_bound (274,073 samples, 0.03%)
main (22,443,594 samples, 2.31%)
std::_Rb_tree<unsigned short, std::pair<unsigned short const, std::vector<std::vector<std::vector<ns3::RlcPduListElement_s, std::allocator<ns3::RlcPduListElement_s> >, std::allocator<std::vector<ns3::RlcPduListElement_s, std::allocator<ns3::RlcPduListElement_s> > > >, std::allocator<std::vector<std::vector<ns3::RlcPduListElement_s, std::allocator<ns3::RlcPduListElement_s> >, std::allocator<std::vector<ns3::RlcPduListElement_s, std::allocator<ns3::RlcPduListElement_s> > > > > > >, std::_Select1st<std::pair<unsigned short const, std::vector<std::vector<std::vector<ns3::RlcPduListElement_s, std::allocator<ns3::RlcPduListElement_s> >, std::allocator<std::vector<ns3::RlcPduListElement_s, std::allocator<ns3::RlcPduListElement_s> > > >, std::allocator<std::vector<std::vector<ns3::RlcPduListElement_s, std::allocator<ns3::RlcPduListElement_s> >, std::allocator<std::vector<ns3::RlcPduListElement_s, std::allocator<ns3::RlcPduListElement_s> > > > > > > >, std::less<unsigned short>, std::allocator<std::pair<unsigned short const, std::vector<std::vector<std::vector<ns3::RlcPduListElement_s, std::allocator<ns3::RlcPduListElement_s> >, std::allocator<std::vector<ns3::RlcPduListElement_s, std::allocator<ns3::RlcPduListElement_s> > > >, std::allocator<std::vector<std::vector<ns3::RlcPduListElement_s, std::allocator<ns3::RlcPduListElement_s> >, std::allocator<std::vector<ns3::RlcPduListElement_s, std::allocator<ns3::RlcPduListElement_s> > > > > > > > >::find (1,282,559 samples, 0.13%)
ns3::TypeId::GetParent (695,948 samples, 0.07%)
ns3::DlInfoListElement_s::HarqStatus_e* std::__copy_move_a<false, __gnu_cxx::__normal_iterator<ns3::DlInfoListElement_s::HarqStatus_e const*, std::vector<ns3::DlInfoListElement_s::HarqStatus_e, std::allocator<ns3::DlInfoListElement_s::HarqStatus_e> > >, ns3::DlInfoListElement_s::HarqStatus_e*> (598,769 samples, 0.06%)
__gnu_cxx::__aligned_membuf<std::pair<unsigned int const, ns3::RxSpectrumModelInfo> >::_M_addr (230,074 samples, 0.02%)
ns3::Simulator::Now (154,294 samples, 0.02%)
ns3::MakeEvent<void (361,324 samples, 0.04%)
ns3::ByteTagList::Begin (274,085 samples, 0.03%)
std::_Rb_tree<unsigned char, std::pair<unsigned char const, ns3::LteUeMac::LcInfo>, std::_Select1st<std::pair<unsigned char const, ns3::LteUeMac::LcInfo> >, std::less<unsigned char>, std::allocator<std::pair<unsigned char const, ns3::LteUeMac::LcInfo> > >::_S_key (624,690 samples, 0.06%)
std::_Rb_tree<ns3::TbId_t, std::pair<ns3::TbId_t const, ns3::tbInfo_t>, std::_Select1st<std::pair<ns3::TbId_t const, ns3::tbInfo_t> >, std::less<ns3::TbId_t>, std::allocator<std::pair<ns3::TbId_t const, ns3::tbInfo_t> > >::find (186,148 samples, 0.02%)
ns3::LogComponent::IsEnabled (203,037 samples, 0.02%)
ns3::DefaultDeleter<ns3::Packet>::Delete (750,603 samples, 0.08%)
std::_Rb_tree<unsigned short, std::pair<unsigned short const, ns3::LteEnbComponentCarrierManager::UeInfo>, std::_Select1st<std::pair<unsigned short const, ns3::LteEnbComponentCarrierManager::UeInfo> >, std::less<unsigned short>, std::allocator<std::pair<unsigned short const, ns3::LteEnbComponentCarrierManager::UeInfo> > >::_M_begin (334,035 samples, 0.03%)
ns3::HarqProcessInfoElement_t* std::__copy_move_a<false, __gnu_cxx::__normal_iterator<ns3::HarqProcessInfoElement_t const*, std::vector<ns3::HarqProcessInfoElement_t, std::allocator<ns3::HarqProcessInfoElement_t> > >, ns3::HarqProcessInfoElement_t*> (995,216 samples, 0.10%)
void std::__cxx11::list<ns3::UlDciLteControlMessage, std::allocator<ns3::UlDciLteControlMessage> >::_M_insert<ns3::UlDciLteControlMessage const&> (198,522 samples, 0.02%)
void std::__invoke_impl<void, void (72,708,735 samples, 7.50%) void s..
std::_Rb_tree<unsigned short, std::pair<unsigned short const, ns3::pfsFlowPerf_t>, std::_Select1st<std::pair<unsigned short const, ns3::pfsFlowPerf_t> >, std::less<unsigned short>, std::allocator<std::pair<unsigned short const, ns3::pfsFlowPerf_t> > >::_M_begin (162,112 samples, 0.02%)
void std::destroy_at<ns3::Ptr<ns3::PacketBurst> > (1,991,119 samples, 0.21%)
std::_Bind<void (265,283 samples, 0.03%)
std::_Bind<void (372,120 samples, 0.04%)
ns3::Ptr<ns3::SpectrumModel const>&& std::forward<ns3::Ptr<ns3::SpectrumModel const> > (196,233 samples, 0.02%)
ns3::Packet::~Packet (671,079 samples, 0.07%)
std::_List_node<ns3::Ptr<ns3::Packet> >::_M_valptr (276,707 samples, 0.03%)
ns3::Simulator::DoSchedule (1,313,182 samples, 0.14%)
std::__detail::_List_node_base::_M_hook (153,104 samples, 0.02%)
std::less<unsigned short>::operator (131,872 samples, 0.01%)
std::_Rb_tree<int, std::pair<int const, double>, std::_Select1st<std::pair<int const, double> >, std::less<int>, std::allocator<std::pair<int const, double> > >::lower_bound (147,572 samples, 0.02%)
std::pair<std::__strip_reference_wrapper<std::decay<ns3::Scheduler::EventKey const&>::type>::__type, std::__strip_reference_wrapper<std::decay<ns3::EventImpl* const&>::type>::__type> std::make_pair<ns3::Scheduler::EventKey const&, ns3::EventImpl* const&> (202,068 samples, 0.02%)
std::enable_if<is_invocable_r_v<void, ns3::Callback<void, ns3::Ptr<ns3::Packet> >::Callback<void (20,383,935 samples, 2.10%)
std::_Head_base<5ul, std::map<unsigned int, ns3::Ptr<ns3::SpectrumValue>, std::less<unsigned int>, std::allocator<std::pair<unsigned int const, ns3::Ptr<ns3::SpectrumValue> > > >, false>::_Head_base<std::map<unsigned int, ns3::Ptr<ns3::SpectrumValue>, std::less<unsigned int>, std::allocator<std::pair<unsigned int const, ns3::Ptr<ns3::SpectrumValue> > > >&> (318,126 samples, 0.03%)
ns3::DlHarqFeedbackLteControlMessage::GetDlHarqFeedback (1,880,893 samples, 0.19%)
std::_Rb_tree<unsigned int, std::pair<unsigned int const, ns3::TxSpectrumModelInfo>, std::_Select1st<std::pair<unsigned int const, ns3::TxSpectrumModelInfo> >, std::less<unsigned int>, std::allocator<std::pair<unsigned int const, ns3::TxSpectrumModelInfo> > >::_S_key (1,228,544 samples, 0.13%)
std::_Rb_tree<ns3::Scheduler::EventKey, std::pair<ns3::Scheduler::EventKey const, ns3::EventImpl*>, std::_Select1st<std::pair<ns3::Scheduler::EventKey const, ns3::EventImpl*> >, std::less<ns3::Scheduler::EventKey>, std::allocator<std::pair<ns3::Scheduler::EventKey const, ns3::EventImpl*> > >::_M_get_insert_hint_unique_pos (375,672 samples, 0.04%)
std::vector<std::__cxx11::list<ns3::UlDciLteControlMessage, std::allocator<ns3::UlDciLteControlMessage> >, std::allocator<std::__cxx11::list<ns3::UlDciLteControlMessage, std::allocator<ns3::UlDciLteControlMessage> > > >::_M_erase (2,754,625 samples, 0.28%)
ns3::Packet::Packet (2,698,693 samples, 0.28%)
void std::allocator_traits<std::allocator<std::_List_node<ns3::Ptr<ns3::LteControlMessage> > > >::destroy<ns3::Ptr<ns3::LteControlMessage> > (186,011 samples, 0.02%)
std::map<unsigned char, ns3::LteUeMac::LcInfo, std::less<unsigned char>, std::allocator<std::pair<unsigned char const, ns3::LteUeMac::LcInfo> > >::end (285,417 samples, 0.03%)
unsigned char* std::__relocate_a<unsigned char*, unsigned char*, std::allocator<unsigned char> > (306,347 samples, 0.03%)
__gnu_cxx::__aligned_membuf<std::pair<unsigned short const, unsigned int> >::_M_ptr (290,218 samples, 0.03%)
std::allocator<int>::allocate (177,537 samples, 0.02%)
std::_List_node<ns3::Ptr<ns3::LteControlMessage> >* std::__cxx11::list<ns3::Ptr<ns3::LteControlMessage>, std::allocator<ns3::Ptr<ns3::LteControlMessage> > >::_M_create_node<ns3::Ptr<ns3::LteControlMessage> const&> (262,916 samples, 0.03%)
std::set<unsigned short, std::less<unsigned short>, std::allocator<unsigned short> >::set (311,875 samples, 0.03%)
std::_Rb_tree<ns3::TbId_t, std::pair<ns3::TbId_t const, ns3::tbInfo_t>, std::_Select1st<std::pair<ns3::TbId_t const, ns3::tbInfo_t> >, std::less<ns3::TbId_t>, std::allocator<std::pair<ns3::TbId_t const, ns3::tbInfo_t> > >::_Auto_node::_M_insert (436,204 samples, 0.04%)
ns3::SpectrumValue::operator+= (189,127 samples, 0.02%)
ns3::DefaultDeleter<ns3::SpectrumSignalParameters>::Delete (3,444,708 samples, 0.36%)
std::_Rb_tree<unsigned short, std::pair<unsigned short const, std::vector<unsigned short, std::allocator<unsigned short> > >, std::_Select1st<std::pair<unsigned short const, std::vector<unsigned short, std::allocator<unsigned short> > > >, std::less<unsigned short>, std::allocator<std::pair<unsigned short const, std::vector<unsigned short, std::allocator<unsigned short> > > > >::~_Rb_tree (916,115 samples, 0.09%)
__gnu_cxx::__aligned_membuf<std::pair<unsigned short const, std::vector<unsigned char, std::allocator<unsigned char> > > >::_M_ptr (242,288 samples, 0.02%)
std::vector<ns3::HigherLayerSelected_s, std::allocator<ns3::HigherLayerSelected_s> >::vector (327,207 samples, 0.03%)
std::_Tuple_impl<3ul, ns3::Ptr<ns3::SpectrumSignalParameters>, ns3::Ptr<ns3::SpectrumPhy>, std::map<unsigned int, ns3::Ptr<ns3::SpectrumValue>, std::less<unsigned int>, std::allocator<std::pair<unsigned int const, ns3::Ptr<ns3::SpectrumValue> > > > >::_M_head (152,007 samples, 0.02%)
std::vector<ns3::ByteTagListData*, std::allocator<ns3::ByteTagListData*> >::push_back (853,471 samples, 0.09%)
std::_List_const_iterator<ns3::Ptr<ns3::Packet> >::operator++ (223,776 samples, 0.02%)
ns3::BuildRarListElement_s* std::__do_uninit_copy<__gnu_cxx::__normal_iterator<ns3::BuildRarListElement_s const*, std::vector<ns3::BuildRarListElement_s, std::allocator<ns3::BuildRarListElement_s> > >, ns3::BuildRarListElement_s*> (158,059 samples, 0.02%)
__gnu_cxx::__normal_iterator<double*, std::vector<double, std::allocator<double> > >::__normal_iterator (160,148 samples, 0.02%)
std::enable_if<is_member_pointer_v<void (2,347,913 samples, 0.24%)
ns3::ByteTagIterator::Next (735,090 samples, 0.08%)
std::allocator<double>::allocate (525,645 samples, 0.05%)
std::_List_node<ns3::Ptr<ns3::PacketBurst> >::_M_valptr (389,923 samples, 0.04%)
ns3::Object::DoDelete (384,276 samples, 0.04%)
ns3::PfFfMacScheduler::DoSchedDlRlcBufferReq (2,515,374 samples, 0.26%)
ns3::LteEnbPhy::CreateTxPowerSpectralDensity (1,022,169 samples, 0.11%)
std::_Rb_tree<int, std::pair<int const, double>, std::_Select1st<std::pair<int const, double> >, std::less<int>, std::allocator<std::pair<int const, double> > >::find (922,442 samples, 0.10%)
ns3::PfFfMacScheduler::DoSchedDlCqiInfoReq (1,060,666 samples, 0.11%)
std::__cxx11::_List_base<ns3::AttributeConstructionList::Item, std::allocator<ns3::AttributeConstructionList::Item> >::_List_impl::_List_impl (387,766 samples, 0.04%)
double* std::fill_n<double*, unsigned long, double> (362,228 samples, 0.04%)
ns3::MacCeListElement_s* std::__uninitialized_copy<false>::__uninit_copy<std::move_iterator<ns3::MacCeListElement_s*>, ns3::MacCeListElement_s*> (193,178 samples, 0.02%)
ns3::LteChunkProcessor::Start (605,461 samples, 0.06%)
std::vector<unsigned char, std::allocator<unsigned char> >::~vector (287,229 samples, 0.03%)
ns3::Ptr<ns3::LteUeNetDevice>::~Ptr (125,167 samples, 0.01%)
std::__detail::_List_node_header::_List_node_header (210,164 samples, 0.02%)
std::__cxx11::list<ns3::Ptr<ns3::LteControlMessage>, std::allocator<ns3::Ptr<ns3::LteControlMessage> > >::end (395,922 samples, 0.04%)
std::_Rb_tree_iterator<std::pair<unsigned short const, std::vector<unsigned short, std::allocator<unsigned short> > > > std::_Rb_tree<unsigned short, std::pair<unsigned short const, std::vector<unsigned short, std::allocator<unsigned short> > >, std::_Select1st<std::pair<unsigned short const, std::vector<unsigned short, std::allocator<unsigned short> > > >, std::less<unsigned short>, std::allocator<std::pair<unsigned short const, std::vector<unsigned short, std::allocator<unsigned short> > > > >::_M_emplace_hint_unique<std::piecewise_construct_t const&, std::tuple<unsigned short const&>, std::tuple<> > (339,246 samples, 0.03%)
void std::_Destroy<ns3::BuildBroadcastListElement_s*, ns3::BuildBroadcastListElement_s> (197,106 samples, 0.02%)
ns3::Ptr<ns3::LteSpectrumSignalParametersDlCtrlFrame> ns3::Create<ns3::LteSpectrumSignalParametersDlCtrlFrame> (1,801,965 samples, 0.19%)
std::_Rb_tree<int, std::pair<int const, double>, std::_Select1st<std::pair<int const, double> >, std::less<int>, std::allocator<std::pair<int const, double> > >::_Rb_tree (2,374,517 samples, 0.24%)
ns3::Ptr<ns3::LteControlMessage>::operator (151,109 samples, 0.02%)
(451,603 samples, 0.05%)
ns3::LteUeMac::SendReportBufferStatus (15,163,076 samples, 1.56%)
[libc.so.6] (155,299 samples, 0.02%)
unsigned char* std::__copy_move_a1<false, unsigned char const*, unsigned char*> (262,899 samples, 0.03%)
std::_Rb_tree<unsigned short, unsigned short, std::_Identity<unsigned short>, std::less<unsigned short>, std::allocator<unsigned short> >::end (265,370 samples, 0.03%)
ns3::SimpleRefCount<ns3::Object, ns3::ObjectBase, ns3::ObjectDeleter>::GetReferenceCount (270,897 samples, 0.03%)
std::_Bind_helper<std::__or_<std::is_integral<std::decay<void (935,594 samples, 0.10%)
ns3::SimpleRefCount<ns3::Object, ns3::ObjectBase, ns3::ObjectDeleter>::Unref (699,107 samples, 0.07%)
ns3::DlInfoListElement_s::HarqStatus_e* std::__uninitialized_fill_n_a<ns3::DlInfoListElement_s::HarqStatus_e*, unsigned long, ns3::DlInfoListElement_s::HarqStatus_e, ns3::DlInfoListElement_s::HarqStatus_e> (295,111 samples, 0.03%)
ns3::Ptr<ns3::Packet>::operator (196,328 samples, 0.02%)
ns3::DefaultDeleter<ns3::LteControlMessage>::Delete (538,741 samples, 0.06%)
std::vector<std::vector<ns3::HarqProcessInfoElement_t, std::allocator<ns3::HarqProcessInfoElement_t> >, std::allocator<std::vector<ns3::HarqProcessInfoElement_t, std::allocator<ns3::HarqProcessInfoElement_t> > > >::_M_erase (213,559 samples, 0.02%)
ns3::LteRlcSpecificLteMacSapUser::NotifyTxOpportunity (314,249 samples, 0.03%)
ns3::Ptr<ns3::SpectrumSignalParameters>::~Ptr (676,765 samples, 0.07%)
ns3::Ptr<ns3::SpectrumValue const>::Ptr (187,751 samples, 0.02%)
ns3::Packet::GetSize (244,662 samples, 0.03%)
std::__new_allocator<unsigned short>::allocate (360,140 samples, 0.04%)
ns3::DlInfoListElement_s::HarqStatus_e* std::__uninitialized_copy<true>::__uninit_copy<__gnu_cxx::__normal_iterator<ns3::DlInfoListElement_s::HarqStatus_e const*, std::vector<ns3::DlInfoListElement_s::HarqStatus_e, std::allocator<ns3::DlInfoListElement_s::HarqStatus_e> > >, ns3::DlInfoListElement_s::HarqStatus_e*> (234,294 samples, 0.02%)
std::_Vector_base<unsigned int, std::allocator<unsigned int> >::_M_create_storage (336,354 samples, 0.03%)
ns3::Packet::Packet (1,702,514 samples, 0.18%)
std::vector<int, std::allocator<int> >::end (128,840 samples, 0.01%)
std::_Rb_tree_iterator<std::pair<unsigned short const, std::vector<std::vector<ns3::Ptr<ns3::PacketBurst>, std::allocator<ns3::Ptr<ns3::PacketBurst> > >, std::allocator<std::vector<ns3::Ptr<ns3::PacketBurst>, std::allocator<ns3::Ptr<ns3::PacketBurst> > > > > > >::operator* (400,979 samples, 0.04%)
std::map<unsigned short, unsigned int, std::less<unsigned short>, std::allocator<std::pair<unsigned short const, unsigned int> > >::end (232,052 samples, 0.02%)
ns3::TagBuffer::Write (197,148 samples, 0.02%)
std::_Rb_tree_node<std::pair<unsigned short const, std::vector<std::vector<std::vector<ns3::RlcPduListElement_s, std::allocator<ns3::RlcPduListElement_s> >, std::allocator<std::vector<ns3::RlcPduListElement_s, std::allocator<ns3::RlcPduListElement_s> > > >, std::allocator<std::vector<std::vector<ns3::RlcPduListElement_s, std::allocator<ns3::RlcPduListElement_s> >, std::allocator<std::vector<ns3::RlcPduListElement_s, std::allocator<ns3::RlcPduListElement_s> > > > > > > >::_M_valptr (428,286 samples, 0.04%)
std::__cxx11::list<ns3::UlDciLteControlMessage, std::allocator<ns3::UlDciLteControlMessage> >::end (190,575 samples, 0.02%)
ns3::PacketBurst::PacketBurst (2,988,991 samples, 0.31%)
std::vector<std::vector<ns3::RlcPduListElement_s, std::allocator<ns3::RlcPduListElement_s> >, std::allocator<std::vector<ns3::RlcPduListElement_s, std::allocator<ns3::RlcPduListElement_s> > > >::push_back (3,370,357 samples, 0.35%)
ns3::NoOpComponentCarrierManager::DoReportBufferStatus (6,485,597 samples, 0.67%)
ns3::Object::~Object (420,675 samples, 0.04%)
ns3::EventImpl::Invoke (22,443,594 samples, 2.31%)
std::__cxx11::_List_base<ns3::Ptr<ns3::Packet>, std::allocator<ns3::Ptr<ns3::Packet> > >::_M_clear (750,825 samples, 0.08%)
__gnu_cxx::__normal_iterator<std::__cxx11::list<ns3::Ptr<ns3::LteControlMessage>, std::allocator<ns3::Ptr<ns3::LteControlMessage> > > const*, std::vector<std::__cxx11::list<ns3::Ptr<ns3::LteControlMessage>, std::allocator<ns3::Ptr<ns3::LteControlMessage> > >, std::allocator<std::__cxx11::list<ns3::Ptr<ns3::LteControlMessage>, std::allocator<ns3::Ptr<ns3::LteControlMessage> > > > > >::__normal_iterator (195,190 samples, 0.02%)
ns3::ObjectBase::~ObjectBase (196,060 samples, 0.02%)
std::vector<ns3::HarqProcessInfoElement_t, std::allocator<ns3::HarqProcessInfoElement_t> >* std::__copy_move_a2<true, std::vector<ns3::HarqProcessInfoElement_t, std::allocator<ns3::HarqProcessInfoElement_t> >*, std::vector<ns3::HarqProcessInfoElement_t, std::allocator<ns3::HarqProcessInfoElement_t> >*> (2,402,205 samples, 0.25%)
std::_Vector_base<ns3::VendorSpecificListElement_s, std::allocator<ns3::VendorSpecificListElement_s> >::~_Vector_base (431,058 samples, 0.04%)
std::_Rb_tree<unsigned short, std::pair<unsigned short const, std::vector<std::vector<ns3::Ptr<ns3::PacketBurst>, std::allocator<ns3::Ptr<ns3::PacketBurst> > >, std::allocator<std::vector<ns3::Ptr<ns3::PacketBurst>, std::allocator<ns3::Ptr<ns3::PacketBurst> > > > > >, std::_Select1st<std::pair<unsigned short const, std::vector<std::vector<ns3::Ptr<ns3::PacketBurst>, std::allocator<ns3::Ptr<ns3::PacketBurst> > >, std::allocator<std::vector<ns3::Ptr<ns3::PacketBurst>, std::allocator<ns3::Ptr<ns3::PacketBurst> > > > > > >, std::less<unsigned short>, std::allocator<std::pair<unsigned short const, std::vector<std::vector<ns3::Ptr<ns3::PacketBurst>, std::allocator<ns3::Ptr<ns3::PacketBurst> > >, std::allocator<std::vector<ns3::Ptr<ns3::PacketBurst>, std::allocator<ns3::Ptr<ns3::PacketBurst> > > > > > > >::_M_lower_bound (887,310 samples, 0.09%)
ns3::LtePhy::SetControlMessages (2,493,375 samples, 0.26%)
std::_Rb_tree<unsigned int, std::pair<unsigned int const, ns3::Ptr<ns3::SpectrumValue> >, std::_Select1st<std::pair<unsigned int const, ns3::Ptr<ns3::SpectrumValue> > >, std::less<unsigned int>, std::allocator<std::pair<unsigned int const, ns3::Ptr<ns3::SpectrumValue> > > >::_M_get_node (126,498 samples, 0.01%)
bool std::operator==<double const&, double const&, double const&, double const&, double const&, double const&> (2,394,490 samples, 0.25%)
__gnu_cxx::__normal_iterator<ns3::Ptr<ns3::PacketBurst>*, std::vector<ns3::Ptr<ns3::PacketBurst>, std::allocator<ns3::Ptr<ns3::PacketBurst> > > >::__normal_iterator (155,092 samples, 0.02%)
ns3::EventImpl::EventImpl (154,551 samples, 0.02%)
std::pair<std::_Rb_tree_iterator<std::pair<ns3::Scheduler::EventKey const, ns3::EventImpl*> >, bool>::pair (248,699 samples, 0.03%)
std::allocator<double>::deallocate (190,332 samples, 0.02%)
ns3::MakeEvent<void (5,321,712 samples, 0.55%)
std::__cxx11::list<ns3::Ptr<ns3::Packet>, std::allocator<ns3::Ptr<ns3::Packet> > >::~list (322,499 samples, 0.03%)
ns3::LteUeMac::DoReceivePhyPdu (4,367,304 samples, 0.45%)
ns3::Tag::Tag (229,496 samples, 0.02%)
__gnu_cxx::__normal_iterator<ns3::ByteTagListData* const*, std::vector<ns3::ByteTagListData*, std::allocator<ns3::ByteTagListData*> > >::base (196,916 samples, 0.02%)
ns3::EnbMacMemberLteMacSapProvider<ns3::NoOpComponentCarrierManager>::ReportBufferStatus (1,019,985 samples, 0.11%)
std::_Function_handler<void (75,398,758 samples, 7.77%) std::_..
unsigned short* std::__copy_move_a1<false, unsigned short const*, unsigned short*> (200,709 samples, 0.02%)
std::_Rb_tree<unsigned short, std::pair<unsigned short const, ns3::Ptr<ns3::UeManager> >, std::_Select1st<std::pair<unsigned short const, ns3::Ptr<ns3::UeManager> > >, std::less<unsigned short>, std::allocator<std::pair<unsigned short const, ns3::Ptr<ns3::UeManager> > > >::_M_lower_bound (556,603 samples, 0.06%)
ns3::Ptr<ns3::SpectrumPhy>::Ptr (126,253 samples, 0.01%)
std::_Select1st<std::pair<unsigned int const, ns3::TxSpectrumModelInfo> >::operator (168,844 samples, 0.02%)
unsigned short* std::__uninitialized_copy_a<__gnu_cxx::__normal_iterator<unsigned short const*, std::vector<unsigned short, std::allocator<unsigned short> > >, unsigned short*, unsigned short> (658,154 samples, 0.07%)
ns3::Ptr<ns3::PacketBurst> ns3::CompleteConstruct<ns3::PacketBurst> (299,870 samples, 0.03%)
__gnu_cxx::__normal_iterator<double const*, std::vector<double, std::allocator<double> > >::base (126,294 samples, 0.01%)
std::__cxx11::_List_base<ns3::Ptr<ns3::Packet>, std::allocator<ns3::Ptr<ns3::Packet> > >::_List_base (236,451 samples, 0.02%)
ns3::PacketMetadata::Deallocate (318,817 samples, 0.03%)
std::_Rb_tree<unsigned short, std::pair<unsigned short const, ns3::LteEnbComponentCarrierManager::UeInfo>, std::_Select1st<std::pair<unsigned short const, ns3::LteEnbComponentCarrierManager::UeInfo> >, std::less<unsigned short>, std::allocator<std::pair<unsigned short const, ns3::LteEnbComponentCarrierManager::UeInfo> > >::_M_lower_bound (639,618 samples, 0.07%)
ns3::RlcPduListElement_s* std::__uninitialized_copy_a<__gnu_cxx::__normal_iterator<ns3::RlcPduListElement_s const*, std::vector<ns3::RlcPduListElement_s, std::allocator<ns3::RlcPduListElement_s> > >, ns3::RlcPduListElement_s*, ns3::RlcPduListElement_s> (214,687 samples, 0.02%)
ns3::LteInterference::ConditionallyEvaluateChunk (575,348 samples, 0.06%)
ns3::Buffer::Create (1,593,963 samples, 0.16%)
std::_Rb_tree_node<std::pair<unsigned short const, std::vector<double, std::allocator<double> > > >::_M_valptr (328,108 samples, 0.03%)
std::allocator_traits<std::allocator<double> >::allocate (670,068 samples, 0.07%)
ns3::CqiListElement_s::CqiListElement_s (194,571 samples, 0.02%)
ns3::DlInfoListElement_s* std::__uninitialized_copy_a<__gnu_cxx::__normal_iterator<ns3::DlInfoListElement_s const*, std::vector<ns3::DlInfoListElement_s, std::allocator<ns3::DlInfoListElement_s> > >, ns3::DlInfoListElement_s*, ns3::DlInfoListElement_s> (5,104,143 samples, 0.53%)
ns3::SimpleRefCount<ns3::SpectrumModel, ns3::Empty, ns3::DefaultDeleter<ns3::SpectrumModel> >::Unref (233,271 samples, 0.02%)
void std::destroy_at<ns3::Ptr<ns3::Packet> > (521,712 samples, 0.05%)
std::_Vector_base<int, std::allocator<int> >::_Vector_impl::_Vector_impl (379,832 samples, 0.04%)
__dynamic_cast (333,656 samples, 0.03%)
void std::allocator_traits<std::allocator<std::_Rb_tree_node<std::pair<unsigned short const, std::vector<double, std::allocator<double> > > > > >::construct<std::pair<unsigned short const, std::vector<double, std::allocator<double> > >, std::pair<unsigned short const, std::vector<double, std::allocator<double> > > const&> (194,069 samples, 0.02%)
std::_Rb_tree_const_iterator<std::pair<ns3::Scheduler::EventKey const, ns3::EventImpl*> >::_Rb_tree_const_iterator (508,100 samples, 0.05%)
void ns3::Callback<void, ns3::SpectrumValue const&>::Callback<void (324,769 samples, 0.03%)
ns3::Simulator::Now (245,134 samples, 0.03%)
ns3::Packet::Packet (501,720 samples, 0.05%)
ns3::Ptr<ns3::LteControlMessage>::~Ptr (611,218 samples, 0.06%)
ns3::TypeId::TypeId (150,833 samples, 0.02%)
std::vector<ns3::Buffer::Data*, std::allocator<ns3::Buffer::Data*> >::push_back (392,327 samples, 0.04%)
double* std::__uninitialized_default_n<double*, unsigned long> (363,863 samples, 0.04%)
ns3::MapScheduler::Insert (194,393 samples, 0.02%)
double* std::__niter_base<double*, std::vector<double, std::allocator<double> > > (236,463 samples, 0.02%)
std::map<unsigned short, ns3::DlInfoListElement_s, std::less<unsigned short>, std::allocator<std::pair<unsigned short const, ns3::DlInfoListElement_s> > >::end (345,899 samples, 0.04%)
std::_Vector_base<unsigned char, std::allocator<unsigned char> >::_M_create_storage (158,373 samples, 0.02%)
std::_Rb_tree<int, std::pair<int const, double>, std::_Select1st<std::pair<int const, double> >, std::less<int>, std::allocator<std::pair<int const, double> > >::_M_get_insert_unique_pos (339,044 samples, 0.03%)
ns3::SimpleRefCount<ns3::LteControlMessage, ns3::Empty, ns3::DefaultDeleter<ns3::LteControlMessage> >::Unref (538,741 samples, 0.06%)
std::operator== (152,835 samples, 0.02%)
std::_Rb_tree<unsigned short, std::pair<unsigned short const, std::vector<double, std::allocator<double> > >, std::_Select1st<std::pair<unsigned short const, std::vector<double, std::allocator<double> > > >, std::less<unsigned short>, std::allocator<std::pair<unsigned short const, std::vector<double, std::allocator<double> > > > >::_M_destroy_node (595,644 samples, 0.06%)
std::map<unsigned short, std::map<unsigned char, ns3::LteMacSapUser*, std::less<unsigned char>, std::allocator<std::pair<unsigned char const, ns3::LteMacSapUser*> > >, std::less<unsigned short>, std::allocator<std::pair<unsigned short const, std::map<unsigned char, ns3::LteMacSapUser*, std::less<unsigned char>, std::allocator<std::pair<unsigned char const, ns3::LteMacSapUser*> > > > > >::find (2,516,735 samples, 0.26%)
std::pair<std::_Rb_tree_iterator<std::pair<unsigned int const, ns3::Ptr<ns3::SpectrumValue> > >, bool> std::map<unsigned int, ns3::Ptr<ns3::SpectrumValue>, std::less<unsigned int>, std::allocator<std::pair<unsigned int const, ns3::Ptr<ns3::SpectrumValue> > > >::emplace<unsigned int const&, ns3::Ptr<ns3::SpectrumValue>&> (2,393,725 samples, 0.25%)
std::__cxx11::list<ns3::Ptr<ns3::Packet>, std::allocator<ns3::Ptr<ns3::Packet> > >::push_back (686,315 samples, 0.07%)
ns3::Time::ToInteger (191,170 samples, 0.02%)
std::__cxx11::list<ns3::Ptr<ns3::LteControlMessage>, std::allocator<ns3::Ptr<ns3::LteControlMessage> > >::list (1,969,038 samples, 0.20%)
std::_Rb_tree<ns3::LteFlowId_t, std::pair<ns3::LteFlowId_t const, ns3::FfMacSchedSapProvider::SchedDlRlcBufferReqParameters>, std::_Select1st<std::pair<ns3::LteFlowId_t const, ns3::FfMacSchedSapProvider::SchedDlRlcBufferReqParameters> >, std::less<ns3::LteFlowId_t>, std::allocator<std::pair<ns3::LteFlowId_t const, ns3::FfMacSchedSapProvider::SchedDlRlcBufferReqParameters> > >::find (1,508,586 samples, 0.16%)
std::_Rb_tree<ns3::Scheduler::EventKey, std::pair<ns3::Scheduler::EventKey const, ns3::EventImpl*>, std::_Select1st<std::pair<ns3::Scheduler::EventKey const, ns3::EventImpl*> >, std::less<ns3::Scheduler::EventKey>, std::allocator<std::pair<ns3::Scheduler::EventKey const, ns3::EventImpl*> > >::_M_lower_bound (2,003,615 samples, 0.21%)
std::__new_allocator<unsigned char>::allocate (352,577 samples, 0.04%)
ns3::Ptr<ns3::SpectrumValue>::operator (158,925 samples, 0.02%)
ns3::PacketBurst::Copy (1,306,624 samples, 0.13%)
std::vector<ns3::Ptr<ns3::PacketBurst>, std::allocator<ns3::Ptr<ns3::PacketBurst> > >::operator[] (193,866 samples, 0.02%)
ns3::Ptr<ns3::PacketBurst>* std::__copy_move_a2<true, ns3::Ptr<ns3::PacketBurst>*, ns3::Ptr<ns3::PacketBurst>*> (458,200 samples, 0.05%)
std::vector<double, std::allocator<double> >::vector (966,311 samples, 0.10%)
__gnu_cxx::__aligned_membuf<std::pair<ns3::Scheduler::EventKey const, ns3::EventImpl*> >::_M_addr (422,566 samples, 0.04%)
std::_Tuple_impl<4ul, ns3::Ptr<ns3::SpectrumPhy>, std::map<unsigned int, ns3::Ptr<ns3::SpectrumValue>, std::less<unsigned int>, std::allocator<std::pair<unsigned int const, ns3::Ptr<ns3::SpectrumValue> > > > >::_Tuple_impl<ns3::Ptr<ns3::SpectrumPhy>&, std::map<unsigned int, ns3::Ptr<ns3::SpectrumValue>, std::less<unsigned int>, std::allocator<std::pair<unsigned int const, ns3::Ptr<ns3::SpectrumValue> > > >&, void> (163,911 samples, 0.02%)
std::__detail::_List_node_header::_List_node_header (159,922 samples, 0.02%)
std::_Tuple_impl<2ul, double, ns3::Ptr<ns3::SpectrumSignalParameters>, ns3::Ptr<ns3::SpectrumPhy>, std::map<unsigned int, ns3::Ptr<ns3::SpectrumValue>, std::less<unsigned int>, std::allocator<std::pair<unsigned int const, ns3::Ptr<ns3::SpectrumValue> > > > >::_Tuple_impl (380,058 samples, 0.04%)
ns3::Ptr<ns3::AntennaModel>::operator= (192,452 samples, 0.02%)
ns3::FfMacSchedSapUser::SchedDlConfigIndParameters::~SchedDlConfigIndParameters (157,347 samples, 0.02%)
std::_List_iterator<ns3::Ptr<ns3::Packet> >::_List_iterator (165,665 samples, 0.02%)
std::_Rb_tree_iterator<std::pair<unsigned short const, std::vector<std::vector<ns3::HarqProcessInfoElement_t, std::allocator<ns3::HarqProcessInfoElement_t> >, std::allocator<std::vector<ns3::HarqProcessInfoElement_t, std::allocator<ns3::HarqProcessInfoElement_t> > > > > >::operator* (614,873 samples, 0.06%)
ns3::PacketBurst::~PacketBurst (410,769 samples, 0.04%)
void std::_Function_base::_Base_manager<std::_Bind<void (1,218,895 samples, 0.13%)
std::_Rb_tree_node<std::pair<unsigned int const, ns3::Ptr<ns3::SpectrumValue> > >* std::_Rb_tree<unsigned int, std::pair<unsigned int const, ns3::Ptr<ns3::SpectrumValue> >, std::_Select1st<std::pair<unsigned int const, ns3::Ptr<ns3::SpectrumValue> > >, std::less<unsigned int>, std::allocator<std::pair<unsigned int const, ns3::Ptr<ns3::SpectrumValue> > > >::_M_copy<false, std::_Rb_tree<unsigned int, std::pair<unsigned int const, ns3::Ptr<ns3::SpectrumValue> >, std::_Select1st<std::pair<unsigned int const, ns3::Ptr<ns3::SpectrumValue> > >, std::less<unsigned int>, std::allocator<std::pair<unsigned int const, ns3::Ptr<ns3::SpectrumValue> > > >::_Alloc_node> (494,088 samples, 0.05%)
unsigned char* std::__niter_base<unsigned char*> (151,102 samples, 0.02%)
std::vector<ns3::RlcPduListElement_s, std::allocator<ns3::RlcPduListElement_s> >::_M_check_len (197,154 samples, 0.02%)
ns3::LteMiErrorModel::GetPcfichPdcchError (1,017,990 samples, 0.10%)
ns3::LteSpectrumPhy::GetDevice (278,749 samples, 0.03%)
unsigned char const* std::__niter_base<unsigned char const*, std::vector<unsigned char, std::allocator<unsigned char> > > (262,111 samples, 0.03%)
ns3::Ptr<ns3::SpectrumValue>::operator= (388,127 samples, 0.04%)
std::vector<unsigned char, std::allocator<unsigned char> >::max_size (240,471 samples, 0.02%)
__gnu_cxx::__normal_iterator<ns3::CqiListElement_s*, std::vector<ns3::CqiListElement_s, std::allocator<ns3::CqiListElement_s> > > std::vector<ns3::CqiListElement_s, std::allocator<ns3::CqiListElement_s> >::insert<__gnu_cxx::__normal_iterator<ns3::CqiListElement_s*, std::vector<ns3::CqiListElement_s, std::allocator<ns3::CqiListElement_s> > >, void> (5,119,434 samples, 0.53%)
ns3::UlInfoListElement_s::UlInfoListElement_s (208,096 samples, 0.02%)
ns3::Callback<void, ns3::SpectrumValue const&>::DoPeekImpl (161,751 samples, 0.02%)
ns3::Ptr<ns3::PacketBurst>::~Ptr (274,415 samples, 0.03%)
std::_Rb_tree<unsigned short, unsigned short, std::_Identity<unsigned short>, std::less<unsigned short>, std::allocator<unsigned short> >::~_Rb_tree (141,564 samples, 0.01%)
atan2f32x (314,439 samples, 0.03%)
std::vector<unsigned char, std::allocator<unsigned char> >::operator= (148,008 samples, 0.02%)
std::_Vector_base<int, std::allocator<int> >::_Vector_impl::_Vector_impl (206,232 samples, 0.02%)
double* std::__uninitialized_default_n_1<true>::__uninit_default_n<double*, unsigned long> (281,908 samples, 0.03%)
std::vector<int, std::allocator<int> >::vector (198,351 samples, 0.02%)
ns3::UlDciListElement_s* std::uninitialized_copy<__gnu_cxx::__normal_iterator<ns3::UlDciListElement_s const*, std::vector<ns3::UlDciListElement_s, std::allocator<ns3::UlDciListElement_s> > >, ns3::UlDciListElement_s*> (160,843 samples, 0.02%)
void std::_Function_base::_Base_manager<std::_Bind<void (1,831,024 samples, 0.19%)
std::_Rb_tree_iterator<std::pair<unsigned char const, ns3::LteUeMac::LcInfo> >::operator++ (126,827 samples, 0.01%)
__gnu_cxx::__normal_iterator<ns3::Ptr<ns3::PacketBurst> const*, std::vector<ns3::Ptr<ns3::PacketBurst>, std::allocator<ns3::Ptr<ns3::PacketBurst> > > >::__normal_iterator (271,510 samples, 0.03%)
std::_Rb_tree<unsigned int, std::pair<unsigned int const, ns3::Ptr<ns3::SpectrumValue> >, std::_Select1st<std::pair<unsigned int const, ns3::Ptr<ns3::SpectrumValue> > >, std::less<unsigned int>, std::allocator<std::pair<unsigned int const, ns3::Ptr<ns3::SpectrumValue> > > >::lower_bound (163,786 samples, 0.02%)
std::_Bind<void (1,570,544 samples, 0.16%)
double* std::__uninitialized_default_n_a<double*, unsigned long, double> (605,341 samples, 0.06%)
ns3::VendorSpecificListElement_s* std::__uninitialized_copy_a<__gnu_cxx::__normal_iterator<ns3::VendorSpecificListElement_s const*, std::vector<ns3::VendorSpecificListElement_s, std::allocator<ns3::VendorSpecificListElement_s> > >, ns3::VendorSpecificListElement_s*, ns3::VendorSpecificListElement_s> (425,833 samples, 0.04%)
ns3::Simulator::Now (316,257 samples, 0.03%)
std::enable_if<std::is_constructible<std::pair<ns3::TbId_t const, ns3::tbInfo_t>, std::pair<ns3::TbId_t, ns3::tbInfo_t> >::value, std::pair<std::_Rb_tree_iterator<std::pair<ns3::TbId_t const, ns3::tbInfo_t> >, bool> >::type std::map<ns3::TbId_t, ns3::tbInfo_t, std::less<ns3::TbId_t>, std::allocator<std::pair<ns3::TbId_t const, ns3::tbInfo_t> > >::insert<std::pair<ns3::TbId_t, ns3::tbInfo_t> > (3,302,857 samples, 0.34%)
std::vector<unsigned short, std::allocator<unsigned short> >::size (149,208 samples, 0.02%)
ns3::DlInfoListElement_s* std::__do_uninit_copy<ns3::DlInfoListElement_s*, ns3::DlInfoListElement_s*> (508,420 samples, 0.05%)
ns3::SimpleRefCount<ns3::Object, ns3::ObjectBase, ns3::ObjectDeleter>::Unref (1,796,083 samples, 0.19%)
std::map<unsigned short, std::vector<std::vector<std::vector<ns3::RlcPduListElement_s, std::allocator<ns3::RlcPduListElement_s> >, std::allocator<std::vector<ns3::RlcPduListElement_s, std::allocator<ns3::RlcPduListElement_s> > > >, std::allocator<std::vector<std::vector<ns3::RlcPduListElement_s, std::allocator<ns3::RlcPduListElement_s> >, std::allocator<std::vector<ns3::RlcPduListElement_s, std::allocator<ns3::RlcPduListElement_s> > > > > >, std::less<unsigned short>, std::allocator<std::pair<unsigned short const, std::vector<std::vector<std::vector<ns3::RlcPduListElement_s, std::allocator<ns3::RlcPduListElement_s> >, std::allocator<std::vector<ns3::RlcPduListElement_s, std::allocator<ns3::RlcPduListElement_s> > > >, std::allocator<std::vector<std::vector<ns3::RlcPduListElement_s, std::allocator<ns3::RlcPduListElement_s> >, std::allocator<std::vector<ns3::RlcPduListElement_s, std::allocator<ns3::RlcPduListElement_s> > > > > > > > >::find (151,942 samples, 0.02%)
std::__cxx11::list<ns3::Ptr<ns3::LteControlMessage>, std::allocator<ns3::Ptr<ns3::LteControlMessage> > >::splice (375,324 samples, 0.04%)
ns3::MakeEvent<void (331,747 samples, 0.03%)
std::allocator<double>::deallocate (124,900 samples, 0.01%)
cfree (218,014 samples, 0.02%)
void std::allocator_traits<std::allocator<ns3::Ptr<ns3::PacketBurst> > >::construct<ns3::Ptr<ns3::PacketBurst>, ns3::Ptr<ns3::PacketBurst> > (273,884 samples, 0.03%)
void std::_Destroy<ns3::VendorSpecificListElement_s*> (198,417 samples, 0.02%)
std::vector<ns3::BuildDataListElement_s, std::allocator<ns3::BuildDataListElement_s> >::push_back (306,330 samples, 0.03%)
__gnu_cxx::__normal_iterator<ns3::DlInfoListElement_s*, std::vector<ns3::DlInfoListElement_s, std::allocator<ns3::DlInfoListElement_s> > > std::copy<__gnu_cxx::__normal_iterator<ns3::DlInfoListElement_s const*, std::vector<ns3::DlInfoListElement_s, std::allocator<ns3::DlInfoListElement_s> > >, __gnu_cxx::__normal_iterator<ns3::DlInfoListElement_s*, std::vector<ns3::DlInfoListElement_s, std::allocator<ns3::DlInfoListElement_s> > > > (331,514 samples, 0.03%)
ns3::SpectrumValue::GetSpectrumModel (154,473 samples, 0.02%)
ns3::Ptr<ns3::Packet>::~Ptr (162,262 samples, 0.02%)
std::vector<ns3::VendorSpecificListElement_s, std::allocator<ns3::VendorSpecificListElement_s> >::operator= (416,467 samples, 0.04%)
std::_Rb_tree_iterator<std::pair<unsigned int const, ns3::Ptr<ns3::SpectrumValue> > > std::_Rb_tree<unsigned int, std::pair<unsigned int const, ns3::Ptr<ns3::SpectrumValue> >, std::_Select1st<std::pair<unsigned int const, ns3::Ptr<ns3::SpectrumValue> > >, std::less<unsigned int>, std::allocator<std::pair<unsigned int const, ns3::Ptr<ns3::SpectrumValue> > > >::_M_emplace_hint_unique<unsigned int const&, ns3::Ptr<ns3::SpectrumValue>&> (1,489,049 samples, 0.15%)
void std::allocator_traits<std::allocator<std::__cxx11::list<ns3::UlDciLteControlMessage, std::allocator<ns3::UlDciLteControlMessage> > > >::destroy<std::__cxx11::list<ns3::UlDciLteControlMessage, std::allocator<ns3::UlDciLteControlMessage> > > (274,522 samples, 0.03%)
std::__cxx11::list<ns3::Ptr<ns3::LteControlMessage>, std::allocator<ns3::Ptr<ns3::LteControlMessage> > >::operator= (485,199 samples, 0.05%)
double* std::__copy_move_a1<false, double const*, double*> (169,338 samples, 0.02%)
ns3::UeSelected_s::operator= (384,654 samples, 0.04%)
std::__detail::_List_node_header::_List_node_header (156,589 samples, 0.02%)
std::_Vector_base<ns3::HarqProcessInfoElement_t, std::allocator<ns3::HarqProcessInfoElement_t> >::_Vector_impl::_Vector_impl (303,807 samples, 0.03%)
std::vector<ns3::DlInfoListElement_s, std::allocator<ns3::DlInfoListElement_s> >::push_back (303,575 samples, 0.03%)
std::_Bit_iterator::operator* (161,884 samples, 0.02%)
std::tuple_element<0ul, std::tuple<unsigned short const&> >::type& std::get<0ul, unsigned short const&> (313,540 samples, 0.03%)
std::tuple<> std::forward_as_tuple<> (471,585 samples, 0.05%)
ns3::Packet::~Packet (351,823 samples, 0.04%)
std::_Rb_tree<unsigned char, std::pair<unsigned char const, ns3::LteCcmMacSapProvider*>, std::_Select1st<std::pair<unsigned char const, ns3::LteCcmMacSapProvider*> >, std::less<unsigned char>, std::allocator<std::pair<unsigned char const, ns3::LteCcmMacSapProvider*> > >::_M_begin (163,406 samples, 0.02%)
ns3::DlInfoListElement_s::~DlInfoListElement_s (617,189 samples, 0.06%)
std::map<unsigned short, ns3::LteEnbComponentCarrierManager::UeInfo, std::less<unsigned short>, std::allocator<std::pair<unsigned short const, ns3::LteEnbComponentCarrierManager::UeInfo> > >::lower_bound (191,851 samples, 0.02%)
std::vector<ns3::DlInfoListElement_s::HarqStatus_e, std::allocator<ns3::DlInfoListElement_s::HarqStatus_e> >::vector (411,592 samples, 0.04%)
std::vector<ns3::PacketMetadata::Data*, std::allocator<ns3::PacketMetadata::Data*> >::end (150,854 samples, 0.02%)
ns3::DefaultDeleter<ns3::Packet>::Delete (351,823 samples, 0.04%)
void std::_Destroy<std::vector<ns3::RlcPduListElement_s, std::allocator<ns3::RlcPduListElement_s> >*, std::vector<ns3::RlcPduListElement_s, std::allocator<ns3::RlcPduListElement_s> > > (229,070 samples, 0.02%)
ns3::MacCeListElement_s* std::__do_uninit_copy<__gnu_cxx::__normal_iterator<ns3::MacCeListElement_s*, std::vector<ns3::MacCeListElement_s, std::allocator<ns3::MacCeListElement_s> > >, ns3::MacCeListElement_s*> (806,979 samples, 0.08%)
ns3::LogComponent::IsEnabled (242,975 samples, 0.03%)
ns3::LogComponent::IsEnabled (163,744 samples, 0.02%)
ns3::DlInfoListElement_s::HarqStatus_e* std::uninitialized_copy<__gnu_cxx::__normal_iterator<ns3::DlInfoListElement_s::HarqStatus_e const*, std::vector<ns3::DlInfoListElement_s::HarqStatus_e, std::allocator<ns3::DlInfoListElement_s::HarqStatus_e> > >, ns3::DlInfoListElement_s::HarqStatus_e*> (683,830 samples, 0.07%)
std::_Function_base::_M_empty (129,184 samples, 0.01%)
std::_Rb_tree<int, std::pair<int const, double>, std::_Select1st<std::pair<int const, double> >, std::less<int>, std::allocator<std::pair<int const, double> > >::_M_get_insert_hint_unique_pos (534,094 samples, 0.06%)
std::_Rb_tree<unsigned int, std::pair<unsigned int const, ns3::Ptr<ns3::SpectrumValue> >, std::_Select1st<std::pair<unsigned int const, ns3::Ptr<ns3::SpectrumValue> > >, std::less<unsigned int>, std::allocator<std::pair<unsigned int const, ns3::Ptr<ns3::SpectrumValue> > > >::_Rb_tree (186,374 samples, 0.02%)
ns3::TypeId::TypeId (373,826 samples, 0.04%)
std::vector<int, std::allocator<int> >::size (205,426 samples, 0.02%)
unsigned short* std::__copy_move_a<false, __gnu_cxx::__normal_iterator<unsigned short const*, std::vector<unsigned short, std::allocator<unsigned short> > >, unsigned short*> (422,036 samples, 0.04%)
ns3::Vector3D::GetLength (155,917 samples, 0.02%)
ns3::Callback<void, std::__cxx11::list<ns3::Ptr<ns3::LteControlMessage>, std::allocator<ns3::Ptr<ns3::LteControlMessage> > > >::Callback<void (245,024 samples, 0.03%)
ns3::DlInfoListElement_s* std::__uninitialized_copy<false>::__uninit_copy<ns3::DlInfoListElement_s*, ns3::DlInfoListElement_s*> (550,039 samples, 0.06%)
unsigned char* std::__copy_move_a<false, __gnu_cxx::__normal_iterator<unsigned char const*, std::vector<unsigned char, std::allocator<unsigned char> > >, unsigned char*> (650,532 samples, 0.07%)
std::map<unsigned short, std::vector<unsigned char, std::allocator<unsigned char> >, std::less<unsigned short>, std::allocator<std::pair<unsigned short const, std::vector<unsigned char, std::allocator<unsigned char> > > > >::find (1,085,935 samples, 0.11%)
unsigned char* std::__relocate_a<unsigned char*, unsigned char*, std::allocator<unsigned char> > (343,086 samples, 0.04%)
std::allocator<unsigned char>::deallocate (197,176 samples, 0.02%)
decltype (292,231 samples, 0.03%)
ns3::Buffer::Data* const& std::forward<ns3::Buffer::Data* const&> (259,311 samples, 0.03%)
ns3::operator+ (628,145 samples, 0.06%)
std::tuple<ns3::LteSpectrumPhy*>::tuple<ns3::LteSpectrumPhy*&, true, true> (668,783 samples, 0.07%)
std::_Vector_base<ns3::PhichListElement_s, std::allocator<ns3::PhichListElement_s> >::_Vector_base (266,878 samples, 0.03%)
std::_Rb_tree<unsigned short, std::pair<unsigned short const, std::vector<ns3::DlDciListElement_s, std::allocator<ns3::DlDciListElement_s> > >, std::_Select1st<std::pair<unsigned short const, std::vector<ns3::DlDciListElement_s, std::allocator<ns3::DlDciListElement_s> > > >, std::less<unsigned short>, std::allocator<std::pair<unsigned short const, std::vector<ns3::DlDciListElement_s, std::allocator<ns3::DlDciListElement_s> > > > >::_M_begin (235,637 samples, 0.02%)
void std::_Bind<void (2,105,662 samples, 0.22%)
ns3::TimeStep (156,551 samples, 0.02%)
ns3::DlInfoListElement_s* std::__uninitialized_copy<false>::__uninit_copy<__gnu_cxx::__normal_iterator<ns3::DlInfoListElement_s const*, std::vector<ns3::DlInfoListElement_s, std::allocator<ns3::DlInfoListElement_s> > >, ns3::DlInfoListElement_s*> (411,592 samples, 0.04%)
std::__cxx11::list<ns3::UlDciLteControlMessage, std::allocator<ns3::UlDciLteControlMessage> >::empty (264,685 samples, 0.03%)
std::_Rb_tree<ns3::Scheduler::EventKey, std::pair<ns3::Scheduler::EventKey const, ns3::EventImpl*>, std::_Select1st<std::pair<ns3::Scheduler::EventKey const, ns3::EventImpl*> >, std::less<ns3::Scheduler::EventKey>, std::allocator<std::pair<ns3::Scheduler::EventKey const, ns3::EventImpl*> > >::_M_insert_node (433,572 samples, 0.04%)
double* std::__uninitialized_default_n_a<double*, unsigned long, double> (197,197 samples, 0.02%)
void (323,953 samples, 0.03%)
std::vector<ns3::CqiListElement_s, std::allocator<ns3::CqiListElement_s> >::~vector (264,107 samples, 0.03%)
std::__detail::_List_node_header::_List_node_header (193,791 samples, 0.02%)
std::_Tuple_impl<0ul, ns3::LteInterference*, ns3::Ptr<ns3::SpectrumValue const>, unsigned int>::_M_head (204,189 samples, 0.02%)
std::vector<ns3::BuildDataListElement_s, std::allocator<ns3::BuildDataListElement_s> >::vector (422,512 samples, 0.04%)
std::vector<ns3::VendorSpecificListElement_s, std::allocator<ns3::VendorSpecificListElement_s> >::vector (159,784 samples, 0.02%)
__gnu_cxx::__normal_iterator<int*, std::vector<int, std::allocator<int> > > std::__niter_wrap<__gnu_cxx::__normal_iterator<int*, std::vector<int, std::allocator<int> > >, int*> (302,486 samples, 0.03%)
ns3::Ptr<ns3::NixVector>::Ptr (640,714 samples, 0.07%)
std::_Rb_tree<ns3::TbId_t, std::pair<ns3::TbId_t const, ns3::tbInfo_t>, std::_Select1st<std::pair<ns3::TbId_t const, ns3::tbInfo_t> >, std::less<ns3::TbId_t>, std::allocator<std::pair<ns3::TbId_t const, ns3::tbInfo_t> > >::_M_mbegin (247,566 samples, 0.03%)
ns3::DlCqiLteControlMessage::DlCqiLteControlMessage (999,999 samples, 0.10%)
std::_Vector_base<ns3::HarqProcessInfoElement_t, std::allocator<ns3::HarqProcessInfoElement_t> >::~_Vector_base (343,953 samples, 0.04%)
std::_Vector_base<ns3::VendorSpecificListElement_s, std::allocator<ns3::VendorSpecificListElement_s> >::_Vector_base (157,554 samples, 0.02%)
std::vector<ns3::Ptr<ns3::Object>, std::allocator<ns3::Ptr<ns3::Object> > >::vector (124,541 samples, 0.01%)
ns3::Ptr<ns3::NixVector>::Ptr (185,459 samples, 0.02%)
std::pair<unsigned short const, std::vector<unsigned short, std::allocator<unsigned short> > >::pair<unsigned short const&, 0ul> (537,895 samples, 0.06%)
unsigned char* std::copy<__gnu_cxx::__normal_iterator<unsigned char const*, std::vector<unsigned char, std::allocator<unsigned char> > >, unsigned char*> (650,532 samples, 0.07%)
void std::vector<int, std::allocator<int> >::_M_realloc_insert<int const&> (226,433 samples, 0.02%)
std::__cxx11::list<ns3::LteUePhy::PssElement, std::allocator<ns3::LteUePhy::PssElement> >::push_back (194,530 samples, 0.02%)
__dynamic_cast (124,834 samples, 0.01%)
std::_Rb_tree<ns3::Scheduler::EventKey, std::pair<ns3::Scheduler::EventKey const, ns3::EventImpl*>, std::_Select1st<std::pair<ns3::Scheduler::EventKey const, ns3::EventImpl*> >, std::less<ns3::Scheduler::EventKey>, std::allocator<std::pair<ns3::Scheduler::EventKey const, ns3::EventImpl*> > >::begin (899,872 samples, 0.09%)
void std::_Destroy<int*> (265,597 samples, 0.03%)
std::vector<int, std::allocator<int> >::vector (240,017 samples, 0.02%)
std::_Function_base::_Base_manager<std::_Bind<void (1,751,702 samples, 0.18%)
std::_Rb_tree<int, std::pair<int const, double>, std::_Select1st<std::pair<int const, double> >, std::less<int>, std::allocator<std::pair<int const, double> > >::_M_drop_node (312,339 samples, 0.03%)
ns3::LogComponent::IsEnabled (160,104 samples, 0.02%)
unsigned char* std::__uninitialized_copy_a<__gnu_cxx::__normal_iterator<unsigned char const*, std::vector<unsigned char, std::allocator<unsigned char> > >, unsigned char*, unsigned char> (407,753 samples, 0.04%)
ns3::VendorSpecificListElement_s* std::__copy_move_a2<false, ns3::VendorSpecificListElement_s const*, ns3::VendorSpecificListElement_s*> (143,131 samples, 0.01%)
std::_Rb_tree<int, std::pair<int const, double>, std::_Select1st<std::pair<int const, double> >, std::less<int>, std::allocator<std::pair<int const, double> > >::_M_destroy_node (269,825 samples, 0.03%)
std::map<unsigned int, ns3::Ptr<ns3::SpectrumValue>, std::less<unsigned int>, std::allocator<std::pair<unsigned int const, ns3::Ptr<ns3::SpectrumValue> > > >& std::__get_helper<5ul, std::map<unsigned int, ns3::Ptr<ns3::SpectrumValue>, std::less<unsigned int>, std::allocator<std::pair<unsigned int const, ns3::Ptr<ns3::SpectrumValue> > > >> (584,178 samples, 0.06%)
std::_Head_base<0ul, ns3::LteSpectrumPhy*, false>::_Head_base<ns3::LteSpectrumPhy*&> (270,257 samples, 0.03%)
ns3::Ptr<ns3::DlDciLteControlMessage>::Ptr (124,599 samples, 0.01%)
ns3::Packet::GetSize (227,004 samples, 0.02%)
std::__cxx11::list<ns3::RarLteControlMessage::Rar, std::allocator<ns3::RarLteControlMessage::Rar> >::list (154,430 samples, 0.02%)
ns3::LteEnbPhy::StartSubFrame (38,051,595 samples, 3.92%) ns..
std::vector<ns3::Ptr<ns3::PacketBurst>, std::allocator<ns3::Ptr<ns3::PacketBurst> > >::_M_erase (7,179,158 samples, 0.74%)
unsigned short* std::vector<unsigned short, std::allocator<unsigned short> >::_M_allocate_and_copy<__gnu_cxx::__normal_iterator<unsigned short const*, std::vector<unsigned short, std::allocator<unsigned short> > > > (142,016 samples, 0.01%)
decltype (184,474 samples, 0.02%)
std::_Rb_tree_node<std::pair<unsigned short const, unsigned int> >::_M_valptr (290,218 samples, 0.03%)
std::tuple<ns3::LteEnbPhy*, ns3::Ptr<ns3::PacketBurst> >::~tuple (153,418 samples, 0.02%)
std::vector<ns3::Ptr<ns3::PacketBurst>, std::allocator<ns3::Ptr<ns3::PacketBurst> > >::operator[] (154,833 samples, 0.02%)
std::__cxx11::list<ns3::Ptr<ns3::LteControlMessage>, std::allocator<ns3::Ptr<ns3::LteControlMessage> > >::end (162,410 samples, 0.02%)
__gnu_cxx::__aligned_membuf<std::pair<unsigned short const, std::vector<unsigned short, std::allocator<unsigned short> > > >::_M_ptr (148,167 samples, 0.02%)
ns3::Node::GetId (152,268 samples, 0.02%)
std::__cxx11::_List_base<ns3::Ptr<ns3::LteControlMessage>, std::allocator<ns3::Ptr<ns3::LteControlMessage> > >::_M_get_node (164,168 samples, 0.02%)
void std::vector<ns3::MacCeListElement_s, std::allocator<ns3::MacCeListElement_s> >::_M_range_insert<__gnu_cxx::__normal_iterator<ns3::MacCeListElement_s*, std::vector<ns3::MacCeListElement_s, std::allocator<ns3::MacCeListElement_s> > > > (192,569 samples, 0.02%)
std::_Rb_tree<unsigned short, unsigned short, std::_Identity<unsigned short>, std::less<unsigned short>, std::allocator<unsigned short> >::end (202,904 samples, 0.02%)
ns3::HarqProcessInfoElement_t* std::__copy_move_a<false, __gnu_cxx::__normal_iterator<ns3::HarqProcessInfoElement_t const*, std::vector<ns3::HarqProcessInfoElement_t, std::allocator<ns3::HarqProcessInfoElement_t> > >, ns3::HarqProcessInfoElement_t*> (249,391 samples, 0.03%)
std::map<unsigned int, ns3::Ptr<ns3::SpectrumValue>, std::less<unsigned int>, std::allocator<std::pair<unsigned int const, ns3::Ptr<ns3::SpectrumValue> > > >& std::_Mu<std::map<unsigned int, ns3::Ptr<ns3::SpectrumValue>, std::less<unsigned int>, std::allocator<std::pair<unsigned int const, ns3::Ptr<ns3::SpectrumValue> > > >, false, false>::operator (246,808 samples, 0.03%)
ns3::SpectrumSignalParameters::SpectrumSignalParameters (1,366,858 samples, 0.14%)
unsigned long* std::__copy_move_a<false, unsigned long*, unsigned long*> (459,509 samples, 0.05%)
ns3::int64x64_t::Umul (203,418 samples, 0.02%)
std::allocator<std::_Rb_tree_node<std::pair<unsigned short const, std::vector<double, std::allocator<double> > > > >::allocate (474,197 samples, 0.05%)
ns3::Ptr<ns3::EventImpl>::Ptr (1,193,687 samples, 0.12%)
ns3::TracedCallback<ns3::Ptr<ns3::MobilityModel const>, ns3::Ptr<ns3::MobilityModel const>, double, double, double, double>::operator (360,752 samples, 0.04%)
std::__cxx11::_List_base<ns3::Ptr<ns3::LteControlMessage>, std::allocator<ns3::Ptr<ns3::LteControlMessage> > >::_M_clear (778,661 samples, 0.08%)
std::_Rb_tree_node<std::pair<unsigned short const, unsigned char> >::_M_valptr (264,202 samples, 0.03%)
ns3::MakeEvent<void (1,515,135 samples, 0.16%)
int* std::__copy_move_a1<false, int const*, int*> (237,769 samples, 0.02%)
ns3::Ptr<ns3::SpectrumValue const>::Ptr (512,963 samples, 0.05%)
std::_Rb_tree<unsigned short, std::pair<unsigned short const, std::vector<std::vector<ns3::HarqProcessInfoElement_t, std::allocator<ns3::HarqProcessInfoElement_t> >, std::allocator<std::vector<ns3::HarqProcessInfoElement_t, std::allocator<ns3::HarqProcessInfoElement_t> > > > >, std::_Select1st<std::pair<unsigned short const, std::vector<std::vector<ns3::HarqProcessInfoElement_t, std::allocator<ns3::HarqProcessInfoElement_t> >, std::allocator<std::vector<ns3::HarqProcessInfoElement_t, std::allocator<ns3::HarqProcessInfoElement_t> > > > > >, std::less<unsigned short>, std::allocator<std::pair<unsigned short const, std::vector<std::vector<ns3::HarqProcessInfoElement_t, std::allocator<ns3::HarqProcessInfoElement_t> >, std::allocator<std::vector<ns3::HarqProcessInfoElement_t, std::allocator<ns3::HarqProcessInfoElement_t> > > > > > >::_M_begin (516,673 samples, 0.05%)
std::_Rb_tree<unsigned char, std::pair<unsigned char const, ns3::LteMacSapUser*>, std::_Select1st<std::pair<unsigned char const, ns3::LteMacSapUser*> >, std::less<unsigned char>, std::allocator<std::pair<unsigned char const, ns3::LteMacSapUser*> > >::_S_key (163,137 samples, 0.02%)
void std::allocator_traits<std::allocator<std::_List_node<ns3::UlDciLteControlMessage> > >::construct<ns3::UlDciLteControlMessage, ns3::UlDciLteControlMessage const&> (468,430 samples, 0.05%)
std::vector<unsigned short, std::allocator<unsigned short> >::vector (284,703 samples, 0.03%)
std::enable_if<is_member_pointer_v<void (221,466 samples, 0.02%)
std::set<unsigned short, std::less<unsigned short>, std::allocator<unsigned short> >::~set (141,564 samples, 0.01%)
ns3::UniformRandomVariable::GetValue (968,608 samples, 0.10%)
std::_Rb_tree<unsigned short, std::pair<unsigned short const, std::vector<std::vector<ns3::HarqProcessInfoElement_t, std::allocator<ns3::HarqProcessInfoElement_t> >, std::allocator<std::vector<ns3::HarqProcessInfoElement_t, std::allocator<ns3::HarqProcessInfoElement_t> > > > >, std::_Select1st<std::pair<unsigned short const, std::vector<std::vector<ns3::HarqProcessInfoElement_t, std::allocator<ns3::HarqProcessInfoElement_t> >, std::allocator<std::vector<ns3::HarqProcessInfoElement_t, std::allocator<ns3::HarqProcessInfoElement_t> > > > > >, std::less<unsigned short>, std::allocator<std::pair<unsigned short const, std::vector<std::vector<ns3::HarqProcessInfoElement_t, std::allocator<ns3::HarqProcessInfoElement_t> >, std::allocator<std::vector<ns3::HarqProcessInfoElement_t, std::allocator<ns3::HarqProcessInfoElement_t> > > > > > >::_M_end (165,287 samples, 0.02%)
std::_Rb_tree<unsigned char, std::pair<unsigned char const, ns3::LteCcmMacSapProvider*>, std::_Select1st<std::pair<unsigned char const, ns3::LteCcmMacSapProvider*> >, std::less<unsigned char>, std::allocator<std::pair<unsigned char const, ns3::LteCcmMacSapProvider*> > >::find (1,417,571 samples, 0.15%)
ns3::LteEnbPhy*& std::_Mu<ns3::LteEnbPhy*, false, false>::operator (495,567 samples, 0.05%)
ns3::NoOpComponentCarrierManager::DoNotifyTxOpportunity (314,249 samples, 0.03%)
std::_Rb_tree_iterator<std::pair<unsigned short const, std::vector<std::vector<ns3::HarqProcessInfoElement_t, std::allocator<ns3::HarqProcessInfoElement_t> >, std::allocator<std::vector<ns3::HarqProcessInfoElement_t, std::allocator<ns3::HarqProcessInfoElement_t> > > > > >::operator* (287,801 samples, 0.03%)
ns3::HigherLayerSelected_s* std::__do_uninit_copy<__gnu_cxx::__normal_iterator<ns3::HigherLayerSelected_s const*, std::vector<ns3::HigherLayerSelected_s, std::allocator<ns3::HigherLayerSelected_s> > >, ns3::HigherLayerSelected_s*> (356,634 samples, 0.04%)
ns3::SimpleRefCount<ns3::SpectrumValue, ns3::Empty, ns3::DefaultDeleter<ns3::SpectrumValue> >::Unref (196,986 samples, 0.02%)
std::_Rb_tree<ns3::Scheduler::EventKey, std::pair<ns3::Scheduler::EventKey const, ns3::EventImpl*>, std::_Select1st<std::pair<ns3::Scheduler::EventKey const, ns3::EventImpl*> >, std::less<ns3::Scheduler::EventKey>, std::allocator<std::pair<ns3::Scheduler::EventKey const, ns3::EventImpl*> > >::_Auto_node::_M_insert (470,384 samples, 0.05%)
std::vector<ns3::BuildRarListElement_s, std::allocator<ns3::BuildRarListElement_s> >::vector (274,244 samples, 0.03%)
void std::__invoke_impl<void, void (894,532 samples, 0.09%)
unsigned char* std::uninitialized_copy<__gnu_cxx::__normal_iterator<unsigned char const*, std::vector<unsigned char, std::allocator<unsigned char> > >, unsigned char*> (685,962 samples, 0.07%)
__gnu_cxx::__normal_iterator<std::__cxx11::list<ns3::Ptr<ns3::LteControlMessage>, std::allocator<ns3::Ptr<ns3::LteControlMessage> > >*, std::vector<std::__cxx11::list<ns3::Ptr<ns3::LteControlMessage>, std::allocator<ns3::Ptr<ns3::LteControlMessage> > >, std::allocator<std::__cxx11::list<ns3::Ptr<ns3::LteControlMessage>, std::allocator<ns3::Ptr<ns3::LteControlMessage> > > > > > std::__copy_move_a<true, __gnu_cxx::__normal_iterator<std::__cxx11::list<ns3::Ptr<ns3::LteControlMessage>, std::allocator<ns3::Ptr<ns3::LteControlMessage> > >*, std::vector<std::__cxx11::list<ns3::Ptr<ns3::LteControlMessage>, std::allocator<ns3::Ptr<ns3::LteControlMessage> > >, std::allocator<std::__cxx11::list<ns3::Ptr<ns3::LteControlMessage>, std::allocator<ns3::Ptr<ns3::LteControlMessage> > > > > >, __gnu_cxx::__normal_iterator<std::__cxx11::list<ns3::Ptr<ns3::LteControlMessage>, std::allocator<ns3::Ptr<ns3::LteControlMessage> > >*, std::vector<std::__cxx11::list<ns3::Ptr<ns3::LteControlMessage>, std::allocator<ns3::Ptr<ns3::LteControlMessage> > >, std::allocator<std::__cxx11::list<ns3::Ptr<ns3::LteControlMessage>, std::allocator<ns3::Ptr<ns3::LteControlMessage> > > > > > > (1,411,841 samples, 0.15%)
ns3::operator== (3,609,110 samples, 0.37%)
std::_Vector_base<double, std::allocator<double> >::_M_deallocate (154,926 samples, 0.02%)
void std::allocator_traits<std::allocator<std::_Rb_tree_node<std::pair<unsigned short const, std::vector<unsigned short, std::allocator<unsigned short> > > > > >::construct<std::pair<unsigned short const, std::vector<unsigned short, std::allocator<unsigned short> > >, std::piecewise_construct_t const&, std::tuple<unsigned short const&>, std::tuple<> > (762,055 samples, 0.08%)
std::_Rb_tree<ns3::Scheduler::EventKey, std::pair<ns3::Scheduler::EventKey const, ns3::EventImpl*>, std::_Select1st<std::pair<ns3::Scheduler::EventKey const, ns3::EventImpl*> >, std::less<ns3::Scheduler::EventKey>, std::allocator<std::pair<ns3::Scheduler::EventKey const, ns3::EventImpl*> > >::_Auto_node::_Auto_node<std::pair<ns3::Scheduler::EventKey, ns3::EventImpl*> > (644,555 samples, 0.07%)
__gnu_cxx::__normal_iterator<double*, std::vector<double, std::allocator<double> > > std::copy<__gnu_cxx::__normal_iterator<double const*, std::vector<double, std::allocator<double> > >, __gnu_cxx::__normal_iterator<double*, std::vector<double, std::allocator<double> > > > (160,870 samples, 0.02%)
__gnu_cxx::__normal_iterator<double*, std::vector<double, std::allocator<double> > > std::copy<__gnu_cxx::__normal_iterator<double const*, std::vector<double, std::allocator<double> > >, __gnu_cxx::__normal_iterator<double*, std::vector<double, std::allocator<double> > > > (1,146,176 samples, 0.12%)
std::allocator_traits<std::allocator<double> >::deallocate (124,900 samples, 0.01%)
std::vector<unsigned char, std::allocator<unsigned char> >::push_back (1,354,090 samples, 0.14%)
std::vector<ns3::Ptr<ns3::PacketBurst>, std::allocator<ns3::Ptr<ns3::PacketBurst> > >::cbegin (188,357 samples, 0.02%)
ns3::ObjectBase::ConstructSelf (3,133,932 samples, 0.32%)
std::tuple<ns3::LteUePhy*, unsigned int, unsigned int>::tuple<ns3::LteUePhy*&, unsigned int&, unsigned int&, true, true> (1,377,602 samples, 0.14%)
ns3::LteUePhy::SetSubChannelsForTransmission (8,727,549 samples, 0.90%)
std::_Select1st<std::pair<unsigned short const, std::vector<std::vector<ns3::HarqProcessInfoElement_t, std::allocator<ns3::HarqProcessInfoElement_t> >, std::allocator<std::vector<ns3::HarqProcessInfoElement_t, std::allocator<ns3::HarqProcessInfoElement_t> > > > > >::operator (166,879 samples, 0.02%)
std::_Rb_tree<unsigned int, std::pair<unsigned int const, ns3::Ptr<ns3::SpectrumValue> >, std::_Select1st<std::pair<unsigned int const, ns3::Ptr<ns3::SpectrumValue> > >, std::less<unsigned int>, std::allocator<std::pair<unsigned int const, ns3::Ptr<ns3::SpectrumValue> > > >::_M_destroy_node (192,269 samples, 0.02%)
ns3::LogComponent::IsEnabled (152,933 samples, 0.02%)
std::_Vector_base<ns3::Ptr<ns3::Object>, std::allocator<ns3::Ptr<ns3::Object> > >::_Vector_impl::_Vector_impl (302,930 samples, 0.03%)
ns3::Time::GetTimeStep (451,024 samples, 0.05%)
std::vector<ns3::HarqProcessInfoElement_t, std::allocator<ns3::HarqProcessInfoElement_t> >* std::__copy_move<true, false, std::random_access_iterator_tag>::__copy_m<std::vector<ns3::HarqProcessInfoElement_t, std::allocator<ns3::HarqProcessInfoElement_t> >*, std::vector<ns3::HarqProcessInfoElement_t, std::allocator<ns3::HarqProcessInfoElement_t> >*> (2,293,325 samples, 0.24%)
__gnu_cxx::__normal_iterator<unsigned short*, std::vector<unsigned short, std::allocator<unsigned short> > >::__normal_iterator (164,811 samples, 0.02%)
std::_Rb_tree<unsigned short, std::pair<unsigned short const, double>, std::_Select1st<std::pair<unsigned short const, double> >, std::less<unsigned short>, std::allocator<std::pair<unsigned short const, double> > >::_S_key (980,363 samples, 0.10%)
std::_Rb_tree<unsigned short, unsigned short, std::_Identity<unsigned short>, std::less<unsigned short>, std::allocator<unsigned short> >::_M_lower_bound (601,582 samples, 0.06%)
std::__cxx11::_List_base<ns3::UlDciLteControlMessage, std::allocator<ns3::UlDciLteControlMessage> >::_List_base (302,422 samples, 0.03%)
ns3::Ptr<ns3::Packet>::operator (206,181 samples, 0.02%)
ns3::Ptr<ns3::SpectrumValue> ns3::Copy<ns3::SpectrumValue> (1,772,766 samples, 0.18%)
ns3::LteInterference::StartRx (194,219 samples, 0.02%)
void std::allocator_traits<std::allocator<std::_Rb_tree_node<std::pair<ns3::TbId_t const, ns3::tbInfo_t> > > >::construct<std::pair<ns3::TbId_t const, ns3::tbInfo_t>, std::pair<ns3::TbId_t, ns3::tbInfo_t> > (979,889 samples, 0.10%)
std::_Rb_tree<ns3::TbId_t, std::pair<ns3::TbId_t const, ns3::tbInfo_t>, std::_Select1st<std::pair<ns3::TbId_t const, ns3::tbInfo_t> >, std::less<ns3::TbId_t>, std::allocator<std::pair<ns3::TbId_t const, ns3::tbInfo_t> > >::_M_end (205,386 samples, 0.02%)
std::_Tuple_impl<1ul, ns3::Ptr<ns3::SpectrumValue>, double, ns3::Ptr<ns3::SpectrumSignalParameters>, ns3::Ptr<ns3::SpectrumPhy>, std::map<unsigned int, ns3::Ptr<ns3::SpectrumValue>, std::less<unsigned int>, std::allocator<std::pair<unsigned int const, ns3::Ptr<ns3::SpectrumValue> > > > >::~_Tuple_impl (361,973 samples, 0.04%)
ns3::Ptr<ns3::EventImpl>::Acquire (274,749 samples, 0.03%)
std::vector<unsigned char, std::allocator<unsigned char> >::vector (780,494 samples, 0.08%)
ns3::Ptr<ns3::RarLteControlMessage> ns3::Create<ns3::RarLteControlMessage> (306,535 samples, 0.03%)
std::_Bind<void (153,418 samples, 0.02%)
void std::allocator_traits<std::allocator<std::_List_node<ns3::Ptr<ns3::LteControlMessage> > > >::destroy<ns3::Ptr<ns3::LteControlMessage> > (210,243 samples, 0.02%)
void std::_Rb_tree<unsigned short, std::pair<unsigned short const, std::vector<double, std::allocator<double> > >, std::_Select1st<std::pair<unsigned short const, std::vector<double, std::allocator<double> > > >, std::less<unsigned short>, std::allocator<std::pair<unsigned short const, std::vector<double, std::allocator<double> > > > >::_M_construct_node<std::pair<unsigned short const, std::vector<double, std::allocator<double> > > const&> (194,069 samples, 0.02%)
operator new (161,120 samples, 0.02%)
std::_Rb_tree<ns3::TbId_t, std::pair<ns3::TbId_t const, ns3::tbInfo_t>, std::_Select1st<std::pair<ns3::TbId_t const, ns3::tbInfo_t> >, std::less<ns3::TbId_t>, std::allocator<std::pair<ns3::TbId_t const, ns3::tbInfo_t> > >::_M_lower_bound (669,791 samples, 0.07%)
void std::vector<unsigned short, std::allocator<unsigned short> >::_M_realloc_insert<unsigned short> (376,292 samples, 0.04%)
std::_Rb_tree<int, std::pair<int const, double>, std::_Select1st<std::pair<int const, double> >, std::less<int>, std::allocator<std::pair<int const, double> > >::_M_copy (2,075,881 samples, 0.21%)
std::map<unsigned int, ns3::Ptr<ns3::SpectrumValue>, std::less<unsigned int>, std::allocator<std::pair<unsigned int const, ns3::Ptr<ns3::SpectrumValue> > > >::map (152,827 samples, 0.02%)
ns3::HarqProcessInfoElement_t* std::uninitialized_copy<__gnu_cxx::__normal_iterator<ns3::HarqProcessInfoElement_t const*, std::vector<ns3::HarqProcessInfoElement_t, std::allocator<ns3::HarqProcessInfoElement_t> > >, ns3::HarqProcessInfoElement_t*> (489,523 samples, 0.05%)
void std::__invoke_impl<void, ns3::Callback<void, ns3::SpectrumValue const&>::Callback<void (18,815,322 samples, 1.94%)
std::_Tuple_impl<0ul, ns3::LteEnbPhy*>::_Tuple_impl<ns3::LteEnbPhy*&> (267,164 samples, 0.03%)
decltype (238,924 samples, 0.02%)
ns3::LteUePhy::SetSubChannelsForTransmission (151,318 samples, 0.02%)
std::allocator<double>::allocate (670,068 samples, 0.07%)
void std::allocator_traits<std::allocator<ns3::ByteTagListData*> >::construct<ns3::ByteTagListData*, ns3::ByteTagListData* const&> (686,477 samples, 0.07%)
std::_Rb_tree_node<std::pair<unsigned short const, ns3::Ptr<ns3::UeManager> > >::_M_valptr (157,811 samples, 0.02%)
unsigned long* std::__copy_move<false, true, std::random_access_iterator_tag>::__copy_m<unsigned long, unsigned long> (151,080 samples, 0.02%)
ns3::DefaultDeleter<ns3::SpectrumValue>::Delete (483,075 samples, 0.05%)
std::vector<unsigned short, std::allocator<unsigned short> >::_M_check_len (765,012 samples, 0.08%)
std::_Rb_tree<unsigned int, std::pair<unsigned int const, ns3::SpectrumConverter>, std::_Select1st<std::pair<unsigned int const, ns3::SpectrumConverter> >, std::less<unsigned int>, std::allocator<std::pair<unsigned int const, ns3::SpectrumConverter> > >::_M_lower_bound (497,417 samples, 0.05%)
std::_Rb_tree<ns3::Scheduler::EventKey, std::pair<ns3::Scheduler::EventKey const, ns3::EventImpl*>, std::_Select1st<std::pair<ns3::Scheduler::EventKey const, ns3::EventImpl*> >, std::less<ns3::Scheduler::EventKey>, std::allocator<std::pair<ns3::Scheduler::EventKey const, ns3::EventImpl*> > >::lower_bound (233,935 samples, 0.02%)
std::__new_allocator<std::_Rb_tree_node<std::pair<int const, double> > >::allocate (199,176 samples, 0.02%)
std::allocator<std::_List_node<ns3::Ptr<ns3::PacketBurst> > >::deallocate (158,232 samples, 0.02%)
std::_Rb_tree_const_iterator<std::pair<unsigned int const, ns3::TxSpectrumModelInfo> >::operator (160,407 samples, 0.02%)
ns3::CallbackImplBase* ns3::PeekPointer<ns3::CallbackImplBase> (161,751 samples, 0.02%)
std::allocator_traits<std::allocator<std::_List_node<ns3::Ptr<ns3::Packet> > > >::allocate (380,371 samples, 0.04%)
std::__new_allocator<std::_Rb_tree_node<std::pair<unsigned short const, std::vector<unsigned short, std::allocator<unsigned short> > > > >::allocate (190,227 samples, 0.02%)
int const& std::max<int> (162,598 samples, 0.02%)
std::_Rb_tree<unsigned short, std::pair<unsigned short const, std::map<unsigned char, ns3::LteMacSapUser*, std::less<unsigned char>, std::allocator<std::pair<unsigned char const, ns3::LteMacSapUser*> > > >, std::_Select1st<std::pair<unsigned short const, std::map<unsigned char, ns3::LteMacSapUser*, std::less<unsigned char>, std::allocator<std::pair<unsigned char const, ns3::LteMacSapUser*> > > > >, std::less<unsigned short>, std::allocator<std::pair<unsigned short const, std::map<unsigned char, ns3::LteMacSapUser*, std::less<unsigned char>, std::allocator<std::pair<unsigned char const, ns3::LteMacSapUser*> > > > > >::find (2,397,524 samples, 0.25%)
unsigned char const* std::__niter_base<unsigned char const*, std::vector<unsigned char, std::allocator<unsigned char> > > (192,782 samples, 0.02%)
std::_Bit_iterator std::__copy_move_a1<false, std::_Bit_iterator, std::_Bit_iterator> (338,164 samples, 0.03%)
std::allocator<ns3::DlInfoListElement_s::HarqStatus_e>::allocate (283,919 samples, 0.03%)
ns3::CqiListElement_s* std::__uninitialized_copy_a<std::move_iterator<ns3::CqiListElement_s*>, ns3::CqiListElement_s*, ns3::CqiListElement_s> (253,339 samples, 0.03%)
std::_Vector_base<ns3::BuildDataListElement_s, std::allocator<ns3::BuildDataListElement_s> >::_Vector_impl::_Vector_impl (312,863 samples, 0.03%)
void std::_Destroy<ns3::VendorSpecificListElement_s> (234,807 samples, 0.02%)
ns3::Object::Check (344,145 samples, 0.04%)
std::map<unsigned int, ns3::Ptr<ns3::SpectrumValue>, std::less<unsigned int>, std::allocator<std::pair<unsigned int const, ns3::Ptr<ns3::SpectrumValue> > > >::lower_bound (308,342 samples, 0.03%)
void std::vector<std::vector<ns3::RlcPduListElement_s, std::allocator<ns3::RlcPduListElement_s> >, std::allocator<std::vector<ns3::RlcPduListElement_s, std::allocator<ns3::RlcPduListElement_s> > > >::_M_realloc_insert<std::vector<ns3::RlcPduListElement_s, std::allocator<ns3::RlcPduListElement_s> > const&> (3,097,204 samples, 0.32%)
ns3::LteSpectrumSignalParametersDlCtrlFrame::~LteSpectrumSignalParametersDlCtrlFrame (191,802 samples, 0.02%)
std::_Vector_base<double, std::allocator<double> >::_M_create_storage (525,645 samples, 0.05%)
ns3::ByteTagList::Deallocate (1,415,797 samples, 0.15%)
ns3::DlInfoListElement_s::~DlInfoListElement_s (429,894 samples, 0.04%)
void std::allocator_traits<std::allocator<std::_Rb_tree_node<std::pair<unsigned int const, ns3::Ptr<ns3::SpectrumValue> > > > >::construct<std::pair<unsigned int const, ns3::Ptr<ns3::SpectrumValue> >, unsigned int const&, ns3::Ptr<ns3::SpectrumValue>&> (273,321 samples, 0.03%)
ns3::Ptr<ns3::SpectrumModel const> const& std::forward<ns3::Ptr<ns3::SpectrumModel const> const&> (200,391 samples, 0.02%)
std::vector<double, std::allocator<double> >::~vector (240,996 samples, 0.02%)
ns3::PacketBurst::DoDispose (310,660 samples, 0.03%)
unsigned char* std::__copy_move_a2<false, unsigned char const*, unsigned char*> (149,127 samples, 0.02%)
ns3::DlInfoListElement_s::HarqStatus_e* std::uninitialized_fill_n<ns3::DlInfoListElement_s::HarqStatus_e*, unsigned long, ns3::DlInfoListElement_s::HarqStatus_e> (233,279 samples, 0.02%)
ns3::Ptr<ns3::SpectrumModel const>::~Ptr (200,937 samples, 0.02%)
double* std::__uninitialized_default_n<double*, unsigned long> (1,117,487 samples, 0.12%)
std::_Select1st<std::pair<ns3::Scheduler::EventKey const, ns3::EventImpl*> >::operator (125,698 samples, 0.01%)
std::this_thread::get_id (281,874 samples, 0.03%)
ns3::UlCqi_s::UlCqi_s (1,442,850 samples, 0.15%)
ns3::Ptr<ns3::SpectrumSignalParameters>::Ptr (560,187 samples, 0.06%)
std::map<ns3::Scheduler::EventKey, ns3::EventImpl*, std::less<ns3::Scheduler::EventKey>, std::allocator<std::pair<ns3::Scheduler::EventKey const, ns3::EventImpl*> > >::lower_bound (567,494 samples, 0.06%)
void std::allocator_traits<std::allocator<std::_Rb_tree_node<std::pair<unsigned short const, std::vector<unsigned short, std::allocator<unsigned short> > > > > >::construct<std::pair<unsigned short const, std::vector<unsigned short, std::allocator<unsigned short> > >, std::piecewise_construct_t const&, std::tuple<unsigned short const&>, std::tuple<> > (998,649 samples, 0.10%)
std::_Rb_tree<unsigned char, std::pair<unsigned char const, ns3::LteMacSapUser*>, std::_Select1st<std::pair<unsigned char const, ns3::LteMacSapUser*> >, std::less<unsigned char>, std::allocator<std::pair<unsigned char const, ns3::LteMacSapUser*> > >::find (187,880 samples, 0.02%)
std::_Rb_tree<ns3::Scheduler::EventKey, std::pair<ns3::Scheduler::EventKey const, ns3::EventImpl*>, std::_Select1st<std::pair<ns3::Scheduler::EventKey const, ns3::EventImpl*> >, std::less<ns3::Scheduler::EventKey>, std::allocator<std::pair<ns3::Scheduler::EventKey const, ns3::EventImpl*> > >::_M_get_node (219,715 samples, 0.02%)
std::vector<unsigned short, std::allocator<unsigned short> >::_S_relocate (387,343 samples, 0.04%)
std::_Rb_tree<ns3::Scheduler::EventKey, std::pair<ns3::Scheduler::EventKey const, ns3::EventImpl*>, std::_Select1st<std::pair<ns3::Scheduler::EventKey const, ns3::EventImpl*> >, std::less<ns3::Scheduler::EventKey>, std::allocator<std::pair<ns3::Scheduler::EventKey const, ns3::EventImpl*> > >::_M_end (202,902 samples, 0.02%)
std::_Vector_base<ns3::HarqProcessInfoElement_t, std::allocator<ns3::HarqProcessInfoElement_t> >::_Vector_base (125,047 samples, 0.01%)
std::_Vector_base<ns3::RlcPduListElement_s, std::allocator<ns3::RlcPduListElement_s> >::_M_allocate (194,495 samples, 0.02%)
std::vector<unsigned char, std::allocator<unsigned char> >::operator= (403,446 samples, 0.04%)
std::vector<ns3::HarqProcessInfoElement_t, std::allocator<ns3::HarqProcessInfoElement_t> >::vector (850,937 samples, 0.09%)
std::enable_if<std::is_constructible<std::pair<ns3::Scheduler::EventKey const, ns3::EventImpl*>, std::pair<ns3::Scheduler::EventKey, ns3::EventImpl*> >::value, std::pair<std::_Rb_tree_iterator<std::pair<ns3::Scheduler::EventKey const, ns3::EventImpl*> >, bool> >::type std::map<ns3::Scheduler::EventKey, ns3::EventImpl*, std::less<ns3::Scheduler::EventKey>, std::allocator<std::pair<ns3::Scheduler::EventKey const, ns3::EventImpl*> > >::insert<std::pair<ns3::Scheduler::EventKey, ns3::EventImpl*> > (4,087,508 samples, 0.42%)
std::_Rb_tree<unsigned short, std::pair<unsigned short const, ns3::DlInfoListElement_s>, std::_Select1st<std::pair<unsigned short const, ns3::DlInfoListElement_s> >, std::less<unsigned short>, std::allocator<std::pair<unsigned short const, ns3::DlInfoListElement_s> > >::_Rb_tree (313,901 samples, 0.03%)
std::vector<bool, std::allocator<bool> >::push_back (418,154 samples, 0.04%)
ns3::HarqProcessInfoElement_t const* std::__niter_base<ns3::HarqProcessInfoElement_t const*, std::vector<ns3::HarqProcessInfoElement_t, std::allocator<ns3::HarqProcessInfoElement_t> > > (470,519 samples, 0.05%)
ns3::Ptr<ns3::LteControlMessage>::Ptr (200,534 samples, 0.02%)
std::allocator<unsigned short>::allocate (378,466 samples, 0.04%)
std::vector<ns3::Ptr<ns3::Object>, std::allocator<ns3::Ptr<ns3::Object> > >::~vector (1,236,212 samples, 0.13%)
unsigned short* std::__copy_move_a2<false, unsigned short const*, unsigned short*> (205,186 samples, 0.02%)
ns3::PacketBurst::PacketBurst (1,613,776 samples, 0.17%)
ns3::LteMiErrorModel::MappingMiBler (755,586 samples, 0.08%)
std::__cxx11::list<ns3::Ptr<ns3::LteControlMessage>, std::allocator<ns3::Ptr<ns3::LteControlMessage> > >::operator= (845,523 samples, 0.09%)
void std::destroy_at<ns3::DlInfoListElement_s> (1,186,954 samples, 0.12%)
std::function<void (19,739,449 samples, 2.04%)
ns3::PacketTagList::Add (1,413,859 samples, 0.15%)
std::__cxx11::list<ns3::Ptr<ns3::LteControlMessage>, std::allocator<ns3::Ptr<ns3::LteControlMessage> > >::list (213,081 samples, 0.02%)
ns3::LteEnbPhy::CreatePuschCqiReport (5,488,789 samples, 0.57%)
ns3::SpectrumSignalParameters::SpectrumSignalParameters (4,200,055 samples, 0.43%)
void std::__cxx11::list<ns3::Ptr<ns3::LteControlMessage>, std::allocator<ns3::Ptr<ns3::LteControlMessage> > >::_M_insert<ns3::Ptr<ns3::LteControlMessage> const&> (413,599 samples, 0.04%)
std::_Rb_tree<unsigned char, std::pair<unsigned char const, ns3::LteUeMac::LcInfo>, std::_Select1st<std::pair<unsigned char const, ns3::LteUeMac::LcInfo> >, std::less<unsigned char>, std::allocator<std::pair<unsigned char const, ns3::LteUeMac::LcInfo> > >::begin (392,398 samples, 0.04%)
ns3::TracedCallback<ns3::Ptr<ns3::SpectrumPhy const>, ns3::Ptr<ns3::SpectrumPhy const>, double>::operator (401,545 samples, 0.04%)
void std::__cxx11::list<ns3::Ptr<ns3::LteControlMessage>, std::allocator<ns3::Ptr<ns3::LteControlMessage> > >::_M_insert<ns3::Ptr<ns3::LteControlMessage> const&> (154,939 samples, 0.02%)
ns3::Angles::NormalizeAngles (351,340 samples, 0.04%)
std::_Rb_tree_node<std::pair<unsigned short const, unsigned char> >::_M_valptr (154,865 samples, 0.02%)
ns3::Packet::GetSize (399,735 samples, 0.04%)
std::vector<ns3::DlInfoListElement_s, std::allocator<ns3::DlInfoListElement_s> >::end (193,090 samples, 0.02%)
ns3::SpectrumValue::~SpectrumValue (393,222 samples, 0.04%)
ns3::Ptr<ns3::MobilityModel>::Ptr (160,721 samples, 0.02%)
std::_Rb_tree_decrement (189,133 samples, 0.02%)
ns3::LteInterference::StartRx (4,413,510 samples, 0.46%)
std::_Bit_iterator::operator+= (153,737 samples, 0.02%)
ns3::MakeEvent<void (372,209 samples, 0.04%)
std::vector<ns3::ByteTagListData*, std::allocator<ns3::ByteTagListData*> >::empty (831,186 samples, 0.09%)
std::_Rb_tree_node<std::pair<unsigned int const, ns3::Ptr<ns3::SpectrumValue> > >* std::_Rb_tree<unsigned int, std::pair<unsigned int const, ns3::Ptr<ns3::SpectrumValue> >, std::_Select1st<std::pair<unsigned int const, ns3::Ptr<ns3::SpectrumValue> > >, std::less<unsigned int>, std::allocator<std::pair<unsigned int const, ns3::Ptr<ns3::SpectrumValue> > > >::_Alloc_node::operator (200,295 samples, 0.02%)
double std::reduce<__gnu_cxx::__normal_iterator<double const*, std::vector<double, std::allocator<double> > >, double> (892,712 samples, 0.09%)
std::_Rb_tree_iterator<std::pair<unsigned short const, double> >::operator (275,175 samples, 0.03%)
std::_Rb_tree<unsigned short, std::pair<unsigned short const, std::vector<std::vector<ns3::HarqProcessInfoElement_t, std::allocator<ns3::HarqProcessInfoElement_t> >, std::allocator<std::vector<ns3::HarqProcessInfoElement_t, std::allocator<ns3::HarqProcessInfoElement_t> > > > >, std::_Select1st<std::pair<unsigned short const, std::vector<std::vector<ns3::HarqProcessInfoElement_t, std::allocator<ns3::HarqProcessInfoElement_t> >, std::allocator<std::vector<ns3::HarqProcessInfoElement_t, std::allocator<ns3::HarqProcessInfoElement_t> > > > > >, std::less<unsigned short>, std::allocator<std::pair<unsigned short const, std::vector<std::vector<ns3::HarqProcessInfoElement_t, std::allocator<ns3::HarqProcessInfoElement_t> >, std::allocator<std::vector<ns3::HarqProcessInfoElement_t, std::allocator<ns3::HarqProcessInfoElement_t> > > > > > >::_S_key (741,857 samples, 0.08%)
void std::_Bind<void (5,321,712 samples, 0.55%)
std::pair<std::_Rb_tree_iterator<std::pair<ns3::Scheduler::EventKey const, ns3::EventImpl*> >, bool>::pair<std::_Rb_tree_iterator<std::pair<ns3::Scheduler::EventKey const, ns3::EventImpl*> >&, bool> (187,042 samples, 0.02%)
ns3::Ptr<ns3::LteUePhy>::~Ptr (132,349 samples, 0.01%)
ns3::EnbMacMemberLteEnbPhySapUser::SubframeIndication (2,983,151 samples, 0.31%)
std::allocator<std::_List_node<ns3::Ptr<ns3::LteControlMessage> > >::allocate (185,442 samples, 0.02%)
std::vector<ns3::DlInfoListElement_s::HarqStatus_e, std::allocator<ns3::DlInfoListElement_s::HarqStatus_e> >::~vector (497,075 samples, 0.05%)
std::__cxx11::_List_base<ns3::AttributeConstructionList::Item, std::allocator<ns3::AttributeConstructionList::Item> >::_List_impl::_List_impl (877,007 samples, 0.09%)
__gnu_cxx::__aligned_membuf<std::pair<unsigned char const, ns3::LteMacSapProvider::ReportBufferStatusParameters> >::_M_addr (164,024 samples, 0.02%)
ns3::Ptr<ns3::LteNetDevice>::Acquire (197,652 samples, 0.02%)
std::set<unsigned short, std::less<unsigned short>, std::allocator<unsigned short> >::end (238,188 samples, 0.02%)
std::_Rb_tree<unsigned short, std::pair<unsigned short const, ns3::pfsFlowPerf_t>, std::_Select1st<std::pair<unsigned short const, ns3::pfsFlowPerf_t> >, std::less<unsigned short>, std::allocator<std::pair<unsigned short const, ns3::pfsFlowPerf_t> > >::find (1,671,204 samples, 0.17%)
std::_Vector_base<double, std::allocator<double> >::_M_allocate (612,796 samples, 0.06%)
unsigned long* std::__niter_base<unsigned long*> (159,817 samples, 0.02%)
ns3::operator!= (3,765,543 samples, 0.39%)
ns3::BuildRarListElement_s* std::uninitialized_copy<__gnu_cxx::__normal_iterator<ns3::BuildRarListElement_s const*, std::vector<ns3::BuildRarListElement_s, std::allocator<ns3::BuildRarListElement_s> > >, ns3::BuildRarListElement_s*> (198,569 samples, 0.02%)
(129,312 samples, 0.01%)
std::__cxx11::list<ns3::AttributeConstructionList::Item, std::allocator<ns3::AttributeConstructionList::Item> >::list (421,055 samples, 0.04%)
unsigned short* std::copy<__gnu_cxx::__normal_iterator<unsigned short const*, std::vector<unsigned short, std::allocator<unsigned short> > >, unsigned short*> (534,449 samples, 0.06%)
std::vector<ns3::Ptr<ns3::Object>, std::allocator<ns3::Ptr<ns3::Object> > >::~vector (328,685 samples, 0.03%)
std::vector<ns3::TypeId::AttributeInformation, std::allocator<ns3::TypeId::AttributeInformation> >::size (158,366 samples, 0.02%)
std::enable_if<std::is_constructible<std::pair<ns3::Scheduler::EventKey const, ns3::EventImpl*>, std::pair<ns3::Scheduler::EventKey, ns3::EventImpl*> >::value, std::pair<std::_Rb_tree_iterator<std::pair<ns3::Scheduler::EventKey const, ns3::EventImpl*> >, bool> >::type std::map<ns3::Scheduler::EventKey, ns3::EventImpl*, std::less<ns3::Scheduler::EventKey>, std::allocator<std::pair<ns3::Scheduler::EventKey const, ns3::EventImpl*> > >::insert<std::pair<ns3::Scheduler::EventKey, ns3::EventImpl*> > (5,466,153 samples, 0.56%)
std::vector<double, std::allocator<double> >::end (505,490 samples, 0.05%)
void std::_Destroy<std::vector<ns3::RlcPduListElement_s, std::allocator<ns3::RlcPduListElement_s> >*> (229,070 samples, 0.02%)
std::_Rb_tree<ns3::TbId_t, std::pair<ns3::TbId_t const, ns3::tbInfo_t>, std::_Select1st<std::pair<ns3::TbId_t const, ns3::tbInfo_t> >, std::less<ns3::TbId_t>, std::allocator<std::pair<ns3::TbId_t const, ns3::tbInfo_t> > >::_M_mbegin (159,237 samples, 0.02%)
std::_Function_handler<void (31,621,347 samples, 3.26%) s..
ns3::AttributeConstructionList::~AttributeConstructionList (315,373 samples, 0.03%)
std::map<unsigned int, ns3::TxSpectrumModelInfo, std::less<unsigned int>, std::allocator<std::pair<unsigned int const, ns3::TxSpectrumModelInfo> > >::find (1,921,178 samples, 0.20%)
ns3::EventId::EventId (206,004 samples, 0.02%)
std::vector<ns3::HigherLayerSelected_s, std::allocator<ns3::HigherLayerSelected_s> >::at (396,578 samples, 0.04%)
ns3::LteUePhy::SubframeIndication (107,909,732 samples, 11.13%) ns3::LteUe..
std::_Vector_base<ns3::DlInfoListElement_s::HarqStatus_e, std::allocator<ns3::DlInfoListElement_s::HarqStatus_e> >::_Vector_base (643,355 samples, 0.07%)
std::__cxx11::list<ns3::Ptr<ns3::LteControlMessage>, std::allocator<ns3::Ptr<ns3::LteControlMessage> > >::empty (157,851 samples, 0.02%)
std::_Rb_tree<unsigned short, std::pair<unsigned short const, std::vector<std::vector<ns3::Ptr<ns3::PacketBurst>, std::allocator<ns3::Ptr<ns3::PacketBurst> > >, std::allocator<std::vector<ns3::Ptr<ns3::PacketBurst>, std::allocator<ns3::Ptr<ns3::PacketBurst> > > > > >, std::_Select1st<std::pair<unsigned short const, std::vector<std::vector<ns3::Ptr<ns3::PacketBurst>, std::allocator<ns3::Ptr<ns3::PacketBurst> > >, std::allocator<std::vector<ns3::Ptr<ns3::PacketBurst>, std::allocator<ns3::Ptr<ns3::PacketBurst> > > > > > >, std::less<unsigned short>, std::allocator<std::pair<unsigned short const, std::vector<std::vector<ns3::Ptr<ns3::PacketBurst>, std::allocator<ns3::Ptr<ns3::PacketBurst> > >, std::allocator<std::vector<ns3::Ptr<ns3::PacketBurst>, std::allocator<ns3::Ptr<ns3::PacketBurst> > > > > > > >::find (1,524,725 samples, 0.16%)
int& std::vector<int, std::allocator<int> >::emplace_back<int> (148,897 samples, 0.02%)
ns3::LteAmc::GetCqiFromSpectralEfficiency (426,858 samples, 0.04%)
std::_Rb_tree<unsigned int, std::pair<unsigned int const, ns3::Ptr<ns3::SpectrumValue> >, std::_Select1st<std::pair<unsigned int const, ns3::Ptr<ns3::SpectrumValue> > >, std::less<unsigned int>, std::allocator<std::pair<unsigned int const, ns3::Ptr<ns3::SpectrumValue> > > >::_M_put_node (164,554 samples, 0.02%)
ns3::Ptr<ns3::PacketBurst const>::Ptr<ns3::PacketBurst> (197,139 samples, 0.02%)
std::vector<double, std::allocator<double> >::operator= (892,964 samples, 0.09%)
ns3::IidManager::GetAttributeN (876,759 samples, 0.09%)
std::_Rb_tree<unsigned char, std::pair<unsigned char const, ns3::LteMacSapProvider::ReportBufferStatusParameters>, std::_Select1st<std::pair<unsigned char const, ns3::LteMacSapProvider::ReportBufferStatusParameters> >, std::less<unsigned char>, std::allocator<std::pair<unsigned char const, ns3::LteMacSapProvider::ReportBufferStatusParameters> > >::_S_key (486,222 samples, 0.05%)
ns3::Now (240,092 samples, 0.02%)
ns3::MemberLteFfrSapProvider<ns3::LteFrNoOpAlgorithm>::GetAvailableUlRbg (191,473 samples, 0.02%)
void std::__cxx11::list<ns3::Ptr<ns3::LteControlMessage>, std::allocator<ns3::Ptr<ns3::LteControlMessage> > >::_M_assign_dispatch<std::_List_const_iterator<ns3::Ptr<ns3::LteControlMessage> > > (211,914 samples, 0.02%)
(230,158 samples, 0.02%)
unsigned short* std::__copy_move_a1<false, unsigned short const*, unsigned short*> (286,745 samples, 0.03%)
void std::__invoke_impl<void, void (29,774,663 samples, 3.07%) v..
std::_Rb_tree_node<std::pair<ns3::Scheduler::EventKey const, ns3::EventImpl*> >* std::_Rb_tree<ns3::Scheduler::EventKey, std::pair<ns3::Scheduler::EventKey const, ns3::EventImpl*>, std::_Select1st<std::pair<ns3::Scheduler::EventKey const, ns3::EventImpl*> >, std::less<ns3::Scheduler::EventKey>, std::allocator<std::pair<ns3::Scheduler::EventKey const, ns3::EventImpl*> > >::_M_create_node<std::pair<ns3::Scheduler::EventKey, ns3::EventImpl*> > (644,555 samples, 0.07%)
void std::__cxx11::list<ns3::Ptr<ns3::Packet>, std::allocator<ns3::Ptr<ns3::Packet> > >::_M_insert<ns3::Ptr<ns3::Packet> const&> (228,148 samples, 0.02%)
__log10_finite (323,658 samples, 0.03%)
std::pair<std::_Rb_tree_iterator<std::pair<ns3::Scheduler::EventKey const, ns3::EventImpl*> >, bool>::pair (160,600 samples, 0.02%)
std::_Rb_tree<unsigned short, std::pair<unsigned short const, ns3::LteUePhy::UeMeasurementsElement>, std::_Select1st<std::pair<unsigned short const, ns3::LteUePhy::UeMeasurementsElement> >, std::less<unsigned short>, std::allocator<std::pair<unsigned short const, ns3::LteUePhy::UeMeasurementsElement> > >::find (242,538 samples, 0.03%)
ns3::LteMacSapProvider::TransmitPduParameters::~TransmitPduParameters (199,865 samples, 0.02%)
ns3::LteInterference*& std::_Mu<ns3::LteInterference*, false, false>::operator (286,822 samples, 0.03%)
std::_Rb_tree<unsigned short, std::pair<unsigned short const, ns3::LteEnbComponentCarrierManager::UeInfo>, std::_Select1st<std::pair<unsigned short const, ns3::LteEnbComponentCarrierManager::UeInfo> >, std::less<unsigned short>, std::allocator<std::pair<unsigned short const, ns3::LteEnbComponentCarrierManager::UeInfo> > >::_M_begin (163,866 samples, 0.02%)
std::_Tuple_impl<1ul, ns3::Ptr<ns3::SpectrumValue const>, unsigned int>::_M_head (396,724 samples, 0.04%)
std::__invoke_result<void (872,147,551 samples, 89.93%) std::__invoke_result<void
std::_Rb_tree<unsigned short, std::pair<unsigned short const, unsigned int>, std::_Select1st<std::pair<unsigned short const, unsigned int> >, std::less<unsigned short>, std::allocator<std::pair<unsigned short const, unsigned int> > >::end (158,886 samples, 0.02%)
double* std::__uninitialized_copy<true>::__uninit_copy<__gnu_cxx::__normal_iterator<double const*, std::vector<double, std::allocator<double> > >, double*> (335,852 samples, 0.03%)
std::vector<ns3::Buffer::Data*, std::allocator<ns3::Buffer::Data*> >::empty (925,744 samples, 0.10%)
std::vector<unsigned char, std::allocator<unsigned char> >::max_size (498,524 samples, 0.05%)
std::enable_if<is_invocable_r_v<void, void (30,508,273 samples, 3.15%) s..
ns3::SimpleRefCount<ns3::Object, ns3::ObjectBase, ns3::ObjectDeleter>::Unref (2,326,898 samples, 0.24%)
__gnu_cxx::__aligned_membuf<std::pair<unsigned short const, std::vector<std::vector<ns3::HarqProcessInfoElement_t, std::allocator<ns3::HarqProcessInfoElement_t> >, std::allocator<std::vector<ns3::HarqProcessInfoElement_t, std::allocator<ns3::HarqProcessInfoElement_t> > > > > >::_M_addr (126,016 samples, 0.01%)
std::allocator<double>::deallocate (164,716 samples, 0.02%)
std::_Rb_tree<unsigned short, std::pair<unsigned short const, std::vector<unsigned char, std::allocator<unsigned char> > >, std::_Select1st<std::pair<unsigned short const, std::vector<unsigned char, std::allocator<unsigned char> > > >, std::less<unsigned short>, std::allocator<std::pair<unsigned short const, std::vector<unsigned char, std::allocator<unsigned char> > > > >::begin (189,215 samples, 0.02%)
__gnu_cxx::__normal_iterator<double const*, std::vector<double, std::allocator<double> > >::operator++ (165,053 samples, 0.02%)
void std::_Destroy<ns3::MacCeListElement_s> (796,900 samples, 0.08%)
std::_List_node<ns3::Ptr<ns3::LteControlMessage> >* std::__cxx11::list<ns3::Ptr<ns3::LteControlMessage>, std::allocator<ns3::Ptr<ns3::LteControlMessage> > >::_M_create_node<ns3::Ptr<ns3::LteControlMessage> const&> (154,939 samples, 0.02%)
std::_Tuple_impl<0ul, ns3::LteUePhy*, unsigned int, unsigned int>::_Tuple_impl<ns3::LteUePhy*&, unsigned int&, unsigned int&, void> (1,139,526 samples, 0.12%)
ns3::DlInfoListElement_s::HarqStatus_e* std::__uninitialized_copy_a<__gnu_cxx::__normal_iterator<ns3::DlInfoListElement_s::HarqStatus_e const*, std::vector<ns3::DlInfoListElement_s::HarqStatus_e, std::allocator<ns3::DlInfoListElement_s::HarqStatus_e> > >, ns3::DlInfoListElement_s::HarqStatus_e*, ns3::DlInfoListElement_s::HarqStatus_e> (2,253,213 samples, 0.23%)
std::__cxx11::_List_base<ns3::Ptr<ns3::LteControlMessage>, std::allocator<ns3::Ptr<ns3::LteControlMessage> > >::~_List_base (538,728 samples, 0.06%)
void std::_Destroy<unsigned char*, unsigned char> (237,950 samples, 0.02%)
ns3::operator- (347,823 samples, 0.04%)
std::_Bind<void (751,966 samples, 0.08%)
ns3::VendorSpecificListElement_s* std::uninitialized_copy<__gnu_cxx::__normal_iterator<ns3::VendorSpecificListElement_s const*, std::vector<ns3::VendorSpecificListElement_s, std::allocator<ns3::VendorSpecificListElement_s> > >, ns3::VendorSpecificListElement_s*> (386,345 samples, 0.04%)
std::_List_node<ns3::Ptr<ns3::LteControlMessage> >::_M_valptr (561,256 samples, 0.06%)
__gnu_cxx::__aligned_membuf<unsigned short>::_M_ptr (202,650 samples, 0.02%)
std::allocator_traits<std::allocator<unsigned char> >::deallocate (197,176 samples, 0.02%)
std::_List_node<ns3::Ptr<ns3::LteControlMessage> >* std::__cxx11::list<ns3::Ptr<ns3::LteControlMessage>, std::allocator<ns3::Ptr<ns3::LteControlMessage> > >::_M_create_node<ns3::Ptr<ns3::LteControlMessage> const&> (564,216 samples, 0.06%)
void std::_Destroy_aux<false>::__destroy<ns3::HigherLayerSelected_s*> (151,525 samples, 0.02%)
std::allocator_traits<std::allocator<double> >::deallocate (199,701 samples, 0.02%)
atan2f32x (451,382 samples, 0.05%)
std::operator== (155,056 samples, 0.02%)
ns3::Ptr<ns3::SpectrumModel const>::Ptr (148,972 samples, 0.02%)
unsigned char* std::__uninitialized_default_n_a<unsigned char*, unsigned long, unsigned char> (957,537 samples, 0.10%)
std::_Head_base<0ul, ns3::LteInterference*, false>::_Head_base<ns3::LteInterference*&> (359,845 samples, 0.04%)
std::_Rb_tree<unsigned short, std::pair<unsigned short const, std::vector<unsigned char, std::allocator<unsigned char> > >, std::_Select1st<std::pair<unsigned short const, std::vector<unsigned char, std::allocator<unsigned char> > > >, std::less<unsigned short>, std::allocator<std::pair<unsigned short const, std::vector<unsigned char, std::allocator<unsigned char> > > > >::find (152,754 samples, 0.02%)
std::_Rb_tree_iterator<std::pair<ns3::TbId_t const, ns3::tbInfo_t> > std::map<ns3::TbId_t, ns3::tbInfo_t, std::less<ns3::TbId_t>, std::allocator<std::pair<ns3::TbId_t const, ns3::tbInfo_t> > >::emplace_hint<std::pair<ns3::TbId_t, ns3::tbInfo_t> > (2,727,119 samples, 0.28%)
int* std::__uninitialized_copy_a<__gnu_cxx::__normal_iterator<int const*, std::vector<int, std::allocator<int> > >, int*, int> (730,011 samples, 0.08%)
std::function<void (1,369,617 samples, 0.14%)
ns3::Callback<void, ns3::Ptr<ns3::Packet> >::operator (21,452,008 samples, 2.21%)
double* std::__uninitialized_copy_a<__gnu_cxx::__normal_iterator<double const*, std::vector<double, std::allocator<double> > >, double*, double> (156,421 samples, 0.02%)
ns3::Packet::Copy (2,016,224 samples, 0.21%)
std::enable_if<is_member_pointer_v<void (5,779,283 samples, 0.60%)
ns3::LteNetDevice::GetNode (844,941 samples, 0.09%)
std::_Function_base::_Base_manager<std::_Bind<void (6,361,481 samples, 0.66%)
ns3::NoOpComponentCarrierManager::DoNotifyTxOpportunity (304,289 samples, 0.03%)
std::vector<unsigned short, std::allocator<unsigned short> >::vector (190,812 samples, 0.02%)
ns3::LteRlcSpecificLteMacSapUser::NotifyTxOpportunity (304,289 samples, 0.03%)
std::vector<ns3::DlInfoListElement_s::HarqStatus_e, std::allocator<ns3::DlInfoListElement_s::HarqStatus_e> >::~vector (802,126 samples, 0.08%)
std::vector<double, std::allocator<double> >::begin (198,307 samples, 0.02%)
std::vector<ns3::UlInfoListElement_s, std::allocator<ns3::UlInfoListElement_s> >::clear (312,181 samples, 0.03%)
ns3::LteEnbPhy::StartSubFrame (314,249 samples, 0.03%)
ns3::Ptr<ns3::SpectrumPhy>::operator bool (277,440 samples, 0.03%)
std::vector<double, std::allocator<double> >::~vector (514,929 samples, 0.05%)
double const& const& std::__get_helper<0ul, double const&, double const&, double const&> (550,022 samples, 0.06%)
(199,830 samples, 0.02%)
std::_Rb_tree<unsigned char, std::pair<unsigned char const, ns3::LteMacSapUser*>, std::_Select1st<std::pair<unsigned char const, ns3::LteMacSapUser*> >, std::less<unsigned char>, std::allocator<std::pair<unsigned char const, ns3::LteMacSapUser*> > >::end (167,970 samples, 0.02%)
ns3::LteRlcSpecificLteMacSapUser::NotifyTxOpportunity (6,532,753 samples, 0.67%)
ns3::TypeId::GetParent (699,339 samples, 0.07%)
std::__cxx11::list<ns3::Ptr<ns3::Packet>, std::allocator<ns3::Ptr<ns3::Packet> > >::end (217,306 samples, 0.02%)
ns3::Ptr<ns3::SpectrumValue>::operator= (399,056 samples, 0.04%)
std::pair<unsigned short const, std::vector<unsigned short, std::allocator<unsigned short> > >::~pair (189,965 samples, 0.02%)
std::_Rb_tree_node<std::pair<ns3::LteSpectrumModelId const, ns3::Ptr<ns3::SpectrumModel> > >::_M_valptr (193,132 samples, 0.02%)
ns3::Object::DoDelete (2,326,898 samples, 0.24%)
ns3::LteSpectrumValueHelper::CreateTxPowerSpectralDensity (5,482,916 samples, 0.57%)
double* std::__copy_move_a<false, __gnu_cxx::__normal_iterator<double const*, std::vector<double, std::allocator<double> > >, double*> (205,537 samples, 0.02%)
(310,011 samples, 0.03%)
ns3::Packet::Packet (2,947,073 samples, 0.30%)
void std::_Destroy_aux<false>::__destroy<ns3::VendorSpecificListElement_s*> (157,042 samples, 0.02%)
double* std::__uninitialized_default_n_a<double*, unsigned long, double> (153,593 samples, 0.02%)
ns3::Ptr<ns3::LteSpectrumSignalParametersDataFrame> ns3::DynamicCast<ns3::LteSpectrumSignalParametersDataFrame, ns3::SpectrumSignalParameters> (654,107 samples, 0.07%)
std::__cxx11::list<ns3::Callback<void, unsigned short, unsigned char, unsigned int, unsigned long>, std::allocator<ns3::Callback<void, unsigned short, unsigned char, unsigned int, unsigned long> > >::begin (246,319 samples, 0.03%)
std::_Rb_tree<unsigned short, std::pair<unsigned short const, ns3::DlInfoListElement_s>, std::_Select1st<std::pair<unsigned short const, ns3::DlInfoListElement_s> >, std::less<unsigned short>, std::allocator<std::pair<unsigned short const, ns3::DlInfoListElement_s> > >::~_Rb_tree (314,365 samples, 0.03%)
ns3::VendorSpecificListElement_s* std::__uninitialized_copy<false>::__uninit_copy<__gnu_cxx::__normal_iterator<ns3::VendorSpecificListElement_s const*, std::vector<ns3::VendorSpecificListElement_s, std::allocator<ns3::VendorSpecificListElement_s> > >, ns3::VendorSpecificListElement_s*> (598,518 samples, 0.06%)
ns3::Vector3D::GetLength (199,594 samples, 0.02%)
std::function<void (75,554,587 samples, 7.79%) std::f..
std::map<unsigned short, std::vector<std::vector<ns3::HarqProcessInfoElement_t, std::allocator<ns3::HarqProcessInfoElement_t> >, std::allocator<std::vector<ns3::HarqProcessInfoElement_t, std::allocator<ns3::HarqProcessInfoElement_t> > > >, std::less<unsigned short>, std::allocator<std::pair<unsigned short const, std::vector<std::vector<ns3::HarqProcessInfoElement_t, std::allocator<ns3::HarqProcessInfoElement_t> >, std::allocator<std::vector<ns3::HarqProcessInfoElement_t, std::allocator<ns3::HarqProcessInfoElement_t> > > > > > >::begin (520,365 samples, 0.05%)
ns3::ObjectBase::ConstructSelf (2,631,536 samples, 0.27%)
unsigned char* std::__uninitialized_copy<true>::__uninit_copy<__gnu_cxx::__normal_iterator<unsigned char const*, std::vector<unsigned char, std::allocator<unsigned char> > >, unsigned char*> (371,349 samples, 0.04%)
std::_Rb_tree_iterator<std::pair<unsigned short const, std::vector<unsigned short, std::allocator<unsigned short> > > >::operator++ (269,003 samples, 0.03%)
ns3::LteUeMac::DoTransmitPdu (5,333,252 samples, 0.55%)
std::enable_if<is_member_pointer_v<void (676,289 samples, 0.07%)
ns3::LteUePhy::GenerateMixedCqiReport (24,898,652 samples, 2.57%)
std::vector<unsigned char, std::allocator<unsigned char> >::vector (259,580 samples, 0.03%)
ns3::Ptr<ns3::PacketBurst>::operator= (1,864,456 samples, 0.19%)
(236,363 samples, 0.02%)
void std::__fill_a<double*, double> (356,463 samples, 0.04%)
ns3::LteSpectrumSignalParametersDataFrame::Copy (6,331,179 samples, 0.65%)
std::vector<std::__cxx11::list<ns3::Ptr<ns3::LteControlMessage>, std::allocator<ns3::Ptr<ns3::LteControlMessage> > >, std::allocator<std::__cxx11::list<ns3::Ptr<ns3::LteControlMessage>, std::allocator<ns3::Ptr<ns3::LteControlMessage> > > > >::size (159,421 samples, 0.02%)
std::vector<double, std::allocator<double> >::end (262,399 samples, 0.03%)
ns3::Tag::~Tag (149,528 samples, 0.02%)
std::allocator_traits<std::allocator<std::_List_node<ns3::Ptr<ns3::Packet> > > >::allocate (313,319 samples, 0.03%)
std::_Rb_tree<ns3::LteFlowId_t, std::pair<ns3::LteFlowId_t const, ns3::FfMacSchedSapProvider::SchedDlRlcBufferReqParameters>, std::_Select1st<std::pair<ns3::LteFlowId_t const, ns3::FfMacSchedSapProvider::SchedDlRlcBufferReqParameters> >, std::less<ns3::LteFlowId_t>, std::allocator<std::pair<ns3::LteFlowId_t const, ns3::FfMacSchedSapProvider::SchedDlRlcBufferReqParameters> > >::_S_key (488,547 samples, 0.05%)
std::__cxx11::list<ns3::Ptr<ns3::LteControlMessage>, std::allocator<ns3::Ptr<ns3::LteControlMessage> > >::begin (162,995 samples, 0.02%)
std::allocator_traits<std::allocator<std::_List_node<ns3::UlDciLteControlMessage> > >::allocate (420,367 samples, 0.04%)
ns3::Angles::Angles (311,344 samples, 0.03%)
void std::_Destroy_aux<false>::__destroy<ns3::MacCeListElement_s*> (796,900 samples, 0.08%)
ns3::Ptr<ns3::AntennaModel>::operator= (374,650 samples, 0.04%)
std::_Vector_base<ns3::DlInfoListElement_s::HarqStatus_e, std::allocator<ns3::DlInfoListElement_s::HarqStatus_e> >::_M_get_Tp_allocator (152,962 samples, 0.02%)
__gnu_cxx::__normal_iterator<ns3::ByteTagListData**, std::vector<ns3::ByteTagListData*, std::allocator<ns3::ByteTagListData*> > >::__normal_iterator (214,988 samples, 0.02%)
__cxa_finalize (155,299 samples, 0.02%)
std::_List_const_iterator<ns3::Ptr<ns3::LteControlMessage> >::_List_const_iterator (158,022 samples, 0.02%)
std::_Vector_base<ns3::DlInfoListElement_s::HarqStatus_e, std::allocator<ns3::DlInfoListElement_s::HarqStatus_e> >::_M_deallocate (148,463 samples, 0.02%)
std::enable_if<std::is_constructible<std::pair<ns3::Scheduler::EventKey const, ns3::EventImpl*>, std::pair<ns3::Scheduler::EventKey, ns3::EventImpl*> >::value, std::pair<std::_Rb_tree_iterator<std::pair<ns3::Scheduler::EventKey const, ns3::EventImpl*> >, bool> >::type std::map<ns3::Scheduler::EventKey, ns3::EventImpl*, std::less<ns3::Scheduler::EventKey>, std::allocator<std::pair<ns3::Scheduler::EventKey const, ns3::EventImpl*> > >::insert<std::pair<ns3::Scheduler::EventKey, ns3::EventImpl*> > (146,147 samples, 0.02%)
std::pair<ns3::Scheduler::EventKey const, ns3::EventImpl*>::pair<ns3::Scheduler::EventKey, ns3::EventImpl*> (318,404 samples, 0.03%)
void std::allocator_traits<std::allocator<std::_Rb_tree_node<std::pair<ns3::TbId_t const, ns3::tbInfo_t> > > >::construct<std::pair<ns3::TbId_t const, ns3::tbInfo_t>, std::pair<ns3::TbId_t, ns3::tbInfo_t> > (775,942 samples, 0.08%)
std::__cxx11::list<ns3::Callback<void, unsigned short, unsigned short, double, double, unsigned char>, std::allocator<ns3::Callback<void, unsigned short, unsigned short, double, double, unsigned char> > >::begin (372,850 samples, 0.04%)
ns3::LteRlcSm::DoReceivePdu (1,549,265 samples, 0.16%)
ns3::RlcTag::Serialize (197,148 samples, 0.02%)
ns3::Ptr<ns3::LteControlMessage>& std::__cxx11::list<ns3::Ptr<ns3::LteControlMessage>, std::allocator<ns3::Ptr<ns3::LteControlMessage> > >::emplace_back<ns3::Ptr<ns3::LteControlMessage> const&> (898,249 samples, 0.09%)
void std::_Construct<std::vector<ns3::RlcPduListElement_s, std::allocator<ns3::RlcPduListElement_s> >, std::vector<ns3::RlcPduListElement_s, std::allocator<ns3::RlcPduListElement_s> > const&> (184,373 samples, 0.02%)
void std::__cxx11::list<ns3::Ptr<ns3::LteControlMessage>, std::allocator<ns3::Ptr<ns3::LteControlMessage> > >::_M_insert<ns3::Ptr<ns3::LteControlMessage>&> (617,971 samples, 0.06%)
ns3::AttributeConstructionList::AttributeConstructionList (566,514 samples, 0.06%)
ns3::DlInfoListElement_s::DlInfoListElement_s (411,592 samples, 0.04%)
std::_Rb_tree_iterator<std::pair<unsigned char const, ns3::LteMacSapProvider::ReportBufferStatusParameters> >::operator* (283,168 samples, 0.03%)
decltype (367,864 samples, 0.04%)
std::pair<std::_Rb_tree_iterator<std::pair<ns3::Scheduler::EventKey const, ns3::EventImpl*> >, bool>::pair<std::_Rb_tree_iterator<std::pair<ns3::Scheduler::EventKey const, ns3::EventImpl*> >&, bool> (153,072 samples, 0.02%)
void std::_Destroy<ns3::VendorSpecificListElement_s*, ns3::VendorSpecificListElement_s> (162,953 samples, 0.02%)
ns3::DefaultDeleter<ns3::EventImpl>::Delete (786,828 samples, 0.08%)
ns3::BuildDataListElement_s* std::__uninitialized_copy_a<__gnu_cxx::__normal_iterator<ns3::BuildDataListElement_s const*, std::vector<ns3::BuildDataListElement_s, std::allocator<ns3::BuildDataListElement_s> > >, ns3::BuildDataListElement_s*, ns3::BuildDataListElement_s> (556,681 samples, 0.06%)
std::_Tuple_impl<1ul, double const&, double const&>::_M_head (323,243 samples, 0.03%)
std::_Rb_tree<int, std::pair<int const, double>, std::_Select1st<std::pair<int const, double> >, std::less<int>, std::allocator<std::pair<int const, double> > >::_M_drop_node (152,641 samples, 0.02%)
std::__new_allocator<int>::allocate (169,207 samples, 0.02%)
std::_Rb_tree_node<std::pair<int const, double> >* std::_Rb_tree<int, std::pair<int const, double>, std::_Select1st<std::pair<int const, double> >, std::less<int>, std::allocator<std::pair<int const, double> > >::_M_clone_node<false, std::_Rb_tree<int, std::pair<int const, double>, std::_Select1st<std::pair<int const, double> >, std::less<int>, std::allocator<std::pair<int const, double> > >::_Alloc_node> (911,587 samples, 0.09%)
std::vector<ns3::UlDciListElement_s, std::allocator<ns3::UlDciListElement_s> >::push_back (234,296 samples, 0.02%)
std::vector<ns3::Ptr<ns3::PacketBurst>, std::allocator<ns3::Ptr<ns3::PacketBurst> > >::erase (2,911,768 samples, 0.30%)
ns3::Object::~Object (776,622 samples, 0.08%)
ns3::int64x64_t::MulByInvert (359,204 samples, 0.04%)
ns3::SpectrumValue::operator= (1,990,186 samples, 0.21%)
ns3::Vector3D::GetLength (422,570 samples, 0.04%)
ns3::SpectrumModel::GetUid (126,136 samples, 0.01%)
ns3::Ptr<ns3::LteSpectrumSignalParametersUlSrsFrame>::Ptr (205,401 samples, 0.02%)
[libc.so.6] (144,943 samples, 0.01%)
__gnu_cxx::__normal_iterator<double*, std::vector<double, std::allocator<double> > >::__normal_iterator (155,390 samples, 0.02%)
void std::destroy_at<ns3::Ptr<ns3::Packet> > (274,123 samples, 0.03%)
std::vector<std::__cxx11::list<ns3::Ptr<ns3::LteControlMessage>, std::allocator<ns3::Ptr<ns3::LteControlMessage> > >, std::allocator<std::__cxx11::list<ns3::Ptr<ns3::LteControlMessage>, std::allocator<ns3::Ptr<ns3::LteControlMessage> > > > >::_M_erase (264,157 samples, 0.03%)
ns3::CallbackImpl<void, unsigned short, ns3::Ptr<ns3::SpectrumValue> >::operator (1,320,674 samples, 0.14%)
std::vector<unsigned char, std::allocator<unsigned char> >::resize (1,973,260 samples, 0.20%)
std::_Rb_tree_node<std::pair<unsigned short const, std::vector<unsigned short, std::allocator<unsigned short> > > >* std::_Rb_tree<unsigned short, std::pair<unsigned short const, std::vector<unsigned short, std::allocator<unsigned short> > >, std::_Select1st<std::pair<unsigned short const, std::vector<unsigned short, std::allocator<unsigned short> > > >, std::less<unsigned short>, std::allocator<std::pair<unsigned short const, std::vector<unsigned short, std::allocator<unsigned short> > > > >::_M_create_node<std::piecewise_construct_t const&, std::tuple<unsigned short const&>, std::tuple<> > (922,589 samples, 0.10%)
ns3::HarqProcessInfoElement_t* std::__uninitialized_copy_a<__gnu_cxx::__normal_iterator<ns3::HarqProcessInfoElement_t const*, std::vector<ns3::HarqProcessInfoElement_t, std::allocator<ns3::HarqProcessInfoElement_t> > >, ns3::HarqProcessInfoElement_t*, ns3::HarqProcessInfoElement_t> (419,766 samples, 0.04%)
std::_Function_handler<void (73,612,890 samples, 7.59%) std::_..
std::_Bit_const_iterator::_Bit_const_iterator (191,509 samples, 0.02%)
__gnu_cxx::__aligned_membuf<std::pair<unsigned short const, double> >::_M_ptr (260,663 samples, 0.03%)
__gnu_cxx::__normal_iterator<double*, std::vector<double, std::allocator<double> > >::operator* (284,432 samples, 0.03%)
ns3::Buffer::Buffer (198,909 samples, 0.02%)
std::vector<ns3::HarqProcessInfoElement_t, std::allocator<ns3::HarqProcessInfoElement_t> >* std::__copy_move_a1<true, std::vector<ns3::HarqProcessInfoElement_t, std::allocator<ns3::HarqProcessInfoElement_t> >*, std::vector<ns3::HarqProcessInfoElement_t, std::allocator<ns3::HarqProcessInfoElement_t> >*> (148,381 samples, 0.02%)
[libc.so.6] (149,521 samples, 0.02%)
std::pair<std::__strip_reference_wrapper<std::decay<ns3::Scheduler::EventKey const&>::type>::__type, std::__strip_reference_wrapper<std::decay<ns3::EventImpl* const&>::type>::__type> std::make_pair<ns3::Scheduler::EventKey const&, ns3::EventImpl* const&> (145,249 samples, 0.01%)
std::__cxx11::list<ns3::Ptr<ns3::Packet>, std::allocator<ns3::Ptr<ns3::Packet> > >::begin (232,377 samples, 0.02%)
std::_Tuple_impl<1ul, ns3::Ptr<ns3::PacketBurst> >::_Tuple_impl<ns3::Ptr<ns3::PacketBurst>&> (549,835 samples, 0.06%)
std::_Rb_tree<unsigned short, std::pair<unsigned short const, std::vector<unsigned char, std::allocator<unsigned char> > >, std::_Select1st<std::pair<unsigned short const, std::vector<unsigned char, std::allocator<unsigned char> > > >, std::less<unsigned short>, std::allocator<std::pair<unsigned short const, std::vector<unsigned char, std::allocator<unsigned char> > > > >::_M_lower_bound (778,887 samples, 0.08%)
ns3::Ptr<ns3::PacketBurst>::~Ptr (156,408 samples, 0.02%)
ns3::CqiListElement_s* std::uninitialized_copy<__gnu_cxx::__normal_iterator<ns3::CqiListElement_s*, std::vector<ns3::CqiListElement_s, std::allocator<ns3::CqiListElement_s> > >, ns3::CqiListElement_s*> (1,085,784 samples, 0.11%)
ns3::LteInterference::ConditionallyEvaluateChunk (17,432,677 samples, 1.80%)
std::_Select1st<std::pair<unsigned short const, std::vector<std::vector<ns3::Ptr<ns3::PacketBurst>, std::allocator<ns3::Ptr<ns3::PacketBurst> > >, std::allocator<std::vector<ns3::Ptr<ns3::PacketBurst>, std::allocator<ns3::Ptr<ns3::PacketBurst> > > > > > >::operator (198,281 samples, 0.02%)
void std::vector<ns3::BuildDataListElement_s, std::allocator<ns3::BuildDataListElement_s> >::_M_realloc_insert<ns3::BuildDataListElement_s const&> (306,330 samples, 0.03%)
ns3::SimpleRefCount<ns3::Object, ns3::ObjectBase, ns3::ObjectDeleter>::Unref (201,024 samples, 0.02%)
std::vector<int, std::allocator<int> >::_S_max_size (236,269 samples, 0.02%)
ns3::SpectrumValue::~SpectrumValue (199,623 samples, 0.02%)
ns3::DlInfoListElement_s::DlInfoListElement_s (461,722 samples, 0.05%)
ns3::DlDciLteControlMessage::~DlDciLteControlMessage (321,995 samples, 0.03%)
void std::allocator_traits<std::allocator<std::_List_node<ns3::Ptr<ns3::Packet> > > >::destroy<ns3::Ptr<ns3::Packet> > (1,191,133 samples, 0.12%)
__gnu_cxx::__normal_iterator<std::__cxx11::list<ns3::UlDciLteControlMessage, std::allocator<ns3::UlDciLteControlMessage> >*, std::vector<std::__cxx11::list<ns3::UlDciLteControlMessage, std::allocator<ns3::UlDciLteControlMessage> >, std::allocator<std::__cxx11::list<ns3::UlDciLteControlMessage, std::allocator<ns3::UlDciLteControlMessage> > > > > std::__copy_move_a<true, __gnu_cxx::__normal_iterator<std::__cxx11::list<ns3::UlDciLteControlMessage, std::allocator<ns3::UlDciLteControlMessage> >*, std::vector<std::__cxx11::list<ns3::UlDciLteControlMessage, std::allocator<ns3::UlDciLteControlMessage> >, std::allocator<std::__cxx11::list<ns3::UlDciLteControlMessage, std::allocator<ns3::UlDciLteControlMessage> > > > >, __gnu_cxx::__normal_iterator<std::__cxx11::list<ns3::UlDciLteControlMessage, std::allocator<ns3::UlDciLteControlMessage> >*, std::vector<std::__cxx11::list<ns3::UlDciLteControlMessage, std::allocator<ns3::UlDciLteControlMessage> >, std::allocator<std::__cxx11::list<ns3::UlDciLteControlMessage, std::allocator<ns3::UlDciLteControlMessage> > > > > > (1,780,222 samples, 0.18%)
std::allocator_traits<std::allocator<unsigned short> >::allocate (378,103 samples, 0.04%)
ns3::HigherLayerSelected_s* std::__uninitialized_copy<false>::__uninit_copy<__gnu_cxx::__normal_iterator<ns3::HigherLayerSelected_s const*, std::vector<ns3::HigherLayerSelected_s, std::allocator<ns3::HigherLayerSelected_s> > >, ns3::HigherLayerSelected_s*> (283,264 samples, 0.03%)
unsigned char* std::uninitialized_copy<__gnu_cxx::__normal_iterator<unsigned char const*, std::vector<unsigned char, std::allocator<unsigned char> > >, unsigned char*> (151,453 samples, 0.02%)
__gnu_cxx::__normal_iterator<double*, std::vector<double, std::allocator<double> > > std::copy<__gnu_cxx::__normal_iterator<double const*, std::vector<double, std::allocator<double> > >, __gnu_cxx::__normal_iterator<double*, std::vector<double, std::allocator<double> > > > (455,373 samples, 0.05%)
ns3::DefaultSimulatorImpl::ScheduleWithContext (5,432,130 samples, 0.56%)
std::_Rb_tree<unsigned short, unsigned short, std::_Identity<unsigned short>, std::less<unsigned short>, std::allocator<unsigned short> >::_Rb_tree (311,875 samples, 0.03%)
std::allocator<unsigned char>::deallocate (194,524 samples, 0.02%)
ns3::LtePhy::GetPacketBurst (15,706,938 samples, 1.62%)
void std::_Destroy<ns3::PhichListElement_s*, ns3::PhichListElement_s> (154,556 samples, 0.02%)
std::vector<ns3::DlInfoListElement_s, std::allocator<ns3::DlInfoListElement_s> >::~vector (1,044,337 samples, 0.11%)
ns3::Packet::Packet (2,100,998 samples, 0.22%)
std::vector<bool, std::allocator<bool> >::resize (689,758 samples, 0.07%)
std::_Rb_tree<unsigned short, std::pair<unsigned short const, unsigned char>, std::_Select1st<std::pair<unsigned short const, unsigned char> >, std::less<unsigned short>, std::allocator<std::pair<unsigned short const, unsigned char> > >::find (1,162,445 samples, 0.12%)
void std::_Construct<double> (202,964 samples, 0.02%)
ns3::Ptr<ns3::SpectrumModel const>::Ptr (454,759 samples, 0.05%)
std::function<void (28,352,327 samples, 2.92%) s..
std::__cxx11::list<ns3::Ptr<ns3::Packet>, std::allocator<ns3::Ptr<ns3::Packet> > >::clear (1,046,140 samples, 0.11%)
std::map<unsigned int, ns3::SpectrumConverter, std::less<unsigned int>, std::allocator<std::pair<unsigned int const, ns3::SpectrumConverter> > >::find (1,206,198 samples, 0.12%)
void std::__cxx11::list<ns3::Ptr<ns3::LteControlMessage>, std::allocator<ns3::Ptr<ns3::LteControlMessage> > >::_M_insert<ns3::Ptr<ns3::LteControlMessage> const&> (453,041 samples, 0.05%)
std::vector<double, std::allocator<double> >::_M_default_initialize (232,224 samples, 0.02%)
std::_Rb_tree<unsigned int, std::pair<unsigned int const, ns3::SpectrumConverter>, std::_Select1st<std::pair<unsigned int const, ns3::SpectrumConverter> >, std::less<unsigned int>, std::allocator<std::pair<unsigned int const, ns3::SpectrumConverter> > >::_M_lower_bound (587,425 samples, 0.06%)
ns3::MemberSchedSapProvider<ns3::PfFfMacScheduler>::SchedDlTriggerReq (9,997,060 samples, 1.03%)
std::__cxx11::_List_base<ns3::UlDciLteControlMessage, std::allocator<ns3::UlDciLteControlMessage> >::~_List_base (231,280 samples, 0.02%)
__gnu_cxx::__aligned_membuf<std::pair<ns3::LteSpectrumModelId const, ns3::Ptr<ns3::SpectrumModel> > >::_M_ptr (157,058 samples, 0.02%)
ns3::SimpleRefCount<ns3::SpectrumValue, ns3::Empty, ns3::DefaultDeleter<ns3::SpectrumValue> >::Unref (318,182 samples, 0.03%)
std::_Tuple_impl<0ul, ns3::LteSpectrumPhy*>::_Tuple_impl<ns3::LteSpectrumPhy*&> (466,575 samples, 0.05%)
ns3::EnbRrcMemberLteEnbCmacSapUser::AllocateTemporaryCellRnti (285,958 samples, 0.03%)
ns3::PacketTagList::CreateTagData (656,493 samples, 0.07%)
std::_Rb_tree<unsigned short, std::pair<unsigned short const, ns3::DlInfoListElement_s>, std::_Select1st<std::pair<unsigned short const, ns3::DlInfoListElement_s> >, std::less<unsigned short>, std::allocator<std::pair<unsigned short const, ns3::DlInfoListElement_s> > >::_M_begin (153,550 samples, 0.02%)
ns3::MemberLteUeCphySapUser<ns3::LteUeRrc>::RecvMasterInformationBlock (193,516 samples, 0.02%)
std::allocator<std::_Rb_tree_node<std::pair<ns3::TbId_t const, ns3::tbInfo_t> > >::allocate (264,767 samples, 0.03%)
ns3::Simulator::Now (160,616 samples, 0.02%)
std::vector<int, std::allocator<int> >::_M_move_assign (904,852 samples, 0.09%)
std::tuple_element<1ul, std::tuple<ns3::MultiModelSpectrumChannel*, ns3::Ptr<ns3::SpectrumValue>, double, ns3::Ptr<ns3::SpectrumSignalParameters>, ns3::Ptr<ns3::SpectrumPhy>, std::map<unsigned int, ns3::Ptr<ns3::SpectrumValue>, std::less<unsigned int>, std::allocator<std::pair<unsigned int const, ns3::Ptr<ns3::SpectrumValue> > > > > >::type& std::get<1ul, ns3::MultiModelSpectrumChannel*, ns3::Ptr<ns3::SpectrumValue>, double, ns3::Ptr<ns3::SpectrumSignalParameters>, ns3::Ptr<ns3::SpectrumPhy>, std::map<unsigned int, ns3::Ptr<ns3::SpectrumValue>, std::less<unsigned int>, std::allocator<std::pair<unsigned int const, ns3::Ptr<ns3::SpectrumValue> > > > > (546,406 samples, 0.06%)
ns3::MapScheduler::IsEmpty (1,317,026 samples, 0.14%)
std::_Bit_iterator std::copy<std::_Bit_iterator, std::_Bit_iterator> (786,893 samples, 0.08%)
std::_Vector_base<ns3::HarqProcessInfoElement_t, std::allocator<ns3::HarqProcessInfoElement_t> >::_Vector_impl::_Vector_impl (396,620 samples, 0.04%)
std::vector<double, std::allocator<double> >::at (397,924 samples, 0.04%)
std::vector<ns3::BuildDataListElement_s, std::allocator<ns3::BuildDataListElement_s> >::push_back (3,724,637 samples, 0.38%)
ns3::Ptr<ns3::LteControlMessage>::Ptr (171,804 samples, 0.02%)
ns3::LteUePhy::CreateDlCqiFeedbackMessage (18,538,645 samples, 1.91%)
std::_Rb_tree<unsigned int, std::pair<unsigned int const, ns3::Ptr<ns3::SpectrumValue> >, std::_Select1st<std::pair<unsigned int const, ns3::Ptr<ns3::SpectrumValue> > >, std::less<unsigned int>, std::allocator<std::pair<unsigned int const, ns3::Ptr<ns3::SpectrumValue> > > >::_Auto_node::_Auto_node<unsigned int const&, ns3::Ptr<ns3::SpectrumValue>&> (669,703 samples, 0.07%)
std::__new_allocator<std::_List_node<ns3::UlDciLteControlMessage> >::deallocate (164,519 samples, 0.02%)
ns3::LteControlMessage::LteControlMessage (179,623 samples, 0.02%)
__gnu_cxx::__aligned_membuf<std::pair<unsigned short const, std::vector<unsigned short, std::allocator<unsigned short> > > >::_M_ptr (157,744 samples, 0.02%)
std::remove_reference<unsigned short&>::type&& std::move<unsigned short&> (208,684 samples, 0.02%)
std::allocator<std::_Rb_tree_node<std::pair<ns3::Scheduler::EventKey const, ns3::EventImpl*> > >::allocate (270,834 samples, 0.03%)
ns3::PeekImpl (242,375 samples, 0.02%)
std::__cxx11::list<ns3::Ptr<ns3::LteControlMessage>, std::allocator<ns3::Ptr<ns3::LteControlMessage> > >::clear (263,603 samples, 0.03%)
ns3::Object::DoDelete (158,753 samples, 0.02%)
ns3::UlInfoListElement_s const& std::forward<ns3::UlInfoListElement_s const&> (224,662 samples, 0.02%)
std::__cxx11::list<ns3::Ptr<ns3::LteControlMessage>, std::allocator<ns3::Ptr<ns3::LteControlMessage> > >::push_back (382,869 samples, 0.04%)
std::_Vector_base<ns3::HigherLayerSelected_s, std::allocator<ns3::HigherLayerSelected_s> >::_Vector_impl_data::_Vector_impl_data (188,540 samples, 0.02%)
std::_Rb_tree<unsigned short, std::pair<unsigned short const, double>, std::_Select1st<std::pair<unsigned short const, double> >, std::less<unsigned short>, std::allocator<std::pair<unsigned short const, double> > >::find (1,926,820 samples, 0.20%)
void std::fill<std::_Bit_iterator, bool> (469,559 samples, 0.05%)
__gnu_cxx::__aligned_membuf<std::pair<unsigned short const, std::vector<unsigned char, std::allocator<unsigned char> > > >::_M_ptr (271,891 samples, 0.03%)
ns3::Ptr<ns3::MobilityModel>::Ptr (394,072 samples, 0.04%)
std::operator== (208,615 samples, 0.02%)
std::_Tuple_impl<0ul, ns3::MultiModelSpectrumChannel*, ns3::Ptr<ns3::SpectrumValue>, double, ns3::Ptr<ns3::SpectrumSignalParameters>, ns3::Ptr<ns3::SpectrumPhy>, std::map<unsigned int, ns3::Ptr<ns3::SpectrumValue>, std::less<unsigned int>, std::allocator<std::pair<unsigned int const, ns3::Ptr<ns3::SpectrumValue> > > > >::~_Tuple_impl (4,562,243 samples, 0.47%)
std::_Bind<void (5,856,767 samples, 0.60%)
ns3::LtePhy::GetRbgSize (162,303 samples, 0.02%)
double* std::copy<__gnu_cxx::__normal_iterator<double const*, std::vector<double, std::allocator<double> > >, double*> (156,421 samples, 0.02%)
ns3::DefaultDeleter<ns3::Packet>::Delete (1,078,177 samples, 0.11%)
std::_Rb_tree<unsigned short, unsigned short, std::_Identity<unsigned short>, std::less<unsigned short>, std::allocator<unsigned short> >::find (1,768,438 samples, 0.18%)
ns3::Object::Object (375,599 samples, 0.04%)
ns3::Ptr<ns3::SpectrumModel const>::Ptr (211,561 samples, 0.02%)
ns3::SimpleRefCount<ns3::SpectrumSignalParameters, ns3::Empty, ns3::DefaultDeleter<ns3::SpectrumSignalParameters> >::Unref (3,402,650 samples, 0.35%)
void std::vector<unsigned short, std::allocator<unsigned short> >::_M_realloc_insert<unsigned short> (2,228,760 samples, 0.23%)
std::tuple<ns3::MultiModelSpectrumChannel*, ns3::Ptr<ns3::SpectrumValue>, double, ns3::Ptr<ns3::SpectrumSignalParameters>, ns3::Ptr<ns3::SpectrumPhy>, std::map<unsigned int, ns3::Ptr<ns3::SpectrumValue>, std::less<unsigned int>, std::allocator<std::pair<unsigned int const, ns3::Ptr<ns3::SpectrumValue> > > > >::~tuple (361,973 samples, 0.04%)
[libc.so.6] (166,116 samples, 0.02%)
std::__cxx11::list<ns3::AttributeConstructionList::Item, std::allocator<ns3::AttributeConstructionList::Item> >::~list (162,156 samples, 0.02%)
std::vector<std::vector<ns3::Ptr<ns3::PacketBurst>, std::allocator<ns3::Ptr<ns3::PacketBurst> > >, std::allocator<std::vector<ns3::Ptr<ns3::PacketBurst>, std::allocator<ns3::Ptr<ns3::PacketBurst> > > > >::at (125,858 samples, 0.01%)
ns3::CqiListElement_s* std::__uninitialized_copy<false>::__uninit_copy<std::move_iterator<ns3::CqiListElement_s*>, ns3::CqiListElement_s*> (136,124 samples, 0.01%)
std::vector<ns3::Ptr<ns3::PacketBurst>, std::allocator<ns3::Ptr<ns3::PacketBurst> > >::erase (8,314,163 samples, 0.86%)
std::_Rb_tree_iterator<std::pair<ns3::LteSpectrumModelId const, ns3::Ptr<ns3::SpectrumModel> > >::operator (316,802 samples, 0.03%)
std::_Vector_base<int, std::allocator<int> >::_Vector_impl_data::_M_swap_data (452,888 samples, 0.05%)
std::__cxx11::list<ns3::UlDciLteControlMessage, std::allocator<ns3::UlDciLteControlMessage> >* std::__copy_move_a1<true, std::__cxx11::list<ns3::UlDciLteControlMessage, std::allocator<ns3::UlDciLteControlMessage> >*, std::__cxx11::list<ns3::UlDciLteControlMessage, std::allocator<ns3::UlDciLteControlMessage> >*> (183,796 samples, 0.02%)
std::_Rb_tree<ns3::LteSpectrumModelId, std::pair<ns3::LteSpectrumModelId const, ns3::Ptr<ns3::SpectrumModel> >, std::_Select1st<std::pair<ns3::LteSpectrumModelId const, ns3::Ptr<ns3::SpectrumModel> > >, std::less<ns3::LteSpectrumModelId>, std::allocator<std::pair<ns3::LteSpectrumModelId const, ns3::Ptr<ns3::SpectrumModel> > > >::find (964,559 samples, 0.10%)
ns3::LteEnbRrc::SendSystemInformation (226,850 samples, 0.02%)
void std::destroy_at<std::pair<ns3::TbId_t const, ns3::tbInfo_t> > (190,528 samples, 0.02%)
std::allocator_traits<std::allocator<ns3::DlInfoListElement_s::HarqStatus_e> >::deallocate (189,106 samples, 0.02%)
void std::_Destroy<double*, double> (150,554 samples, 0.02%)
std::_Function_handler<void (28,313,540 samples, 2.92%) s..
std::vector<int, std::allocator<int> >::max_size (126,132 samples, 0.01%)
std::_Vector_base<unsigned short, std::allocator<unsigned short> >::_M_create_storage (192,396 samples, 0.02%)
ns3::Angles::Angles (1,127,648 samples, 0.12%)
std::_Bind<void (283,539 samples, 0.03%)
std::_Rb_tree_node<std::pair<unsigned short const, std::vector<unsigned short, std::allocator<unsigned short> > > >::_M_valptr (157,744 samples, 0.02%)
std::_Rb_tree<unsigned int, std::pair<unsigned int const, ns3::Ptr<ns3::SpectrumValue> >, std::_Select1st<std::pair<unsigned int const, ns3::Ptr<ns3::SpectrumValue> > >, std::less<unsigned int>, std::allocator<std::pair<unsigned int const, ns3::Ptr<ns3::SpectrumValue> > > >::_Rb_tree (959,349 samples, 0.10%)
std::vector<ns3::Buffer::Data*, std::allocator<ns3::Buffer::Data*> >::begin (350,086 samples, 0.04%)
ns3::PfFfMacScheduler::LcActivePerFlow (538,566 samples, 0.06%)
std::_Rb_tree_iterator<std::pair<unsigned int const, ns3::RxSpectrumModelInfo> >::_Rb_tree_iterator (152,326 samples, 0.02%)
ns3::Buffer::~Buffer (125,638 samples, 0.01%)
std::vector<ns3::BuildRarListElement_s, std::allocator<ns3::BuildRarListElement_s> >::vector (1,058,735 samples, 0.11%)
std::allocator<std::vector<ns3::RlcPduListElement_s, std::allocator<ns3::RlcPduListElement_s> > >::allocate (272,885 samples, 0.03%)
void std::vector<ns3::MacCeListElement_s, std::allocator<ns3::MacCeListElement_s> >::_M_range_insert<__gnu_cxx::__normal_iterator<ns3::MacCeListElement_s*, std::vector<ns3::MacCeListElement_s, std::allocator<ns3::MacCeListElement_s> > > > (2,140,649 samples, 0.22%)
std::enable_if<is_invocable_r_v<void, ns3::Callback<void, ns3::SpectrumValue const&>::Callback<void (34,406,741 samples, 3.55%) s..
ns3::Ptr<ns3::SpectrumSignalParameters>::Ptr (149,036 samples, 0.02%)
std::_Bind<void (590,966 samples, 0.06%)
std::__cxx11::_List_base<ns3::Ptr<ns3::LteControlMessage>, std::allocator<ns3::Ptr<ns3::LteControlMessage> > >::_List_impl::_List_impl (125,112 samples, 0.01%)
ns3::DlInfoListElement_s::HarqStatus_e* std::__uninitialized_copy_a<__gnu_cxx::__normal_iterator<ns3::DlInfoListElement_s::HarqStatus_e const*, std::vector<ns3::DlInfoListElement_s::HarqStatus_e, std::allocator<ns3::DlInfoListElement_s::HarqStatus_e> > >, ns3::DlInfoListElement_s::HarqStatus_e*, ns3::DlInfoListElement_s::HarqStatus_e> (234,294 samples, 0.02%)
__gnu_cxx::__aligned_membuf<std::pair<unsigned short const, unsigned int> >::_M_addr (155,895 samples, 0.02%)
std::_Rb_tree_node<std::pair<ns3::TbId_t const, ns3::tbInfo_t> >::_M_valptr (179,937 samples, 0.02%)
std::vector<int, std::allocator<int> >::vector (3,054,718 samples, 0.31%)
std::_Rb_tree<unsigned char, std::pair<unsigned char const, ns3::LteMacSapProvider*>, std::_Select1st<std::pair<unsigned char const, ns3::LteMacSapProvider*> >, std::less<unsigned char>, std::allocator<std::pair<unsigned char const, ns3::LteMacSapProvider*> > >::find (306,410 samples, 0.03%)
std::map<unsigned int, ns3::RxSpectrumModelInfo, std::less<unsigned int>, std::allocator<std::pair<unsigned int const, ns3::RxSpectrumModelInfo> > >::begin (566,414 samples, 0.06%)
std::vector<ns3::MacCeListElement_s, std::allocator<ns3::MacCeListElement_s> >::empty (341,339 samples, 0.04%)
__gnu_cxx::__aligned_membuf<std::pair<unsigned short const, std::vector<ns3::DlDciListElement_s, std::allocator<ns3::DlDciListElement_s> > > >::_M_ptr (153,839 samples, 0.02%)
std::_Vector_base<ns3::CqiListElement_s, std::allocator<ns3::CqiListElement_s> >::_M_get_Tp_allocator (193,289 samples, 0.02%)
ns3::FfMacSchedSapUser::SchedDlConfigIndParameters::~SchedDlConfigIndParameters (1,899,935 samples, 0.20%)
std::pair<std::_Rb_tree_iterator<std::pair<unsigned int const, ns3::Ptr<ns3::SpectrumValue> > >, bool> std::map<unsigned int, ns3::Ptr<ns3::SpectrumValue>, std::less<unsigned int>, std::allocator<std::pair<unsigned int const, ns3::Ptr<ns3::SpectrumValue> > > >::emplace<unsigned int const&, ns3::Ptr<ns3::SpectrumValue>&> (2,563,050 samples, 0.26%)
__gnu_cxx::__normal_iterator<double const*, std::vector<double, std::allocator<double> > >::base (157,048 samples, 0.02%)
ns3::SpectrumValue::SpectrumValue (534,535 samples, 0.06%)
std::_Vector_base<ns3::Ptr<ns3::Object>, std::allocator<ns3::Ptr<ns3::Object> > >::_M_get_Tp_allocator (199,501 samples, 0.02%)
ns3::HarqProcessInfoElement_t* std::__copy_move_a<false, __gnu_cxx::__normal_iterator<ns3::HarqProcessInfoElement_t const*, std::vector<ns3::HarqProcessInfoElement_t, std::allocator<ns3::HarqProcessInfoElement_t> > >, ns3::HarqProcessInfoElement_t*> (185,369 samples, 0.02%)
ns3::CeBitmap_e* std::copy<__gnu_cxx::__normal_iterator<ns3::CeBitmap_e const*, std::vector<ns3::CeBitmap_e, std::allocator<ns3::CeBitmap_e> > >, ns3::CeBitmap_e*> (376,947 samples, 0.04%)
std::function<void (34,901,798 samples, 3.60%) s..
std::_Rb_tree_node<std::pair<ns3::LteSpectrumModelId const, ns3::Ptr<ns3::SpectrumModel> > >::_M_valptr (246,654 samples, 0.03%)
ns3::LteUePhy::ComputeAvgSinr (312,773 samples, 0.03%)
std::_Function_handler<void (2,496,720 samples, 0.26%)
ns3::SpectrumValue::~SpectrumValue (812,960 samples, 0.08%)
ns3::Ptr<ns3::LteSpectrumSignalParametersDataFrame> ns3::Create<ns3::LteSpectrumSignalParametersDataFrame, ns3::LteSpectrumSignalParametersDataFrame const&> (6,018,311 samples, 0.62%)
std::map<unsigned int, ns3::RxSpectrumModelInfo, std::less<unsigned int>, std::allocator<std::pair<unsigned int const, ns3::RxSpectrumModelInfo> > >::end (167,887 samples, 0.02%)
std::_Rb_tree<unsigned int, std::pair<unsigned int const, ns3::RxSpectrumModelInfo>, std::_Select1st<std::pair<unsigned int const, ns3::RxSpectrumModelInfo> >, std::less<unsigned int>, std::allocator<std::pair<unsigned int const, ns3::RxSpectrumModelInfo> > >::begin (190,418 samples, 0.02%)
std::_Select1st<std::pair<ns3::Scheduler::EventKey const, ns3::EventImpl*> >::operator (124,444 samples, 0.01%)
std::_Rb_tree_iterator<std::pair<ns3::Scheduler::EventKey const, ns3::EventImpl*> > std::map<ns3::Scheduler::EventKey, ns3::EventImpl*, std::less<ns3::Scheduler::EventKey>, std::allocator<std::pair<ns3::Scheduler::EventKey const, ns3::EventImpl*> > >::emplace_hint<std::pair<ns3::Scheduler::EventKey, ns3::EventImpl*> > (4,086,821 samples, 0.42%)
std::_Rb_tree_node<std::pair<unsigned char const, ns3::LteMacSapProvider*> >::_M_valptr (320,518 samples, 0.03%)
std::function<void (324,769 samples, 0.03%)
void std::allocator_traits<std::allocator<ns3::BuildDataListElement_s> >::construct<ns3::BuildDataListElement_s, ns3::BuildDataListElement_s const&> (2,604,285 samples, 0.27%)
ns3::LteEnbMac::DoSubframeIndication (314,249 samples, 0.03%)
std::_Vector_base<ns3::UlDciListElement_s, std::allocator<ns3::UlDciListElement_s> >::~_Vector_base (383,267 samples, 0.04%)
atan2f32x (1,051,855 samples, 0.11%)
std::_Rb_tree<ns3::LteSpectrumModelId, std::pair<ns3::LteSpectrumModelId const, ns3::Ptr<ns3::SpectrumModel> >, std::_Select1st<std::pair<ns3::LteSpectrumModelId const, ns3::Ptr<ns3::SpectrumModel> > >, std::less<ns3::LteSpectrumModelId>, std::allocator<std::pair<ns3::LteSpectrumModelId const, ns3::Ptr<ns3::SpectrumModel> > > >::_S_key (426,201 samples, 0.04%)
(160,344 samples, 0.02%)
std::_List_const_iterator<ns3::Callback<void, unsigned short, ns3::Ptr<ns3::SpectrumValue> > >::_List_const_iterator (155,345 samples, 0.02%)
std::_Rb_tree<unsigned char, std::pair<unsigned char const, ns3::LteMacSapProvider*>, std::_Select1st<std::pair<unsigned char const, ns3::LteMacSapProvider*> >, std::less<unsigned char>, std::allocator<std::pair<unsigned char const, ns3::LteMacSapProvider*> > >::_M_lower_bound (234,707 samples, 0.02%)
ns3::Ptr<ns3::SpectrumValue>::~Ptr (152,896 samples, 0.02%)
ns3::SpectrumValue::Multiply (1,462,439 samples, 0.15%)
ns3::HarqProcessInfoElement_t* std::uninitialized_copy<__gnu_cxx::__normal_iterator<ns3::HarqProcessInfoElement_t const*, std::vector<ns3::HarqProcessInfoElement_t, std::allocator<ns3::HarqProcessInfoElement_t> > >, ns3::HarqProcessInfoElement_t*> (185,369 samples, 0.02%)
ns3::PacketBurst::~PacketBurst (369,943 samples, 0.04%)
__gnu_cxx::__aligned_membuf<std::pair<unsigned char const, ns3::LteMacSapProvider*> >::_M_addr (148,795 samples, 0.02%)
std::_Vector_base<double, std::allocator<double> >::_Vector_impl::_Vector_impl (270,409 samples, 0.03%)
void std::destroy_at<ns3::Ptr<ns3::LteControlMessage> > (152,858 samples, 0.02%)
ns3::Callback<void, ns3::Ptr<ns3::Packet> >::Callback<void (185,775 samples, 0.02%)
ns3::UeSelected_s::~UeSelected_s (485,130 samples, 0.05%)
std::_Rb_tree_iterator<std::pair<unsigned char const, ns3::LteMacSapProvider*> >::_Rb_tree_iterator (127,428 samples, 0.01%)
ns3::PfFfMacScheduler::DoSchedDlTriggerReq (19,285,336 samples, 1.99%)
ns3::Object::DoDelete (1,989,572 samples, 0.21%)
(124,716 samples, 0.01%)
unsigned char* std::copy<__gnu_cxx::__normal_iterator<unsigned char const*, std::vector<unsigned char, std::allocator<unsigned char> > >, unsigned char*> (315,978 samples, 0.03%)
std::function<void (20,931,339 samples, 2.16%)
ns3::Ptr<ns3::Packet>::~Ptr (786,221 samples, 0.08%)
void std::allocator_traits<std::allocator<std::_Rb_tree_node<std::pair<unsigned short const, std::vector<double, std::allocator<double> > > > > >::destroy<std::pair<unsigned short const, std::vector<double, std::allocator<double> > > > (555,448 samples, 0.06%)
std::map<unsigned short, ns3::pfsFlowPerf_t, std::less<unsigned short>, std::allocator<std::pair<unsigned short const, ns3::pfsFlowPerf_t> > >::begin (326,502 samples, 0.03%)
std::_Rb_tree_node<std::pair<unsigned int const, ns3::Ptr<ns3::SpectrumValue> > >* std::_Rb_tree<unsigned int, std::pair<unsigned int const, ns3::Ptr<ns3::SpectrumValue> >, std::_Select1st<std::pair<unsigned int const, ns3::Ptr<ns3::SpectrumValue> > >, std::less<unsigned int>, std::allocator<std::pair<unsigned int const, ns3::Ptr<ns3::SpectrumValue> > > >::_M_copy<false, std::_Rb_tree<unsigned int, std::pair<unsigned int const, ns3::Ptr<ns3::SpectrumValue> >, std::_Select1st<std::pair<unsigned int const, ns3::Ptr<ns3::SpectrumValue> > >, std::less<unsigned int>, std::allocator<std::pair<unsigned int const, ns3::Ptr<ns3::SpectrumValue> > > >::_Alloc_node> (156,128 samples, 0.02%)
std::_Rb_tree_iterator<std::pair<ns3::Scheduler::EventKey const, ns3::EventImpl*> >::operator++ (859,040 samples, 0.09%)
ns3::Ptr<ns3::LteUePhy>::Ptr (125,424 samples, 0.01%)
ns3::EventId ns3::Simulator::Schedule<void (348,760 samples, 0.04%)
std::__new_allocator<std::_List_node<ns3::Ptr<ns3::PacketBurst> > >::allocate (267,880 samples, 0.03%)
ns3::SpectrumValue::Divide (127,965 samples, 0.01%)
ns3::PacketTagList::CreateTagData (342,966 samples, 0.04%)
std::_Tuple_impl<2ul, unsigned int>::_Tuple_impl<unsigned int&> (298,400 samples, 0.03%)
[libm.so.6] (745,624 samples, 0.08%)
std::__new_allocator<double>::allocate (629,966 samples, 0.06%)
std::_Function_handler<void (27,749,977 samples, 2.86%) s..
ns3::NoOpComponentCarrierManager::DoNotifyTxOpportunity (1,376,216 samples, 0.14%)
ns3::DlInfoListElement_s* std::__uninitialized_copy<false>::__uninit_copy<__gnu_cxx::__normal_iterator<ns3::DlInfoListElement_s const*, std::vector<ns3::DlInfoListElement_s, std::allocator<ns3::DlInfoListElement_s> > >, ns3::DlInfoListElement_s*> (4,855,575 samples, 0.50%)
ns3::EnbMacMemberLteMacSapProvider<ns3::LteEnbMac>::ReportBufferStatus (682,380 samples, 0.07%)
ns3::HarqProcessInfoElement_t* std::__niter_base<ns3::HarqProcessInfoElement_t*> (232,255 samples, 0.02%)
std::_Rb_tree<unsigned short, std::pair<unsigned short const, std::vector<unsigned short, std::allocator<unsigned short> > >, std::_Select1st<std::pair<unsigned short const, std::vector<unsigned short, std::allocator<unsigned short> > > >, std::less<unsigned short>, std::allocator<std::pair<unsigned short const, std::vector<unsigned short, std::allocator<unsigned short> > > > >::_S_key (195,316 samples, 0.02%)
ns3::tbInfo_t::~tbInfo_t (389,508 samples, 0.04%)
std::__cxx11::_List_base<ns3::Ptr<ns3::LteControlMessage>, std::allocator<ns3::Ptr<ns3::LteControlMessage> > >::_M_clear (269,841 samples, 0.03%)
__dynamic_cast (424,030 samples, 0.04%)
ns3::Ptr<ns3::LteControlMessage>::Ptr (275,374 samples, 0.03%)
std::_Vector_base<ns3::UlDciListElement_s, std::allocator<ns3::UlDciListElement_s> >::_Vector_base (314,772 samples, 0.03%)
std::_List_const_iterator<ns3::Ptr<ns3::Packet> >::operator* (441,500 samples, 0.05%)
ns3::LteEnbPhy::CreateTxPowerSpectralDensity (7,834,108 samples, 0.81%)
std::_Vector_base<int, std::allocator<int> >::_M_allocate (127,251 samples, 0.01%)
ns3::DlInfoListElement_s& std::forward<ns3::DlInfoListElement_s&> (127,101 samples, 0.01%)
ns3::EventId::operator= (1,128,226 samples, 0.12%)
ns3::PacketBurst::~PacketBurst (1,394,732 samples, 0.14%)
std::vector<ns3::UlDciListElement_s, std::allocator<ns3::UlDciListElement_s> >::_M_check_len (154,264 samples, 0.02%)
std::_Vector_base<ns3::VendorSpecificListElement_s, std::allocator<ns3::VendorSpecificListElement_s> >::_M_allocate (156,029 samples, 0.02%)
std::vector<ns3::FfMacSchedSapProvider::SchedUlCqiInfoReqParameters, std::allocator<ns3::FfMacSchedSapProvider::SchedUlCqiInfoReqParameters> >::_M_erase_at_end (1,138,470 samples, 0.12%)
std::vector<int, std::allocator<int> >::vector (126,859 samples, 0.01%)
ns3::operator- (126,699 samples, 0.01%)
ns3::PacketBurst::AddPacket (2,887,463 samples, 0.30%)
ns3::Object::Check (191,566 samples, 0.02%)
std::_Rb_tree_iterator<std::pair<ns3::TbId_t const, ns3::tbInfo_t> >::_Rb_tree_iterator (155,635 samples, 0.02%)
ns3::Object::Construct (185,707 samples, 0.02%)
ns3::Ptr<ns3::Packet> ns3::Create<ns3::Packet, unsigned int&> (358,332 samples, 0.04%)
ns3::Ptr<ns3::SpectrumValue> ns3::Create<ns3::SpectrumValue, ns3::Ptr<ns3::SpectrumModel>&> (4,463,471 samples, 0.46%)
std::map<ns3::LteFlowId_t, ns3::FfMacSchedSapProvider::SchedDlRlcBufferReqParameters, std::less<ns3::LteFlowId_t>, std::allocator<std::pair<ns3::LteFlowId_t const, ns3::FfMacSchedSapProvider::SchedDlRlcBufferReqParameters> > >::begin (229,777 samples, 0.02%)
std::_Vector_base<unsigned char, std::allocator<unsigned char> >::_M_create_storage (182,249 samples, 0.02%)
ns3::DlCqiLteControlMessage::GetDlCqi (1,645,474 samples, 0.17%)
unsigned short* std::__uninitialized_move_a<unsigned short*, unsigned short*, std::allocator<unsigned short> > (192,952 samples, 0.02%)
std::_Rb_tree<unsigned int, std::pair<unsigned int const, ns3::TxSpectrumModelInfo>, std::_Select1st<std::pair<unsigned int const, ns3::TxSpectrumModelInfo> >, std::less<unsigned int>, std::allocator<std::pair<unsigned int const, ns3::TxSpectrumModelInfo> > >::_M_lower_bound (876,343 samples, 0.09%)
ns3::Ptr<ns3::SpectrumModel const>::~Ptr (357,858 samples, 0.04%)
std::_Vector_base<double, std::allocator<double> >::_Vector_base (161,229 samples, 0.02%)
std::_Rb_tree_iterator<std::pair<unsigned short const, std::vector<unsigned short, std::allocator<unsigned short> > > > std::_Rb_tree<unsigned short, std::pair<unsigned short const, std::vector<unsigned short, std::allocator<unsigned short> > >, std::_Select1st<std::pair<unsigned short const, std::vector<unsigned short, std::allocator<unsigned short> > > >, std::less<unsigned short>, std::allocator<std::pair<unsigned short const, std::vector<unsigned short, std::allocator<unsigned short> > > > >::_M_emplace_hint_unique<std::piecewise_construct_t const&, std::tuple<unsigned short const&>, std::tuple<> > (1,650,378 samples, 0.17%)
std::_Rb_tree<unsigned short, std::pair<unsigned short const, std::vector<unsigned short, std::allocator<unsigned short> > >, std::_Select1st<std::pair<unsigned short const, std::vector<unsigned short, std::allocator<unsigned short> > > >, std::less<unsigned short>, std::allocator<std::pair<unsigned short const, std::vector<unsigned short, std::allocator<unsigned short> > > > >::_M_erase (148,912 samples, 0.02%)
ns3::Ptr<ns3::PacketBurst> ns3::CreateObject<ns3::PacketBurst> (9,676,681 samples, 1.00%)
ns3::LteRlcSm::DoNotifyTxOpportunity (19,770,990 samples, 2.04%)
std::vector<int, std::allocator<int> >::reserve (334,959 samples, 0.03%)
ns3::MapScheduler::Insert (4,538,275 samples, 0.47%)
ns3::LteMiErrorModel::GetTbDecodificationStats (4,432,444 samples, 0.46%)
__gnu_cxx::__aligned_membuf<std::pair<unsigned short const, double> >::_M_ptr (275,175 samples, 0.03%)
ns3::SimpleRefCount<ns3::Object, ns3::ObjectBase, ns3::ObjectDeleter>::Unref (1,777,558 samples, 0.18%)
std::map<unsigned short, std::vector<unsigned char, std::allocator<unsigned char> >, std::less<unsigned short>, std::allocator<std::pair<unsigned short const, std::vector<unsigned char, std::allocator<unsigned char> > > > >::begin (189,215 samples, 0.02%)
ns3::RlcPduListElement_s* std::__do_uninit_copy<__gnu_cxx::__normal_iterator<ns3::RlcPduListElement_s const*, std::vector<ns3::RlcPduListElement_s, std::allocator<ns3::RlcPduListElement_s> > >, ns3::RlcPduListElement_s*> (938,823 samples, 0.10%)
ns3::Ptr<ns3::PacketBurst> ns3::CompleteConstruct<ns3::PacketBurst> (6,605,149 samples, 0.68%)
ns3::SimpleRefCount<ns3::SpectrumValue, ns3::Empty, ns3::DefaultDeleter<ns3::SpectrumValue> >::Unref (345,669 samples, 0.04%)
std::vector<int, std::allocator<int> >::vector (1,436,824 samples, 0.15%)
std::_Rb_tree<ns3::Scheduler::EventKey, std::pair<ns3::Scheduler::EventKey const, ns3::EventImpl*>, std::_Select1st<std::pair<ns3::Scheduler::EventKey const, ns3::EventImpl*> >, std::less<ns3::Scheduler::EventKey>, std::allocator<std::pair<ns3::Scheduler::EventKey const, ns3::EventImpl*> > >::_M_get_node (195,540 samples, 0.02%)
std::vector<double, std::allocator<double> >::vector (348,336 samples, 0.04%)
std::_Rb_tree<unsigned short, std::pair<unsigned short const, ns3::DlInfoListElement_s>, std::_Select1st<std::pair<unsigned short const, ns3::DlInfoListElement_s> >, std::less<unsigned short>, std::allocator<std::pair<unsigned short const, ns3::DlInfoListElement_s> > >::end (232,913 samples, 0.02%)
ns3::DlInfoListElement_s::DlInfoListElement_s (159,589 samples, 0.02%)
ns3::SpectrumValue::GetSpectrumModelUid (322,339 samples, 0.03%)
std::vector<int, std::allocator<int> >::vector (485,111 samples, 0.05%)
std::map<ns3::Scheduler::EventKey, ns3::EventImpl*, std::less<ns3::Scheduler::EventKey>, std::allocator<std::pair<ns3::Scheduler::EventKey const, ns3::EventImpl*> > >::key_comp (125,297 samples, 0.01%)
unsigned long* std::copy<unsigned long*, unsigned long*> (538,409 samples, 0.06%)
std::vector<bool, std::allocator<bool> >::_M_insert_aux (300,220 samples, 0.03%)
ns3::AttributeConstructionList::AttributeConstructionList (965,115 samples, 0.10%)
ns3::FfMacSchedSapProvider::SchedDlRlcBufferReqParameters::operator= (416,467 samples, 0.04%)
ns3::UlInfoListElement_s* std::vector<ns3::UlInfoListElement_s, std::allocator<ns3::UlInfoListElement_s> >::_M_allocate_and_copy<__gnu_cxx::__normal_iterator<ns3::UlInfoListElement_s const*, std::vector<ns3::UlInfoListElement_s, std::allocator<ns3::UlInfoListElement_s> > > > (153,511 samples, 0.02%)
std::vector<std::vector<ns3::HarqProcessInfoElement_t, std::allocator<ns3::HarqProcessInfoElement_t> >, std::allocator<std::vector<ns3::HarqProcessInfoElement_t, std::allocator<ns3::HarqProcessInfoElement_t> > > >::end (154,684 samples, 0.02%)
std::_Vector_base<ns3::UlDciListElement_s, std::allocator<ns3::UlDciListElement_s> >::_Vector_impl::_Vector_impl (156,685 samples, 0.02%)
void (154,843 samples, 0.02%)
std::_Rb_tree<unsigned int, std::pair<unsigned int const, ns3::SpectrumConverter>, std::_Select1st<std::pair<unsigned int const, ns3::SpectrumConverter> >, std::less<unsigned int>, std::allocator<std::pair<unsigned int const, ns3::SpectrumConverter> > >::find (1,053,943 samples, 0.11%)
ns3::ByteTagList::Iterator::Next (503,981 samples, 0.05%)
std::map<unsigned int, ns3::Ptr<ns3::SpectrumValue>, std::less<unsigned int>, std::allocator<std::pair<unsigned int const, ns3::Ptr<ns3::SpectrumValue> > > >::map (996,229 samples, 0.10%)
std::_Rb_tree_node<std::pair<int const, double> >* std::_Rb_tree<int, std::pair<int const, double>, std::_Select1st<std::pair<int const, double> >, std::less<int>, std::allocator<std::pair<int const, double> > >::_M_copy<false, std::_Rb_tree<int, std::pair<int const, double>, std::_Select1st<std::pair<int const, double> >, std::less<int>, std::allocator<std::pair<int const, double> > >::_Alloc_node> (418,686 samples, 0.04%)
std::allocator<std::_Rb_tree_node<std::pair<ns3::Scheduler::EventKey const, ns3::EventImpl*> > >::allocate (659,007 samples, 0.07%)
ns3::HigherLayerSelected_s* std::__do_uninit_copy<__gnu_cxx::__normal_iterator<ns3::HigherLayerSelected_s const*, std::vector<ns3::HigherLayerSelected_s, std::allocator<ns3::HigherLayerSelected_s> > >, ns3::HigherLayerSelected_s*> (711,878 samples, 0.07%)
std::__new_allocator<std::_Rb_tree_node<std::pair<ns3::Scheduler::EventKey const, ns3::EventImpl*> > >::allocate (152,219 samples, 0.02%)
std::vector<ns3::DlDciListElement_s, std::allocator<ns3::DlDciListElement_s> >::_M_range_check (399,849 samples, 0.04%)
std::_Rb_tree_node<std::pair<unsigned char const, ns3::LteMacSapProvider::ReportBufferStatusParameters> >::_M_valptr (444,605 samples, 0.05%)
std::_Vector_base<ns3::HigherLayerSelected_s, std::allocator<ns3::HigherLayerSelected_s> >::_Vector_base (412,677 samples, 0.04%)
ns3::Time::ToDouble (495,841 samples, 0.05%)
std::_Vector_base<int, std::allocator<int> >::_M_deallocate (169,673 samples, 0.02%)
std::_Rb_tree<unsigned short, std::pair<unsigned short const, std::vector<std::vector<std::vector<ns3::RlcPduListElement_s, std::allocator<ns3::RlcPduListElement_s> >, std::allocator<std::vector<ns3::RlcPduListElement_s, std::allocator<ns3::RlcPduListElement_s> > > >, std::allocator<std::vector<std::vector<ns3::RlcPduListElement_s, std::allocator<ns3::RlcPduListElement_s> >, std::allocator<std::vector<ns3::RlcPduListElement_s, std::allocator<ns3::RlcPduListElement_s> > > > > > >, std::_Select1st<std::pair<unsigned short const, std::vector<std::vector<std::vector<ns3::RlcPduListElement_s, std::allocator<ns3::RlcPduListElement_s> >, std::allocator<std::vector<ns3::RlcPduListElement_s, std::allocator<ns3::RlcPduListElement_s> > > >, std::allocator<std::vector<std::vector<ns3::RlcPduListElement_s, std::allocator<ns3::RlcPduListElement_s> >, std::allocator<std::vector<ns3::RlcPduListElement_s, std::allocator<ns3::RlcPduListElement_s> > > > > > > >, std::less<unsigned short>, std::allocator<std::pair<unsigned short const, std::vector<std::vector<std::vector<ns3::RlcPduListElement_s, std::allocator<ns3::RlcPduListElement_s> >, std::allocator<std::vector<ns3::RlcPduListElement_s, std::allocator<ns3::RlcPduListElement_s> > > >, std::allocator<std::vector<std::vector<ns3::RlcPduListElement_s, std::allocator<ns3::RlcPduListElement_s> >, std::allocator<std::vector<ns3::RlcPduListElement_s, std::allocator<ns3::RlcPduListElement_s> > > > > > > > >::_M_lower_bound (802,707 samples, 0.08%)
std::__cxx11::list<ns3::Ptr<ns3::LteControlMessage>, std::allocator<ns3::Ptr<ns3::LteControlMessage> > >::list (543,168 samples, 0.06%)
std::_Rb_tree<unsigned char, std::pair<unsigned char const, std::map<unsigned char, ns3::LteMacSapProvider*, std::less<unsigned char>, std::allocator<std::pair<unsigned char const, ns3::LteMacSapProvider*> > > >, std::_Select1st<std::pair<unsigned char const, std::map<unsigned char, ns3::LteMacSapProvider*, std::less<unsigned char>, std::allocator<std::pair<unsigned char const, ns3::LteMacSapProvider*> > > > >, std::less<unsigned char>, std::allocator<std::pair<unsigned char const, std::map<unsigned char, ns3::LteMacSapProvider*, std::less<unsigned char>, std::allocator<std::pair<unsigned char const, ns3::LteMacSapProvider*> > > > > >::end (166,213 samples, 0.02%)
ns3::LteFfConverter::double2fpS11dot3 (159,428 samples, 0.02%)
std::move_iterator<ns3::MacCeListElement_s*> std::__make_move_if_noexcept_iterator<ns3::MacCeListElement_s, std::move_iterator<ns3::MacCeListElement_s*> > (197,593 samples, 0.02%)
__gnu_cxx::__normal_iterator<std::__cxx11::list<ns3::UlDciLteControlMessage, std::allocator<ns3::UlDciLteControlMessage> >*, std::vector<std::__cxx11::list<ns3::UlDciLteControlMessage, std::allocator<ns3::UlDciLteControlMessage> >, std::allocator<std::__cxx11::list<ns3::UlDciLteControlMessage, std::allocator<ns3::UlDciLteControlMessage> > > > > std::move<__gnu_cxx::__normal_iterator<std::__cxx11::list<ns3::UlDciLteControlMessage, std::allocator<ns3::UlDciLteControlMessage> >*, std::vector<std::__cxx11::list<ns3::UlDciLteControlMessage, std::allocator<ns3::UlDciLteControlMessage> >, std::allocator<std::__cxx11::list<ns3::UlDciLteControlMessage, std::allocator<ns3::UlDciLteControlMessage> > > > >, __gnu_cxx::__normal_iterator<std::__cxx11::list<ns3::UlDciLteControlMessage, std::allocator<ns3::UlDciLteControlMessage> >*, std::vector<std::__cxx11::list<ns3::UlDciLteControlMessage, std::allocator<ns3::UlDciLteControlMessage> >, std::allocator<std::__cxx11::list<ns3::UlDciLteControlMessage, std::allocator<ns3::UlDciLteControlMessage> > > > > > (292,100 samples, 0.03%)
ns3::LteRadioBearerTag::Serialize (128,769 samples, 0.01%)
ns3::Time::Time (193,863 samples, 0.02%)
std::__cxx11::list<ns3::Ptr<ns3::LteControlMessage>, std::allocator<ns3::Ptr<ns3::LteControlMessage> > >::~list (154,473 samples, 0.02%)
ns3::ByteTagList::ByteTagList (352,331 samples, 0.04%)
__gnu_cxx::__aligned_membuf<ns3::Ptr<ns3::Packet> >::_M_addr (279,763 samples, 0.03%)
ns3::LteRlcSm::DoNotifyTxOpportunity (314,249 samples, 0.03%)
std::__new_allocator<std::vector<ns3::RlcPduListElement_s, std::allocator<ns3::RlcPduListElement_s> > >::allocate (272,885 samples, 0.03%)
std::allocator_traits<std::allocator<std::_List_node<ns3::Ptr<ns3::LteControlMessage> > > >::deallocate (229,384 samples, 0.02%)
std::vector<double, std::allocator<double> >::_M_default_initialize (648,464 samples, 0.07%)
std::__cxx11::list<ns3::Callback<void, ns3::Ptr<ns3::Packet const> >, std::allocator<ns3::Callback<void, ns3::Ptr<ns3::Packet const> > > >::begin (514,565 samples, 0.05%)
std::_Tuple_impl<1ul, double const&, double const&>::_Tuple_impl (646,830 samples, 0.07%)
ns3::LteSpectrumSignalParametersDataFrame::~LteSpectrumSignalParametersDataFrame (2,421,676 samples, 0.25%)
void std::_Destroy<ns3::HigherLayerSelected_s*> (126,894 samples, 0.01%)
ns3::MakeEvent<void (903,382 samples, 0.09%)
void ns3::Callback<void, std::__cxx11::list<ns3::Ptr<ns3::LteControlMessage>, std::allocator<ns3::Ptr<ns3::LteControlMessage> > > >::Callback<void (28,028,867 samples, 2.89%) v..
std::__cxx11::_List_base<ns3::Ptr<ns3::Packet>, std::allocator<ns3::Ptr<ns3::Packet> > >::_List_base (597,918 samples, 0.06%)
std::allocator_traits<std::allocator<std::_Rb_tree_node<std::pair<unsigned int const, ns3::Ptr<ns3::SpectrumValue> > > > >::allocate (155,343 samples, 0.02%)
void std::__cxx11::list<ns3::Ptr<ns3::LteControlMessage>, std::allocator<ns3::Ptr<ns3::LteControlMessage> > >::_M_assign_dispatch<std::_List_const_iterator<ns3::Ptr<ns3::LteControlMessage> > > (1,071,339 samples, 0.11%)
std::__cxx11::list<ns3::Ptr<ns3::LteControlMessage>, std::allocator<ns3::Ptr<ns3::LteControlMessage> > >::operator= (603,213 samples, 0.06%)
std::pair<ns3::TbId_t const, ns3::tbInfo_t>::~pair (940,561 samples, 0.10%)
ns3::LteMacSapProvider::TransmitPduParameters::TransmitPduParameters (318,692 samples, 0.03%)
double* std::copy<__gnu_cxx::__normal_iterator<double const*, std::vector<double, std::allocator<double> > >, double*> (542,531 samples, 0.06%)
void std::__cxx11::list<ns3::Ptr<ns3::Packet>, std::allocator<ns3::Ptr<ns3::Packet> > >::_M_insert<ns3::Ptr<ns3::Packet> const&> (2,075,129 samples, 0.21%)
double* std::__copy_move_a1<false, double const*, double*> (231,822 samples, 0.02%)
std::tuple<ns3::MultiModelSpectrumChannel*, ns3::Ptr<ns3::SpectrumValue>, double, ns3::Ptr<ns3::SpectrumSignalParameters>, ns3::Ptr<ns3::SpectrumPhy>, std::map<unsigned int, ns3::Ptr<ns3::SpectrumValue>, std::less<unsigned int>, std::allocator<std::pair<unsigned int const, ns3::Ptr<ns3::SpectrumValue> > > > >::tuple<ns3::MultiModelSpectrumChannel*&, ns3::Ptr<ns3::SpectrumValue>&, double&, ns3::Ptr<ns3::SpectrumSignalParameters>&, ns3::Ptr<ns3::SpectrumPhy>&, std::map<unsigned int, ns3::Ptr<ns3::SpectrumValue>, std::less<unsigned int>, std::allocator<std::pair<unsigned int const, ns3::Ptr<ns3::SpectrumValue> > > >&, true, true> (550,800 samples, 0.06%)
std::_Rb_tree_node<std::pair<unsigned short const, unsigned int> >::_M_valptr (349,350 samples, 0.04%)
std::map<unsigned short, std::vector<unsigned short, std::allocator<unsigned short> >, std::less<unsigned short>, std::allocator<std::pair<unsigned short const, std::vector<unsigned short, std::allocator<unsigned short> > > > >::operator[] (460,007 samples, 0.05%)
ns3::EnbMacMemberLteEnbPhySapUser::SubframeIndication (20,436,391 samples, 2.11%)
std::function<void (916,117 samples, 0.09%)
std::_Function_base::_Base_manager<ns3::Callback<void, ns3::DlInfoListElement_s>::Callback<void (339,825 samples, 0.04%)
ns3::int64x64_t::int64x64_t (1,306,529 samples, 0.13%)
std::_Rb_tree<ns3::TbId_t, std::pair<ns3::TbId_t const, ns3::tbInfo_t>, std::_Select1st<std::pair<ns3::TbId_t const, ns3::tbInfo_t> >, std::less<ns3::TbId_t>, std::allocator<std::pair<ns3::TbId_t const, ns3::tbInfo_t> > >::_M_lower_bound (306,362 samples, 0.03%)
std::_Head_base<1ul, ns3::Ptr<ns3::PacketBurst>, false>::_Head_base<ns3::Ptr<ns3::PacketBurst>&> (472,356 samples, 0.05%)
ns3::Callback<void, ns3::DlInfoListElement_s>::Callback<void (152,653 samples, 0.02%)
unsigned short* std::__uninitialized_copy_a<__gnu_cxx::__normal_iterator<unsigned short const*, std::vector<unsigned short, std::allocator<unsigned short> > >, unsigned short*, unsigned short> (706,218 samples, 0.07%)
std::operator== (166,583 samples, 0.02%)
unsigned short* std::uninitialized_copy<__gnu_cxx::__normal_iterator<unsigned short const*, std::vector<unsigned short, std::allocator<unsigned short> > >, unsigned short*> (851,489 samples, 0.09%)
ns3::IidManager::LookupInformation (309,380 samples, 0.03%)
ns3::ConstantPositionMobilityModel::DoGetPosition (241,331 samples, 0.02%)
double* std::__uninitialized_copy<true>::__uninit_copy<__gnu_cxx::__normal_iterator<double const*, std::vector<double, std::allocator<double> > >, double*> (891,656 samples, 0.09%)
std::vector<ns3::Ptr<ns3::Object>, std::allocator<ns3::Ptr<ns3::Object> > >::~vector (425,381 samples, 0.04%)
std::_Vector_base<unsigned short, std::allocator<unsigned short> >::_Vector_base (157,238 samples, 0.02%)
ns3::EnbMacMemberLteEnbPhySapUser::SubframeIndication (1,650,854 samples, 0.17%)
std::_Head_base<1ul, ns3::Ptr<ns3::SpectrumValue const>, false>::~_Head_base (200,623 samples, 0.02%)
ns3::Ptr<ns3::LteSpectrumSignalParametersDlCtrlFrame>::~Ptr (455,774 samples, 0.05%)
operator new (152,677 samples, 0.02%)
__gnu_cxx::__aligned_membuf<std::pair<ns3::Scheduler::EventKey const, ns3::EventImpl*> >::_M_ptr (443,193 samples, 0.05%)
ns3::Ptr<ns3::SpectrumValue const>::~Ptr (192,870 samples, 0.02%)
ns3::Ptr<ns3::LteControlMessage>::Acquire (316,058 samples, 0.03%)
ns3::LteSpectrumPhy::GetRxSpectrumModel (536,054 samples, 0.06%)
unsigned short* std::vector<unsigned short, std::allocator<unsigned short> >::_M_allocate_and_copy<__gnu_cxx::__normal_iterator<unsigned short const*, std::vector<unsigned short, std::allocator<unsigned short> > > > (745,310 samples, 0.08%)
ns3::LteSpectrumPhy::SetTxPowerSpectralDensity (503,325 samples, 0.05%)
std::vector<int, std::allocator<int> >::_M_check_len (187,285 samples, 0.02%)
ns3::Time::FromDouble (185,818 samples, 0.02%)
(153,603 samples, 0.02%)
std::set<unsigned short, std::less<unsigned short>, std::allocator<unsigned short> >::find (1,768,438 samples, 0.18%)
unsigned long* std::__niter_wrap<unsigned long*> (153,241 samples, 0.02%)
__gnu_cxx::__normal_iterator<double*, std::vector<double, std::allocator<double> > > std::__copy_move_a<false, __gnu_cxx::__normal_iterator<double const*, std::vector<double, std::allocator<double> > >, __gnu_cxx::__normal_iterator<double*, std::vector<double, std::allocator<double> > > > (377,397 samples, 0.04%)
operator new (169,207 samples, 0.02%)
ns3::Ptr<ns3::SpectrumPhy> ns3::Object::GetObject<ns3::SpectrumPhy> (1,036,584 samples, 0.11%)
void std::__cxx11::list<ns3::Ptr<ns3::LteControlMessage>, std::allocator<ns3::Ptr<ns3::LteControlMessage> > >::_M_initialize_dispatch<std::_List_const_iterator<ns3::Ptr<ns3::LteControlMessage> > > (645,888 samples, 0.07%)
ns3::FfMacSchedSapUser::SchedDlConfigIndParameters::~SchedDlConfigIndParameters (210,908 samples, 0.02%)
ns3::DefaultSimulatorImpl::Destroy (238,924 samples, 0.02%)
ns3::BsrLteControlMessage::GetBsr (1,058,333 samples, 0.11%)
std::_Vector_base<unsigned char, std::allocator<unsigned char> >::_Vector_base (222,716 samples, 0.02%)
ns3::LteEnbMac::DoReportBufferStatus (682,380 samples, 0.07%)
void std::destroy_at<ns3::Ptr<ns3::PacketBurst> > (359,626 samples, 0.04%)
double* std::copy<__gnu_cxx::__normal_iterator<double const*, std::vector<double, std::allocator<double> > >, double*> (291,489 samples, 0.03%)
ns3::Ptr<ns3::PacketBurst> ns3::CreateObject<ns3::PacketBurst> (2,205,090 samples, 0.23%)
ns3::Ptr<ns3::UlDciLteControlMessage>::~Ptr (167,122 samples, 0.02%)
std::_Vector_base<unsigned char, std::allocator<unsigned char> >::_M_allocate (499,536 samples, 0.05%)
std::_Rb_tree<unsigned int, std::pair<unsigned int const, ns3::Ptr<ns3::SpectrumValue> >, std::_Select1st<std::pair<unsigned int const, ns3::Ptr<ns3::SpectrumValue> > >, std::less<unsigned int>, std::allocator<std::pair<unsigned int const, ns3::Ptr<ns3::SpectrumValue> > > >::_S_key (128,223 samples, 0.01%)
unsigned char* std::__uninitialized_copy<true>::__uninit_copy<__gnu_cxx::__normal_iterator<unsigned char const*, std::vector<unsigned char, std::allocator<unsigned char> > >, unsigned char*> (150,938 samples, 0.02%)
double* std::__uninitialized_default_n_a<double*, unsigned long, double> (538,098 samples, 0.06%)
unsigned char* std::__copy_move_a<false, __gnu_cxx::__normal_iterator<unsigned char const*, std::vector<unsigned char, std::allocator<unsigned char> > >, unsigned char*> (242,076 samples, 0.02%)
ns3::EventId::operator= (656,172 samples, 0.07%)
std::vector<ns3::CqiListElement_s, std::allocator<ns3::CqiListElement_s> >::erase (1,047,417 samples, 0.11%)
(142,163 samples, 0.01%)
std::_Rb_tree_node<std::pair<unsigned int const, ns3::Ptr<ns3::SpectrumValue> > >* std::_Rb_tree<unsigned int, std::pair<unsigned int const, ns3::Ptr<ns3::SpectrumValue> >, std::_Select1st<std::pair<unsigned int const, ns3::Ptr<ns3::SpectrumValue> > >, std::less<unsigned int>, std::allocator<std::pair<unsigned int const, ns3::Ptr<ns3::SpectrumValue> > > >::_M_create_node<std::pair<unsigned int const, ns3::Ptr<ns3::SpectrumValue> > const&> (200,295 samples, 0.02%)
std::vector<unsigned char, std::allocator<unsigned char> >::vector (234,615 samples, 0.02%)
__gnu_cxx::__normal_iterator<unsigned char*, std::vector<unsigned char, std::allocator<unsigned char> > > std::copy<__gnu_cxx::__normal_iterator<unsigned char const*, std::vector<unsigned char, std::allocator<unsigned char> > >, __gnu_cxx::__normal_iterator<unsigned char*, std::vector<unsigned char, std::allocator<unsigned char> > > > (125,103 samples, 0.01%)
std::vector<unsigned char, std::allocator<unsigned char> >::operator= (348,625 samples, 0.04%)
std::_Rb_tree_iterator<std::pair<unsigned int const, ns3::Ptr<ns3::SpectrumValue> > > std::_Rb_tree<unsigned int, std::pair<unsigned int const, ns3::Ptr<ns3::SpectrumValue> >, std::_Select1st<std::pair<unsigned int const, ns3::Ptr<ns3::SpectrumValue> > >, std::less<unsigned int>, std::allocator<std::pair<unsigned int const, ns3::Ptr<ns3::SpectrumValue> > > >::_M_emplace_hint_unique<unsigned int const&, ns3::Ptr<ns3::SpectrumValue>&> (1,502,471 samples, 0.15%)
ns3::Callback<void, ns3::SpectrumValue const&>::operator (35,103,998 samples, 3.62%) n..
void std::_Destroy_aux<false>::__destroy<ns3::Ptr<ns3::Object>*> (124,479 samples, 0.01%)
std::map<unsigned short, std::vector<unsigned short, std::allocator<unsigned short> >, std::less<unsigned short>, std::allocator<std::pair<unsigned short const, std::vector<unsigned short, std::allocator<unsigned short> > > > >::operator[] (339,246 samples, 0.03%)
unsigned char* std::copy<__gnu_cxx::__normal_iterator<unsigned char const*, std::vector<unsigned char, std::allocator<unsigned char> > >, unsigned char*> (388,698 samples, 0.04%)
ns3::MultiModelSpectrumChannel::StartTx (29,239,922 samples, 3.02%) n..
ns3::Ptr<ns3::EventImpl>::operator= (817,259 samples, 0.08%)
ns3::SpectrumValue::~SpectrumValue (158,082 samples, 0.02%)
std::_Rb_tree<unsigned short, std::pair<unsigned short const, std::vector<double, std::allocator<double> > >, std::_Select1st<std::pair<unsigned short const, std::vector<double, std::allocator<double> > > >, std::less<unsigned short>, std::allocator<std::pair<unsigned short const, std::vector<double, std::allocator<double> > > > >::_S_minimum (352,600 samples, 0.04%)
ns3::Angles::NormalizeAngles (303,214 samples, 0.03%)
std::_Rb_tree_const_iterator<std::pair<ns3::Scheduler::EventKey const, ns3::EventImpl*> >::_M_const_cast (162,110 samples, 0.02%)
void std::_Destroy_aux<false>::__destroy<ns3::DlInfoListElement_s*> (1,227,211 samples, 0.13%)
std::__cxx11::_List_base<ns3::UlDciLteControlMessage, std::allocator<ns3::UlDciLteControlMessage> >::_M_get_Node_allocator (237,959 samples, 0.02%)
std::vector<ns3::DlInfoListElement_s::HarqStatus_e, std::allocator<ns3::DlInfoListElement_s::HarqStatus_e> >::at (195,616 samples, 0.02%)
std::_Rb_tree_node<std::pair<int const, double> >* std::_Rb_tree<int, std::pair<int const, double>, std::_Select1st<std::pair<int const, double> >, std::less<int>, std::allocator<std::pair<int const, double> > >::_Alloc_node::operator (540,906 samples, 0.06%)
ns3::LteRadioBearerTag::Serialize (424,109 samples, 0.04%)
ns3::DlDciLteControlMessage::DlDciLteControlMessage (1,384,545 samples, 0.14%)
ns3::LteEnbPhy::DoSendLteControlMessage (498,633 samples, 0.05%)
std::_Rb_tree<unsigned char, std::pair<unsigned char const, ns3::LteMacSapProvider*>, std::_Select1st<std::pair<unsigned char const, ns3::LteMacSapProvider*> >, std::less<unsigned char>, std::allocator<std::pair<unsigned char const, ns3::LteMacSapProvider*> > >::_M_lower_bound (393,630 samples, 0.04%)
ns3::CeBitmap_e* std::__copy_move_a<false, __gnu_cxx::__normal_iterator<ns3::CeBitmap_e const*, std::vector<ns3::CeBitmap_e, std::allocator<ns3::CeBitmap_e> > >, ns3::CeBitmap_e*> (340,009 samples, 0.04%)
std::_Vector_base<double, std::allocator<double> >::_M_create_storage (163,185 samples, 0.02%)
void std::_Destroy<std::vector<ns3::RlcPduListElement_s, std::allocator<ns3::RlcPduListElement_s> >*> (240,649 samples, 0.02%)
std::vector<ns3::RlcPduListElement_s, std::allocator<ns3::RlcPduListElement_s> >::vector (252,039 samples, 0.03%)
ns3::MakeEvent<void (5,510,444 samples, 0.57%)
void std::_Destroy<ns3::CqiListElement_s*, ns3::CqiListElement_s> (970,280 samples, 0.10%)
ns3::LteRlcSm::DoNotifyTxOpportunity (1,376,216 samples, 0.14%)
ns3::Ptr<ns3::PacketBurst>::operator= (158,753 samples, 0.02%)
void std::_Destroy_aux<false>::__destroy<ns3::UlInfoListElement_s*> (228,697 samples, 0.02%)
std::_Rb_tree<unsigned char, std::pair<unsigned char const, ns3::LteMacSapProvider*>, std::_Select1st<std::pair<unsigned char const, ns3::LteMacSapProvider*> >, std::less<unsigned char>, std::allocator<std::pair<unsigned char const, ns3::LteMacSapProvider*> > >::end (156,019 samples, 0.02%)
ns3::Tag::Tag (166,039 samples, 0.02%)
std::_Rb_tree_iterator<std::pair<unsigned short const, std::vector<double, std::allocator<double> > > >::operator* (200,943 samples, 0.02%)
std::map<unsigned short, unsigned char, std::less<unsigned short>, std::allocator<std::pair<unsigned short const, unsigned char> > >::find (887,061 samples, 0.09%)
ns3::Ptr<ns3::Packet>::~Ptr (985,329 samples, 0.10%)
std::_Rb_tree<unsigned short, std::pair<unsigned short const, std::vector<unsigned short, std::allocator<unsigned short> > >, std::_Select1st<std::pair<unsigned short const, std::vector<unsigned short, std::allocator<unsigned short> > > >, std::less<unsigned short>, std::allocator<std::pair<unsigned short const, std::vector<unsigned short, std::allocator<unsigned short> > > > >::lower_bound (455,631 samples, 0.05%)
std::_Rb_tree<unsigned char, std::pair<unsigned char const, ns3::LteMacSapProvider*>, std::_Select1st<std::pair<unsigned char const, ns3::LteMacSapProvider*> >, std::less<unsigned char>, std::allocator<std::pair<unsigned char const, ns3::LteMacSapProvider*> > >::_M_end (207,877 samples, 0.02%)
ns3::Ptr<ns3::LteAmc>::operator (193,493 samples, 0.02%)
ns3::HigherLayerSelected_s* std::uninitialized_copy<__gnu_cxx::__normal_iterator<ns3::HigherLayerSelected_s const*, std::vector<ns3::HigherLayerSelected_s, std::allocator<ns3::HigherLayerSelected_s> > >, ns3::HigherLayerSelected_s*> (821,377 samples, 0.08%)
std::_Rb_tree_iterator<std::pair<ns3::Scheduler::EventKey const, ns3::EventImpl*> > std::_Rb_tree<ns3::Scheduler::EventKey, std::pair<ns3::Scheduler::EventKey const, ns3::EventImpl*>, std::_Select1st<std::pair<ns3::Scheduler::EventKey const, ns3::EventImpl*> >, std::less<ns3::Scheduler::EventKey>, std::allocator<std::pair<ns3::Scheduler::EventKey const, ns3::EventImpl*> > >::_M_emplace_hint_unique<std::pair<ns3::Scheduler::EventKey, ns3::EventImpl*> > (3,653,483 samples, 0.38%)
ns3::SpectrumSignalParameters::~SpectrumSignalParameters (189,718 samples, 0.02%)
ns3::TypeId::GetAttributeN (1,058,658 samples, 0.11%)
std::__invoke_result<void (22,443,594 samples, 2.31%)
(1,100,918 samples, 0.11%)
std::_Tuple_impl<1ul, ns3::Ptr<ns3::SpectrumValue>, double, ns3::Ptr<ns3::SpectrumSignalParameters>, ns3::Ptr<ns3::SpectrumPhy>, std::map<unsigned int, ns3::Ptr<ns3::SpectrumValue>, std::less<unsigned int>, std::allocator<std::pair<unsigned int const, ns3::Ptr<ns3::SpectrumValue> > > > >::_Tuple_impl<ns3::Ptr<ns3::SpectrumValue>&, double&, ns3::Ptr<ns3::SpectrumSignalParameters>&, ns3::Ptr<ns3::SpectrumPhy>&, std::map<unsigned int, ns3::Ptr<ns3::SpectrumValue>, std::less<unsigned int>, std::allocator<std::pair<unsigned int const, ns3::Ptr<ns3::SpectrumValue> > > >&, void> (635,410 samples, 0.07%)
std::_Vector_base<ns3::Ptr<ns3::Object>, std::allocator<ns3::Ptr<ns3::Object> > >::_Vector_base (154,166 samples, 0.02%)
ns3::LteMiErrorModel::Mib (2,166,389 samples, 0.22%)
std::__cxx11::list<ns3::UlDciLteControlMessage, std::allocator<ns3::UlDciLteControlMessage> >::clear (551,743 samples, 0.06%)
ns3::Ptr<ns3::PacketBurst> ns3::CreateObject<ns3::PacketBurst> (267,173 samples, 0.03%)
ns3::CqiListElement_s::~CqiListElement_s (532,379 samples, 0.05%)
std::_Head_base<1ul, ns3::Ptr<ns3::SpectrumValue const>, false>::~_Head_base (896,241 samples, 0.09%)
std::allocator_traits<std::allocator<ns3::DlInfoListElement_s::HarqStatus_e> >::allocate (185,863 samples, 0.02%)
std::map<unsigned char, ns3::LteMacSapProvider::ReportBufferStatusParameters, std::less<unsigned char>, std::allocator<std::pair<unsigned char const, ns3::LteMacSapProvider::ReportBufferStatusParameters> > >::empty (342,978 samples, 0.04%)
__gnu_cxx::__normal_iterator<ns3::DlInfoListElement_s::HarqStatus_e const*, std::vector<ns3::DlInfoListElement_s::HarqStatus_e, std::allocator<ns3::DlInfoListElement_s::HarqStatus_e> > > std::__miter_base<__gnu_cxx::__normal_iterator<ns3::DlInfoListElement_s::HarqStatus_e const*, std::vector<ns3::DlInfoListElement_s::HarqStatus_e, std::allocator<ns3::DlInfoListElement_s::HarqStatus_e> > > > (190,102 samples, 0.02%)
malloc (190,161 samples, 0.02%)
__gnu_cxx::__normal_iterator<ns3::Ptr<ns3::PacketBurst>*, std::vector<ns3::Ptr<ns3::PacketBurst>, std::allocator<ns3::Ptr<ns3::PacketBurst> > > > std::__copy_move_a<true, __gnu_cxx::__normal_iterator<ns3::Ptr<ns3::PacketBurst>*, std::vector<ns3::Ptr<ns3::PacketBurst>, std::allocator<ns3::Ptr<ns3::PacketBurst> > > >, __gnu_cxx::__normal_iterator<ns3::Ptr<ns3::PacketBurst>*, std::vector<ns3::Ptr<ns3::PacketBurst>, std::allocator<ns3::Ptr<ns3::PacketBurst> > > > > (2,253,875 samples, 0.23%)
(168,179 samples, 0.02%)
ns3::PacketTagList::RemoveAll (323,410 samples, 0.03%)
std::__detail::_List_node_header::_M_move_nodes (181,701 samples, 0.02%)
std::_Rb_tree_key_compare<std::less<unsigned short> >::_Rb_tree_key_compare (269,610 samples, 0.03%)
std::_Vector_base<double, std::allocator<double> >::_Vector_base (863,125 samples, 0.09%)
std::_Head_base<1ul, ns3::Ptr<ns3::SpectrumValue const>, false>::_Head_base<ns3::Ptr<ns3::SpectrumValue const>&> (302,346 samples, 0.03%)
ns3::tbInfo_t::~tbInfo_t (151,450 samples, 0.02%)
void std::__cxx11::list<ns3::Ptr<ns3::LteControlMessage>, std::allocator<ns3::Ptr<ns3::LteControlMessage> > >::_M_initialize_dispatch<std::_List_const_iterator<ns3::Ptr<ns3::LteControlMessage> > > (225,934 samples, 0.02%)
std::_Rb_tree<ns3::Scheduler::EventKey, std::pair<ns3::Scheduler::EventKey const, ns3::EventImpl*>, std::_Select1st<std::pair<ns3::Scheduler::EventKey const, ns3::EventImpl*> >, std::less<ns3::Scheduler::EventKey>, std::allocator<std::pair<ns3::Scheduler::EventKey const, ns3::EventImpl*> > >::_M_put_node (1,157,136 samples, 0.12%)
std::__cxx11::list<ns3::UlDciLteControlMessage, std::allocator<ns3::UlDciLteControlMessage> >* std::__copy_move<true, false, std::random_access_iterator_tag>::__copy_m<std::__cxx11::list<ns3::UlDciLteControlMessage, std::allocator<ns3::UlDciLteControlMessage> >*, std::__cxx11::list<ns3::UlDciLteControlMessage, std::allocator<ns3::UlDciLteControlMessage> >*> (1,471,329 samples, 0.15%)
ns3::HarqProcessInfoElement_t* std::__copy_move_a<false, __gnu_cxx::__normal_iterator<ns3::HarqProcessInfoElement_t const*, std::vector<ns3::HarqProcessInfoElement_t, std::allocator<ns3::HarqProcessInfoElement_t> > >, ns3::HarqProcessInfoElement_t*> (1,298,579 samples, 0.13%)
ns3::LteEnbPhy::StartSubFrame (2,983,151 samples, 0.31%)
std::__detail::_List_node_header::_M_move_nodes (375,374 samples, 0.04%)
void std::_Rb_tree<unsigned int, std::pair<unsigned int const, ns3::Ptr<ns3::SpectrumValue> >, std::_Select1st<std::pair<unsigned int const, ns3::Ptr<ns3::SpectrumValue> > >, std::less<unsigned int>, std::allocator<std::pair<unsigned int const, ns3::Ptr<ns3::SpectrumValue> > > >::_M_construct_node<unsigned int const&, ns3::Ptr<ns3::SpectrumValue>&> (576,441 samples, 0.06%)
std::__cxx11::list<ns3::Callback<void, ns3::Ptr<ns3::PacketBurst const> >, std::allocator<ns3::Callback<void, ns3::Ptr<ns3::PacketBurst const> > > >::begin (202,714 samples, 0.02%)
unsigned int const& std::__pair_get<0ul>::__move_get<unsigned int const&, ns3::Ptr<ns3::SpectrumValue>&> (150,244 samples, 0.02%)
std::vector<ns3::DlInfoListElement_s::HarqStatus_e, std::allocator<ns3::DlInfoListElement_s::HarqStatus_e> >::vector (152,454 samples, 0.02%)
std::vector<ns3::HigherLayerSelected_s, std::allocator<ns3::HigherLayerSelected_s> >::operator= (427,945 samples, 0.04%)
__gnu_cxx::__aligned_membuf<std::pair<unsigned short const, unsigned char> >::_M_addr (164,052 samples, 0.02%)
void std::allocator_traits<std::allocator<std::_Rb_tree_node<std::pair<ns3::Scheduler::EventKey const, ns3::EventImpl*> > > >::construct<std::pair<ns3::Scheduler::EventKey const, ns3::EventImpl*>, std::pair<ns3::Scheduler::EventKey, ns3::EventImpl*> > (363,009 samples, 0.04%)
std::_Rb_tree_node<std::pair<ns3::LteFlowId_t const, ns3::FfMacSchedSapProvider::SchedDlRlcBufferReqParameters> >::_M_valptr (306,649 samples, 0.03%)
ns3::LteEnbMac::DoSchedDlConfigInd (33,880,851 samples, 3.49%) n..
ns3::LteSpectrumPhy::GetMobility (284,534 samples, 0.03%)
std::_Bit_iterator std::copy<std::_Bit_const_iterator, std::_Bit_iterator> (614,787 samples, 0.06%)
double* std::__copy_move_a1<false, double const*, double*> (368,836 samples, 0.04%)
void std::__cxx11::list<ns3::Ptr<ns3::Packet>, std::allocator<ns3::Ptr<ns3::Packet> > >::_M_insert<ns3::Ptr<ns3::Packet> const&> (234,373 samples, 0.02%)
ns3::PfFfMacScheduler::RefreshHarqProcesses (154,047 samples, 0.02%)
ns3::Time::FromDouble (2,083,512 samples, 0.21%)
std::__cxx11::list<ns3::Ptr<ns3::LteControlMessage>, std::allocator<ns3::Ptr<ns3::LteControlMessage> > >::push_back (337,881 samples, 0.03%)
std::vector<ns3::Ptr<ns3::Object>, std::allocator<ns3::Ptr<ns3::Object> > >::_M_erase_at_end (153,047 samples, 0.02%)
ns3::Ptr<ns3::LteControlMessage>& std::__cxx11::list<ns3::Ptr<ns3::LteControlMessage>, std::allocator<ns3::Ptr<ns3::LteControlMessage> > >::emplace_back<ns3::Ptr<ns3::LteControlMessage> const&> (2,163,597 samples, 0.22%)
std::_List_node<ns3::Ptr<ns3::LteControlMessage> >* std::__cxx11::list<ns3::Ptr<ns3::LteControlMessage>, std::allocator<ns3::Ptr<ns3::LteControlMessage> > >::_M_create_node<ns3::Ptr<ns3::LteControlMessage> const&> (228,584 samples, 0.02%)
ns3::EventId::EventId (1,674,500 samples, 0.17%)
ns3::EventId ns3::Simulator::Schedule<void (8,521,614 samples, 0.88%)
ns3::LteRlcSpecificLteMacSapUser::NotifyTxOpportunity (192,143 samples, 0.02%)
void std::allocator_traits<std::allocator<std::_List_node<ns3::Ptr<ns3::Packet> > > >::destroy<ns3::Ptr<ns3::Packet> > (1,143,303 samples, 0.12%)
ns3::DefaultSimulatorImpl::ScheduleWithContext (475,136 samples, 0.05%)
unsigned char* std::__uninitialized_copy_a<__gnu_cxx::__normal_iterator<unsigned char const*, std::vector<unsigned char, std::allocator<unsigned char> > >, unsigned char*, unsigned char> (356,896 samples, 0.04%)
ns3::Ptr<ns3::SpectrumValue const>::operator* (203,182 samples, 0.02%)
ns3::Time::GetNanoSeconds (316,166 samples, 0.03%)
std::map<unsigned short, ns3::LteEnbComponentCarrierManager::UeInfo, std::less<unsigned short>, std::allocator<std::pair<unsigned short const, ns3::LteEnbComponentCarrierManager::UeInfo> > >::end (195,237 samples, 0.02%)
std::_Rb_tree<unsigned int, std::pair<unsigned int const, ns3::Ptr<ns3::SpectrumValue> >, std::_Select1st<std::pair<unsigned int const, ns3::Ptr<ns3::SpectrumValue> > >, std::less<unsigned int>, std::allocator<std::pair<unsigned int const, ns3::Ptr<ns3::SpectrumValue> > > >::_M_get_insert_hint_unique_pos (232,404 samples, 0.02%)
std::map<ns3::TbId_t, ns3::tbInfo_t, std::less<ns3::TbId_t>, std::allocator<std::pair<ns3::TbId_t const, ns3::tbInfo_t> > >::find (186,148 samples, 0.02%)
std::__cxx11::list<ns3::Ptr<ns3::LteControlMessage>, std::allocator<ns3::Ptr<ns3::LteControlMessage> > >::push_back (1,860,199 samples, 0.19%)
ns3::SpectrumConverter::Convert (333,104 samples, 0.03%)
ns3::LteEnbPhy*& std::__get_helper<0ul, ns3::LteEnbPhy*> (377,927 samples, 0.04%)
pthread_self@plt (151,149 samples, 0.02%)
std::_Rb_tree_rebalance_for_erase (551,017 samples, 0.06%)
ns3::MultiModelSpectrumChannel::FindAndEventuallyAddTxSpectrumModel (1,340,325 samples, 0.14%)
ns3::LteInterference::DoAddSignal (2,731,360 samples, 0.28%)
std::tuple<ns3::MultiModelSpectrumChannel*, ns3::Ptr<ns3::SpectrumValue>, double, ns3::Ptr<ns3::SpectrumSignalParameters>, ns3::Ptr<ns3::SpectrumPhy>, std::map<unsigned int, ns3::Ptr<ns3::SpectrumValue>, std::less<unsigned int>, std::allocator<std::pair<unsigned int const, ns3::Ptr<ns3::SpectrumValue> > > > >::tuple<ns3::MultiModelSpectrumChannel*&, ns3::Ptr<ns3::SpectrumValue>&, double&, ns3::Ptr<ns3::SpectrumSignalParameters>&, ns3::Ptr<ns3::SpectrumPhy>&, std::map<unsigned int, ns3::Ptr<ns3::SpectrumValue>, std::less<unsigned int>, std::allocator<std::pair<unsigned int const, ns3::Ptr<ns3::SpectrumValue> > > >&, true, true> (714,235 samples, 0.07%)
__gnu_cxx::__aligned_membuf<std::pair<unsigned int const, ns3::TxSpectrumModelInfo> >::_M_ptr (375,886 samples, 0.04%)
std::_Rb_tree<ns3::LteFlowId_t, std::pair<ns3::LteFlowId_t const, ns3::FfMacSchedSapProvider::SchedDlRlcBufferReqParameters>, std::_Select1st<std::pair<ns3::LteFlowId_t const, ns3::FfMacSchedSapProvider::SchedDlRlcBufferReqParameters> >, std::less<ns3::LteFlowId_t>, std::allocator<std::pair<ns3::LteFlowId_t const, ns3::FfMacSchedSapProvider::SchedDlRlcBufferReqParameters> > >::_S_key (303,374 samples, 0.03%)
ns3::EventImpl::~EventImpl (201,506 samples, 0.02%)
__gnu_cxx::__normal_iterator<ns3::DlInfoListElement_s::HarqStatus_e const*, std::vector<ns3::DlInfoListElement_s::HarqStatus_e, std::allocator<ns3::DlInfoListElement_s::HarqStatus_e> > >::base (160,882 samples, 0.02%)
std::vector<unsigned short, std::allocator<unsigned short> >::push_back (3,560,217 samples, 0.37%)
std::__cxx11::list<ns3::Ptr<ns3::LteControlMessage>, std::allocator<ns3::Ptr<ns3::LteControlMessage> > >* std::__copy_move_a1<true, std::__cxx11::list<ns3::Ptr<ns3::LteControlMessage>, std::allocator<ns3::Ptr<ns3::LteControlMessage> > >*, std::__cxx11::list<ns3::Ptr<ns3::LteControlMessage>, std::allocator<ns3::Ptr<ns3::LteControlMessage> > >*> (189,156 samples, 0.02%)
std::pair<std::_Rb_tree_node_base*, std::_Rb_tree_node_base*>::pair<std::_Rb_tree_node_base*&, std::_Rb_tree_node_base*&> (149,261 samples, 0.02%)
std::_Rb_tree<unsigned short, std::pair<unsigned short const, double>, std::_Select1st<std::pair<unsigned short const, double> >, std::less<unsigned short>, std::allocator<std::pair<unsigned short const, double> > >::_M_mbegin (153,413 samples, 0.02%)
std::_List_const_iterator<ns3::Ptr<ns3::LteControlMessage> >::operator++ (234,590 samples, 0.02%)
std::_Vector_base<ns3::HarqProcessInfoElement_t, std::allocator<ns3::HarqProcessInfoElement_t> >::_M_allocate (239,647 samples, 0.02%)
ns3::Ptr<ns3::SpectrumValue>::operator= (757,202 samples, 0.08%)
ns3::SimpleRefCount<ns3::SpectrumModel, ns3::Empty, ns3::DefaultDeleter<ns3::SpectrumModel> >::Ref (142,470 samples, 0.01%)
ns3::LteRadioBearerTag::GetInstanceTypeId (237,147 samples, 0.02%)
ns3::LteSpectrumSignalParametersDataFrame::~LteSpectrumSignalParametersDataFrame (3,401,494 samples, 0.35%)
std::enable_if<std::is_constructible<std::pair<ns3::Scheduler::EventKey const, ns3::EventImpl*>, std::pair<ns3::Scheduler::EventKey, ns3::EventImpl*> >::value, std::pair<std::_Rb_tree_iterator<std::pair<ns3::Scheduler::EventKey const, ns3::EventImpl*> >, bool> >::type std::map<ns3::Scheduler::EventKey, ns3::EventImpl*, std::less<ns3::Scheduler::EventKey>, std::allocator<std::pair<ns3::Scheduler::EventKey const, ns3::EventImpl*> > >::insert<std::pair<ns3::Scheduler::EventKey, ns3::EventImpl*> > (890,212 samples, 0.09%)
ns3::ObjectBase::ConstructSelf (2,247,437 samples, 0.23%)
std::__allocated_ptr<std::allocator<std::_List_node<ns3::Ptr<ns3::LteControlMessage> > > >::__allocated_ptr (192,427 samples, 0.02%)
ns3::PacketBurst::Copy (696,783 samples, 0.07%)
std::__cxx11::list<ns3::Ptr<ns3::Packet>, std::allocator<ns3::Ptr<ns3::Packet> > >::list (190,083 samples, 0.02%)
std::__new_allocator<double>::allocate (187,232 samples, 0.02%)
void std::__cxx11::list<ns3::Ptr<ns3::LteControlMessage>, std::allocator<ns3::Ptr<ns3::LteControlMessage> > >::_M_insert<ns3::Ptr<ns3::LteControlMessage> const&> (480,171 samples, 0.05%)
std::__cxx11::list<ns3::Ptr<ns3::Packet>, std::allocator<ns3::Ptr<ns3::Packet> > >::list (635,025 samples, 0.07%)
ns3::PacketBurst::~PacketBurst (1,859,304 samples, 0.19%)
std::pair<unsigned short const, std::vector<double, std::allocator<double> > >::~pair (193,911 samples, 0.02%)
std::_Vector_base<unsigned char, std::allocator<unsigned char> >::_Vector_base (153,635 samples, 0.02%)
void std::allocator_traits<std::allocator<std::_List_node<ns3::Ptr<ns3::Packet> > > >::destroy<ns3::Ptr<ns3::Packet> > (392,648 samples, 0.04%)
std::__cxx11::list<ns3::Ptr<ns3::LteControlMessage>, std::allocator<ns3::Ptr<ns3::LteControlMessage> > >* std::__copy_move_a1<true, std::__cxx11::list<ns3::Ptr<ns3::LteControlMessage>, std::allocator<ns3::Ptr<ns3::LteControlMessage> > >*, std::__cxx11::list<ns3::Ptr<ns3::LteControlMessage>, std::allocator<ns3::Ptr<ns3::LteControlMessage> > >*> (843,550 samples, 0.09%)
ns3::Simulator::DoSchedule (2,399,693 samples, 0.25%)
ns3::Singleton<ns3::IidManager>::Get (322,923 samples, 0.03%)
ns3::TypeId::GetParent (436,938 samples, 0.05%)
std::_Vector_base<unsigned char, std::allocator<unsigned char> >::~_Vector_base (440,906 samples, 0.05%)
(167,770 samples, 0.02%)
unsigned char* std::copy<__gnu_cxx::__normal_iterator<unsigned char const*, std::vector<unsigned char, std::allocator<unsigned char> > >, unsigned char*> (150,938 samples, 0.02%)
[libm.so.6] (236,481 samples, 0.02%)
unsigned short* std::__uninitialized_copy_a<__gnu_cxx::__normal_iterator<unsigned short const*, std::vector<unsigned short, std::allocator<unsigned short> > >, unsigned short*, unsigned short> (893,468 samples, 0.09%)
__gnu_cxx::__normal_iterator<double const*, std::vector<double, std::allocator<double> > >::__normal_iterator (279,119 samples, 0.03%)
std::_Rb_tree<ns3::Scheduler::EventKey, std::pair<ns3::Scheduler::EventKey const, ns3::EventImpl*>, std::_Select1st<std::pair<ns3::Scheduler::EventKey const, ns3::EventImpl*> >, std::less<ns3::Scheduler::EventKey>, std::allocator<std::pair<ns3::Scheduler::EventKey const, ns3::EventImpl*> > >::_S_key (764,919 samples, 0.08%)
ns3::LteInterference::AddSignal (11,691,674 samples, 1.21%)
ns3::int64x64_t::int64x64_t (150,413 samples, 0.02%)
std::vector<double, std::allocator<double> >::vector (1,002,557 samples, 0.10%)
std::_Function_handler<void (20,810,198 samples, 2.15%)
std::_Rb_tree<unsigned short, std::pair<unsigned short const, unsigned char>, std::_Select1st<std::pair<unsigned short const, unsigned char> >, std::less<unsigned short>, std::allocator<std::pair<unsigned short const, unsigned char> > >::_S_key (552,315 samples, 0.06%)
std::vector<double, std::allocator<double> >::_M_default_initialize (574,140 samples, 0.06%)
std::map<unsigned int, ns3::Ptr<ns3::SpectrumValue>, std::less<unsigned int>, std::allocator<std::pair<unsigned int const, ns3::Ptr<ns3::SpectrumValue> > > >::map (449,666 samples, 0.05%)
std::vector<unsigned char, std::allocator<unsigned char> >::push_back (3,070,728 samples, 0.32%)
ns3::MakeEvent<void (709,970 samples, 0.07%)
ns3::Ptr<ns3::Packet> ns3::Create<ns3::Packet, unsigned int&> (501,720 samples, 0.05%)
std::_List_iterator<ns3::Ptr<ns3::LteControlMessage> >::operator++ (150,969 samples, 0.02%)
std::vector<bool, std::allocator<bool> >::at (245,216 samples, 0.03%)
void std::destroy_at<ns3::Ptr<ns3::LteControlMessage> > (269,841 samples, 0.03%)
ns3::Ptr<ns3::Packet>::Ptr (193,783 samples, 0.02%)
std::__cxx11::_List_base<ns3::Ptr<ns3::Packet>, std::allocator<ns3::Ptr<ns3::Packet> > >::_M_clear (860,343 samples, 0.09%)
decltype (189,123 samples, 0.02%)
std::tuple<double const&, double const&, double const&> std::tie<double const, double const, double const> (1,173,308 samples, 0.12%)
ns3::RarLteControlMessage::~RarLteControlMessage (509,242 samples, 0.05%)
std::map<unsigned short, ns3::Ptr<ns3::UeManager>, std::less<unsigned short>, std::allocator<std::pair<unsigned short const, ns3::Ptr<ns3::UeManager> > > >::find (1,529,532 samples, 0.16%)
__gnu_cxx::__normal_iterator<ns3::Ptr<ns3::PacketBurst>*, std::vector<ns3::Ptr<ns3::PacketBurst>, std::allocator<ns3::Ptr<ns3::PacketBurst> > > > std::move<__gnu_cxx::__normal_iterator<ns3::Ptr<ns3::PacketBurst>*, std::vector<ns3::Ptr<ns3::PacketBurst>, std::allocator<ns3::Ptr<ns3::PacketBurst> > > >, __gnu_cxx::__normal_iterator<ns3::Ptr<ns3::PacketBurst>*, std::vector<ns3::Ptr<ns3::PacketBurst>, std::allocator<ns3::Ptr<ns3::PacketBurst> > > > > (2,253,875 samples, 0.23%)
std::vector<int, std::allocator<int> >::push_back (2,809,773 samples, 0.29%)
std::_Vector_base<ns3::VendorSpecificListElement_s, std::allocator<ns3::VendorSpecificListElement_s> >::_Vector_impl::_Vector_impl (157,554 samples, 0.02%)
std::_Select1st<std::pair<unsigned short const, double> >::operator (261,404 samples, 0.03%)
std::_Rb_tree<unsigned char, std::pair<unsigned char const, ns3::LteMacSapProvider*>, std::_Select1st<std::pair<unsigned char const, ns3::LteMacSapProvider*> >, std::less<unsigned char>, std::allocator<std::pair<unsigned char const, ns3::LteMacSapProvider*> > >::end (126,641 samples, 0.01%)
ns3::LteSpectrumSignalParametersDlCtrlFrame::Copy (7,245,802 samples, 0.75%)
ns3::MapScheduler::Insert (10,424,431 samples, 1.07%)
std::map<unsigned short, std::vector<double, std::allocator<double> >, std::less<unsigned short>, std::allocator<std::pair<unsigned short const, std::vector<double, std::allocator<double> > > > >::~map (1,140,266 samples, 0.12%)
std::_Bit_iterator::operator[] (162,486 samples, 0.02%)
void std::__cxx11::list<ns3::Ptr<ns3::LteControlMessage>, std::allocator<ns3::Ptr<ns3::LteControlMessage> > >::_M_insert<ns3::Ptr<ns3::LteControlMessage> const&> (304,758 samples, 0.03%)
unsigned short* std::__uninitialized_fill_n<true>::__uninit_fill_n<unsigned short*, unsigned long, unsigned short> (819,768 samples, 0.08%)
std::_Rb_tree<int, std::pair<int const, double>, std::_Select1st<std::pair<int const, double> >, std::less<int>, std::allocator<std::pair<int const, double> > >::_M_erase (325,437 samples, 0.03%)
void std::_Construct<ns3::HigherLayerSelected_s, ns3::HigherLayerSelected_s const&> (277,299 samples, 0.03%)
std::vector<bool, std::allocator<bool> >::size (382,898 samples, 0.04%)
std::vector<ns3::Ptr<ns3::Object>, std::allocator<ns3::Ptr<ns3::Object> > >::vector (941,823 samples, 0.10%)
unsigned int& std::_Mu<unsigned int, false, false>::operator (264,404 samples, 0.03%)
std::__cxx11::_List_base<ns3::AttributeConstructionList::Item, std::allocator<ns3::AttributeConstructionList::Item> >::_List_base (461,286 samples, 0.05%)
ns3::LteEnbMac::DoSubframeIndication (4,972,136 samples, 0.51%)
__gnu_cxx::__normal_iterator<double const*, std::vector<double, std::allocator<double> > >::__normal_iterator (161,967 samples, 0.02%)
std::__new_allocator<std::_List_node<ns3::Ptr<ns3::Packet> > >::deallocate (181,716 samples, 0.02%)
ns3::CqiListElement_s* std::__uninitialized_copy_a<__gnu_cxx::__normal_iterator<ns3::CqiListElement_s*, std::vector<ns3::CqiListElement_s, std::allocator<ns3::CqiListElement_s> > >, ns3::CqiListElement_s*, ns3::CqiListElement_s> (1,085,784 samples, 0.11%)
ns3::Time::~Time (227,882 samples, 0.02%)
void std::destroy_at<ns3::Ptr<ns3::Packet> > (827,732 samples, 0.09%)
ns3::Ptr<ns3::LteControlMessage>& std::__cxx11::list<ns3::Ptr<ns3::LteControlMessage>, std::allocator<ns3::Ptr<ns3::LteControlMessage> > >::emplace_back<ns3::Ptr<ns3::LteControlMessage> const&> (180,536 samples, 0.02%)
ns3::Object::~Object (2,269,146 samples, 0.23%)
std::vector<ns3::Ptr<ns3::PacketBurst>, std::allocator<ns3::Ptr<ns3::PacketBurst> > >::push_back (551,584 samples, 0.06%)
void std::_Function_base::_Base_manager<std::_Bind<void (1,947,662 samples, 0.20%)
void std::vector<unsigned short, std::allocator<unsigned short> >::_M_realloc_insert<unsigned short> (2,020,223 samples, 0.21%)
std::_Vector_base<ns3::BuildDataListElement_s, std::allocator<ns3::BuildDataListElement_s> >::_Vector_base (382,238 samples, 0.04%)
std::_Rb_tree_node<std::pair<unsigned char const, ns3::LteMacSapProvider*> >::_M_valptr (354,718 samples, 0.04%)
std::_Rb_tree_node<std::pair<unsigned short const, std::vector<std::vector<ns3::Ptr<ns3::PacketBurst>, std::allocator<ns3::Ptr<ns3::PacketBurst> > >, std::allocator<std::vector<ns3::Ptr<ns3::PacketBurst>, std::allocator<ns3::Ptr<ns3::PacketBurst> > > > > > >::_M_valptr (277,907 samples, 0.03%)
std::map<unsigned char, ns3::LteMacSapProvider*, std::less<unsigned char>, std::allocator<std::pair<unsigned char const, ns3::LteMacSapProvider*> > >::find (393,630 samples, 0.04%)
std::vector<double, std::allocator<double> >::begin (169,080 samples, 0.02%)
std::_Rb_tree<unsigned short, std::pair<unsigned short const, std::map<unsigned char, ns3::LteMacSapUser*, std::less<unsigned char>, std::allocator<std::pair<unsigned char const, ns3::LteMacSapUser*> > > >, std::_Select1st<std::pair<unsigned short const, std::map<unsigned char, ns3::LteMacSapUser*, std::less<unsigned char>, std::allocator<std::pair<unsigned char const, ns3::LteMacSapUser*> > > > >, std::less<unsigned short>, std::allocator<std::pair<unsigned short const, std::map<unsigned char, ns3::LteMacSapUser*, std::less<unsigned char>, std::allocator<std::pair<unsigned char const, ns3::LteMacSapUser*> > > > > >::find (155,011 samples, 0.02%)
std::_Rb_tree<int, std::pair<int const, double>, std::_Select1st<std::pair<int const, double> >, std::less<int>, std::allocator<std::pair<int const, double> > >::_M_erase (743,951 samples, 0.08%)
std::_Rb_tree_insert_and_rebalance (155,976 samples, 0.02%)
ns3::SimpleRefCount<ns3::EventImpl, ns3::Empty, ns3::DefaultDeleter<ns3::EventImpl> >::Unref (9,603,406 samples, 0.99%)
std::map<unsigned short, std::vector<double, std::allocator<double> >, std::less<unsigned short>, std::allocator<std::pair<unsigned short const, std::vector<double, std::allocator<double> > > > >::map (4,812,209 samples, 0.50%)
std::_Rb_tree<unsigned char, std::pair<unsigned char const, ns3::LteCcmMacSapProvider*>, std::_Select1st<std::pair<unsigned char const, ns3::LteCcmMacSapProvider*> >, std::less<unsigned char>, std::allocator<std::pair<unsigned char const, ns3::LteCcmMacSapProvider*> > >::_M_lower_bound (812,518 samples, 0.08%)
std::vector<ns3::VendorSpecificListElement_s, std::allocator<ns3::VendorSpecificListElement_s> >::operator= (1,354,571 samples, 0.14%)
std::map<ns3::Scheduler::EventKey, ns3::EventImpl*, std::less<ns3::Scheduler::EventKey>, std::allocator<std::pair<ns3::Scheduler::EventKey const, ns3::EventImpl*> > >::lower_bound (2,251,041 samples, 0.23%)
ns3::ObjectBase::ConstructSelf (267,173 samples, 0.03%)
std::_Vector_base<ns3::VendorSpecificListElement_s, std::allocator<ns3::VendorSpecificListElement_s> >::_M_get_Tp_allocator (192,155 samples, 0.02%)
std::vector<ns3::DlInfoListElement_s::HarqStatus_e, std::allocator<ns3::DlInfoListElement_s::HarqStatus_e> >::_M_fill_insert (1,581,674 samples, 0.16%)
std::_Rb_tree_node<std::pair<unsigned int const, ns3::Ptr<ns3::SpectrumValue> > >* std::_Rb_tree<unsigned int, std::pair<unsigned int const, ns3::Ptr<ns3::SpectrumValue> >, std::_Select1st<std::pair<unsigned int const, ns3::Ptr<ns3::SpectrumValue> > >, std::less<unsigned int>, std::allocator<std::pair<unsigned int const, ns3::Ptr<ns3::SpectrumValue> > > >::_M_clone_node<false, std::_Rb_tree<unsigned int, std::pair<unsigned int const, ns3::Ptr<ns3::SpectrumValue> >, std::_Select1st<std::pair<unsigned int const, ns3::Ptr<ns3::SpectrumValue> > >, std::less<unsigned int>, std::allocator<std::pair<unsigned int const, ns3::Ptr<ns3::SpectrumValue> > > >::_Alloc_node> (244,239 samples, 0.03%)
ns3::Ptr<ns3::Packet> const& std::forward<ns3::Ptr<ns3::Packet> const&> (183,511 samples, 0.02%)
ns3::Ptr<ns3::UeManager>::Ptr (155,695 samples, 0.02%)
ns3::Ptr<ns3::SpectrumPhy>& std::__get_helper<4ul, ns3::Ptr<ns3::SpectrumPhy>, std::map<unsigned int, ns3::Ptr<ns3::SpectrumValue>, std::less<unsigned int>, std::allocator<std::pair<unsigned int const, ns3::Ptr<ns3::SpectrumValue> > > > > (350,980 samples, 0.04%)
ns3::LogComponent::IsEnabled (240,367 samples, 0.02%)
void std::__cxx11::list<ns3::Ptr<ns3::LteControlMessage>, std::allocator<ns3::Ptr<ns3::LteControlMessage> > >::_M_assign_dispatch<std::_List_const_iterator<ns3::Ptr<ns3::LteControlMessage> > > (2,878,472 samples, 0.30%)
ns3::Simulator::Now (243,501 samples, 0.03%)
unsigned short* std::__uninitialized_copy<true>::__uninit_copy<__gnu_cxx::__normal_iterator<unsigned short const*, std::vector<unsigned short, std::allocator<unsigned short> > >, unsigned short*> (731,227 samples, 0.08%)
ns3::DlInfoListElement_s::HarqStatus_e* std::__uninitialized_copy<true>::__uninit_copy<__gnu_cxx::__normal_iterator<ns3::DlInfoListElement_s::HarqStatus_e const*, std::vector<ns3::DlInfoListElement_s::HarqStatus_e, std::allocator<ns3::DlInfoListElement_s::HarqStatus_e> > >, ns3::DlInfoListElement_s::HarqStatus_e*> (1,860,884 samples, 0.19%)
ns3::PropagationLossModel::CalcRxPower (3,683,031 samples, 0.38%)
std::_Rb_tree<int, std::pair<int const, double>, std::_Select1st<std::pair<int const, double> >, std::less<int>, std::allocator<std::pair<int const, double> > >::_M_erase (351,602 samples, 0.04%)
std::function<void (7,793,846 samples, 0.80%)
ns3::Ptr<ns3::EventImpl>::Acquire (709,181 samples, 0.07%)
int& std::vector<int, std::allocator<int> >::emplace_back<int> (1,496,718 samples, 0.15%)
ns3::HigherLayerSelected_s* std::__uninitialized_copy<false>::__uninit_copy<__gnu_cxx::__normal_iterator<ns3::HigherLayerSelected_s const*, std::vector<ns3::HigherLayerSelected_s, std::allocator<ns3::HigherLayerSelected_s> > >, ns3::HigherLayerSelected_s*> (356,634 samples, 0.04%)
std::__cxx11::list<ns3::Ptr<ns3::Packet>, std::allocator<ns3::Ptr<ns3::Packet> > >::push_back (1,940,647 samples, 0.20%)
std::_List_const_iterator<ns3::Ptr<ns3::LteControlMessage> >::operator* (148,833 samples, 0.02%)
ns3::DefaultSimulatorImpl::GetSystemId (155,576 samples, 0.02%)
ns3::EventImpl::Invoke (892,884,786 samples, 92.07%) ns3::EventImpl::Invoke
std::_Tuple_impl<2ul, double, ns3::Ptr<ns3::SpectrumSignalParameters>, ns3::Ptr<ns3::SpectrumPhy>, std::map<unsigned int, ns3::Ptr<ns3::SpectrumValue>, std::less<unsigned int>, std::allocator<std::pair<unsigned int const, ns3::Ptr<ns3::SpectrumValue> > > > >::_Tuple_impl<double&, ns3::Ptr<ns3::SpectrumSignalParameters>&, ns3::Ptr<ns3::SpectrumPhy>&, std::map<unsigned int, ns3::Ptr<ns3::SpectrumValue>, std::less<unsigned int>, std::allocator<std::pair<unsigned int const, ns3::Ptr<ns3::SpectrumValue> > > >&, void> (476,638 samples, 0.05%)
ns3::LteEnbPhy::StartFrame (314,249 samples, 0.03%)
ns3::SbMeasResult_s::operator= (452,044 samples, 0.05%)
ns3::LteSpectrumPhy*& std::__get_helper<0ul, ns3::LteSpectrumPhy*> (532,195 samples, 0.05%)
ns3::LteEnbPhy::DoSendLteControlMessage (2,809,761 samples, 0.29%)
std::tuple<ns3::LteInterference*, ns3::Ptr<ns3::SpectrumValue const>, unsigned int>::~tuple (489,613 samples, 0.05%)
std::_Vector_base<double, std::allocator<double> >::_M_allocate (168,940 samples, 0.02%)
ns3::PacketBurst::DoDispose (1,239,705 samples, 0.13%)
ns3::TracedCallback<unsigned int, unsigned int, unsigned short, unsigned char, unsigned short, unsigned char>::operator (198,920 samples, 0.02%)
ns3::LteSpectrumPhy* ns3::PeekPointer<ns3::LteSpectrumPhy> (364,052 samples, 0.04%)
ns3::Simulator::DoSchedule (16,091,885 samples, 1.66%)
std::__new_allocator<std::_Rb_tree_node<std::pair<ns3::Scheduler::EventKey const, ns3::EventImpl*> > >::allocate (192,748 samples, 0.02%)
void std::_Destroy<ns3::UlInfoListElement_s> (157,331 samples, 0.02%)
std::_Rb_tree<unsigned short, std::pair<unsigned short const, ns3::LteEnbComponentCarrierManager::UeInfo>, std::_Select1st<std::pair<unsigned short const, ns3::LteEnbComponentCarrierManager::UeInfo> >, std::less<unsigned short>, std::allocator<std::pair<unsigned short const, ns3::LteEnbComponentCarrierManager::UeInfo> > >::_S_key (289,376 samples, 0.03%)
void std::_Destroy_aux<false>::__destroy<ns3::DlInfoListElement_s*> (852,686 samples, 0.09%)
std::_Function_handler<void (324,769 samples, 0.03%)
ns3::DlInfoListElement_s::HarqStatus_e* std::__copy_move_a1<false, ns3::DlInfoListElement_s::HarqStatus_e const*, ns3::DlInfoListElement_s::HarqStatus_e*> (321,532 samples, 0.03%)
std::_Function_base::_Base_manager<void (200,340 samples, 0.02%)
ns3::LteSpectrumPhy::StartRxData (12,537,177 samples, 1.29%)
ns3::LteEnbMac::DoTransmitPdu (579,238 samples, 0.06%)
ns3::LtePhy::GetPacketBurst (30,682,505 samples, 3.16%) n..
ns3::LteEnbPhy::PhyPduReceived (14,218,237 samples, 1.47%)
int* std::__copy_move_a2<false, int const*, int*> (130,133 samples, 0.01%)
bool std::_Function_base::_Base_manager<std::_Bind<void (195,009 samples, 0.02%)
std::vector<int, std::allocator<int> >::_M_check_len (1,020,384 samples, 0.11%)
std::vector<ns3::FfMacSchedSapProvider::SchedUlCqiInfoReqParameters, std::allocator<ns3::FfMacSchedSapProvider::SchedUlCqiInfoReqParameters> >::_M_range_check (158,349 samples, 0.02%)
double* std::fill_n<double*, unsigned long, double> (187,050 samples, 0.02%)
ns3::Ptr<ns3::LteControlMessage>::Ptr (266,180 samples, 0.03%)
void std::fill<std::_Bit_iterator, bool> (148,785 samples, 0.02%)
std::_Vector_base<unsigned char, std::allocator<unsigned char> >::~_Vector_base (160,698 samples, 0.02%)
std::map<unsigned short, std::vector<unsigned short, std::allocator<unsigned short> >, std::less<unsigned short>, std::allocator<std::pair<unsigned short const, std::vector<unsigned short, std::allocator<unsigned short> > > > >::find (842,898 samples, 0.09%)
ns3::TracedCallback<unsigned short, unsigned char, unsigned int>::operator (664,705 samples, 0.07%)
ns3::SpectrumValue::SpectrumValue (716,762 samples, 0.07%)
std::_Select1st<std::pair<unsigned short const, std::map<unsigned char, ns3::LteMacSapUser*, std::less<unsigned char>, std::allocator<std::pair<unsigned char const, ns3::LteMacSapUser*> > > > >::operator (124,333 samples, 0.01%)
std::_Rb_tree_node<std::pair<unsigned int const, ns3::Ptr<ns3::SpectrumValue> > >* std::_Rb_tree<unsigned int, std::pair<unsigned int const, ns3::Ptr<ns3::SpectrumValue> >, std::_Select1st<std::pair<unsigned int const, ns3::Ptr<ns3::SpectrumValue> > >, std::less<unsigned int>, std::allocator<std::pair<unsigned int const, ns3::Ptr<ns3::SpectrumValue> > > >::_M_create_node<std::pair<unsigned int const, ns3::Ptr<ns3::SpectrumValue> > const&> (233,103 samples, 0.02%)
std::_List_iterator<ns3::Ptr<ns3::LteControlMessage> > std::__cxx11::list<ns3::Ptr<ns3::LteControlMessage>, std::allocator<ns3::Ptr<ns3::LteControlMessage> > >::insert<std::_List_const_iterator<ns3::Ptr<ns3::LteControlMessage> >, void> (987,508 samples, 0.10%)
std::_Rb_tree<unsigned int, std::pair<unsigned int const, ns3::Ptr<ns3::SpectrumValue> >, std::_Select1st<std::pair<unsigned int const, ns3::Ptr<ns3::SpectrumValue> > >, std::less<unsigned int>, std::allocator<std::pair<unsigned int const, ns3::Ptr<ns3::SpectrumValue> > > >::_M_copy (156,128 samples, 0.02%)
ns3::SpectrumValue::operator= (1,481,592 samples, 0.15%)
unsigned char* std::uninitialized_copy<__gnu_cxx::__normal_iterator<unsigned char const*, std::vector<unsigned char, std::allocator<unsigned char> > >, unsigned char*> (481,444 samples, 0.05%)
ns3::Ptr<ns3::PacketBurst>::Ptr (159,551 samples, 0.02%)
ns3::LteSpectrumValueHelper::CreateUlTxPowerSpectralDensity (151,318 samples, 0.02%)
std::_Vector_base<unsigned char, std::allocator<unsigned char> >::_Vector_impl_data::_Vector_impl_data (146,089 samples, 0.02%)
std::vector<unsigned char, std::allocator<unsigned char> >::vector (202,804 samples, 0.02%)
ns3::Ptr<ns3::LteSpectrumPhy>::Acquire (332,097 samples, 0.03%)
decltype (146,680 samples, 0.02%)
std::vector<double, std::allocator<double> >::~vector (209,498 samples, 0.02%)
std::pair<std::_Rb_tree_iterator<std::pair<ns3::Scheduler::EventKey const, ns3::EventImpl*> >, bool>::pair (1,137,947 samples, 0.12%)
std::enable_if<is_invocable_r_v<void, void (27,749,977 samples, 2.86%) s..
std::_Rb_tree<unsigned int, std::pair<unsigned int const, ns3::Ptr<ns3::SpectrumValue> >, std::_Select1st<std::pair<unsigned int const, ns3::Ptr<ns3::SpectrumValue> > >, std::less<unsigned int>, std::allocator<std::pair<unsigned int const, ns3::Ptr<ns3::SpectrumValue> > > >::_M_copy (326,142 samples, 0.03%)
std::_List_iterator<ns3::Ptr<ns3::LteControlMessage> >::_List_iterator (196,537 samples, 0.02%)
std::__cxx11::_List_base<ns3::Ptr<ns3::LteControlMessage>, std::allocator<ns3::Ptr<ns3::LteControlMessage> > >::~_List_base (678,895 samples, 0.07%)
std::_Rb_tree_node<std::pair<unsigned char const, ns3::LteMacSapProvider::ReportBufferStatusParameters> >::_M_valptr (187,088 samples, 0.02%)
ns3::SpectrumValue::Copy (422,077 samples, 0.04%)
std::_Tuple_impl<0ul, ns3::LteSpectrumPhy*>::_M_head (369,313 samples, 0.04%)
std::vector<ns3::DlInfoListElement_s::HarqStatus_e, std::allocator<ns3::DlInfoListElement_s::HarqStatus_e> >::_M_check_len (474,800 samples, 0.05%)
ns3::LteEnbPhy::DequeueUlDci[abi:cxx11] (9,233,350 samples, 0.95%)
ns3::Object::Dispose (202,781 samples, 0.02%)
std::_Function_base::_Base_manager<ns3::Callback<void, ns3::UlInfoListElement_s>::Callback<void (442,482 samples, 0.05%)
__gnu_cxx::__aligned_membuf<std::pair<ns3::LteSpectrumModelId const, ns3::Ptr<ns3::SpectrumModel> > >::_M_ptr (156,072 samples, 0.02%)
(193,493 samples, 0.02%)
ns3::HarqProcessInfoElement_t* std::copy<__gnu_cxx::__normal_iterator<ns3::HarqProcessInfoElement_t const*, std::vector<ns3::HarqProcessInfoElement_t, std::allocator<ns3::HarqProcessInfoElement_t> > >, ns3::HarqProcessInfoElement_t*> (185,369 samples, 0.02%)
unsigned char* std::__fill_n_a<unsigned char*, unsigned long, unsigned char> (604,594 samples, 0.06%)
std::vector<ns3::BuildDataListElement_s, std::allocator<ns3::BuildDataListElement_s> >::_M_check_len (351,521 samples, 0.04%)
std::map<unsigned char, ns3::LteUeMac::LcInfo, std::less<unsigned char>, std::allocator<std::pair<unsigned char const, ns3::LteUeMac::LcInfo> > >::begin (638,035 samples, 0.07%)
std::_Vector_base<double, std::allocator<double> >::_Vector_base (603,299 samples, 0.06%)
ns3::Ptr<ns3::LteChunkProcessor>::operator (207,486 samples, 0.02%)
std::vector<ns3::DlInfoListElement_s, std::allocator<ns3::DlInfoListElement_s> >::operator= (2,127,957 samples, 0.22%)
std::_Rb_tree<int, std::pair<int const, double>, std::_Select1st<std::pair<int const, double> >, std::less<int>, std::allocator<std::pair<int const, double> > >::_M_erase (626,961 samples, 0.06%)
__gnu_cxx::__aligned_membuf<std::pair<unsigned char const, ns3::LteUeMac::LcInfo> >::_M_ptr (236,021 samples, 0.02%)
ns3::Object::DoDelete (659,540 samples, 0.07%)
std::vector<ns3::Ptr<ns3::PacketBurst>, std::allocator<ns3::Ptr<ns3::PacketBurst> > >::operator[] (236,769 samples, 0.02%)
__gnu_cxx::__aligned_membuf<ns3::Ptr<ns3::Packet> >::_M_ptr (241,718 samples, 0.02%)
ns3::DefaultDeleter<ns3::Packet>::Delete (2,691,525 samples, 0.28%)
std::allocator<std::_Rb_tree_node<std::pair<ns3::Scheduler::EventKey const, ns3::EventImpl*> > >::deallocate (887,233 samples, 0.09%)
decltype (273,884 samples, 0.03%)
ns3::FfMacSchedSapProvider::SchedDlCqiInfoReqParameters::~SchedDlCqiInfoReqParameters (560,297 samples, 0.06%)
std::_Rb_tree<unsigned short, std::pair<unsigned short const, unsigned int>, std::_Select1st<std::pair<unsigned short const, unsigned int> >, std::less<unsigned short>, std::allocator<std::pair<unsigned short const, unsigned int> > >::find (147,114 samples, 0.02%)
__gnu_cxx::__normal_iterator<ns3::Ptr<ns3::PacketBurst> const*, std::vector<ns3::Ptr<ns3::PacketBurst>, std::allocator<ns3::Ptr<ns3::PacketBurst> > > >::difference_type __gnu_cxx::operator-<ns3::Ptr<ns3::PacketBurst> const*, std::vector<ns3::Ptr<ns3::PacketBurst>, std::allocator<ns3::Ptr<ns3::PacketBurst> > > > (318,233 samples, 0.03%)
void std::_Destroy_aux<true>::__destroy<unsigned char*> (197,227 samples, 0.02%)
ns3::Ptr<ns3::MobilityModel>::Acquire (163,101 samples, 0.02%)
std::_Vector_base<unsigned char, std::allocator<unsigned char> >::_Vector_base (381,298 samples, 0.04%)
ns3::LteUePhy::DoSendLteControlMessage (1,153,573 samples, 0.12%)
std::_Vector_base<ns3::DlInfoListElement_s, std::allocator<ns3::DlInfoListElement_s> >::_Vector_impl_data::_Vector_impl_data (243,120 samples, 0.03%)
ns3::SimpleRefCount<ns3::LteControlMessage, ns3::Empty, ns3::DefaultDeleter<ns3::LteControlMessage> >::Unref (160,375 samples, 0.02%)
ns3::NodeListPriv::DoDispose (238,924 samples, 0.02%)
std::__fill_bvector (161,544 samples, 0.02%)
ns3::RlcPduListElement_s* std::__do_uninit_copy<__gnu_cxx::__normal_iterator<ns3::RlcPduListElement_s const*, std::vector<ns3::RlcPduListElement_s, std::allocator<ns3::RlcPduListElement_s> > >, ns3::RlcPduListElement_s*> (178,382 samples, 0.02%)
ns3::HigherLayerSelected_s::HigherLayerSelected_s (277,299 samples, 0.03%)
std::less<ns3::Scheduler::EventKey>::operator (727,810 samples, 0.08%)
ns3::DefaultSimulatorImpl::Now (158,066 samples, 0.02%)
std::_Rb_tree<ns3::Scheduler::EventKey, std::pair<ns3::Scheduler::EventKey const, ns3::EventImpl*>, std::_Select1st<std::pair<ns3::Scheduler::EventKey const, ns3::EventImpl*> >, std::less<ns3::Scheduler::EventKey>, std::allocator<std::pair<ns3::Scheduler::EventKey const, ns3::EventImpl*> > >::_M_insert_node (278,782 samples, 0.03%)
std::_Rb_tree_node<std::pair<unsigned short const, unsigned char> >::_M_valptr (191,519 samples, 0.02%)
std::_Rb_tree<unsigned char, std::pair<unsigned char const, ns3::LteMacSapUser*>, std::_Select1st<std::pair<unsigned char const, ns3::LteMacSapUser*> >, std::less<unsigned char>, std::allocator<std::pair<unsigned char const, ns3::LteMacSapUser*> > >::find (484,223 samples, 0.05%)
ns3::ByteTagIterator::Item::GetTag (594,222 samples, 0.06%)
ns3::Ptr<ns3::Packet>::Acquire (149,428 samples, 0.02%)
std::vector<bool, std::allocator<bool> >::insert (276,956 samples, 0.03%)
ns3::LteControlMessage::GetMessageType (150,641 samples, 0.02%)
ns3::PacketTagList::Peek (1,947,014 samples, 0.20%)
std::tuple<ns3::LteInterference*, ns3::Ptr<ns3::SpectrumValue const>, unsigned int>::tuple<ns3::LteInterference*&, ns3::Ptr<ns3::SpectrumValue const>&, unsigned int&, true, true> (1,652,564 samples, 0.17%)
std::__cxx11::list<ns3::Ptr<ns3::LteControlMessage>, std::allocator<ns3::Ptr<ns3::LteControlMessage> > >* std::__copy_move_a1<true, std::__cxx11::list<ns3::Ptr<ns3::LteControlMessage>, std::allocator<ns3::Ptr<ns3::LteControlMessage> > >*, std::__cxx11::list<ns3::Ptr<ns3::LteControlMessage>, std::allocator<ns3::Ptr<ns3::LteControlMessage> > >*> (1,149,860 samples, 0.12%)
ns3::PacketBurst::GetTypeId (158,072 samples, 0.02%)
__gnu_cxx::__aligned_membuf<ns3::Ptr<ns3::LteControlMessage> >::_M_ptr (151,932 samples, 0.02%)
std::operator== (305,665 samples, 0.03%)
std::_Vector_base<ns3::HigherLayerSelected_s, std::allocator<ns3::HigherLayerSelected_s> >::~_Vector_base (186,345 samples, 0.02%)
(196,328 samples, 0.02%)
ns3::Callback<void, std::__cxx11::list<ns3::Ptr<ns3::LteControlMessage>, std::allocator<ns3::Ptr<ns3::LteControlMessage> > > >::Callback<void (126,158 samples, 0.01%)
ns3::HigherLayerSelected_s* std::__uninitialized_copy_a<__gnu_cxx::__normal_iterator<ns3::HigherLayerSelected_s const*, std::vector<ns3::HigherLayerSelected_s, std::allocator<ns3::HigherLayerSelected_s> > >, ns3::HigherLayerSelected_s*, ns3::HigherLayerSelected_s> (324,739 samples, 0.03%)
std::vector<unsigned char, std::allocator<unsigned char> >::size (161,317 samples, 0.02%)
ns3::LteEnbMac::DoSubframeIndication (415,834 samples, 0.04%)
std::_Bind_helper<std::__or_<std::is_integral<std::decay<void (1,871,248 samples, 0.19%)
ns3::LteSpectrumPhy::EndRxDlCtrl (120,196,089 samples, 12.39%) ns3::LteSpe..
std::_Rb_tree_node<std::pair<ns3::Scheduler::EventKey const, ns3::EventImpl*> >* std::_Rb_tree<ns3::Scheduler::EventKey, std::pair<ns3::Scheduler::EventKey const, ns3::EventImpl*>, std::_Select1st<std::pair<ns3::Scheduler::EventKey const, ns3::EventImpl*> >, std::less<ns3::Scheduler::EventKey>, std::allocator<std::pair<ns3::Scheduler::EventKey const, ns3::EventImpl*> > >::_M_create_node<std::pair<ns3::Scheduler::EventKey, ns3::EventImpl*> > (783,256 samples, 0.08%)
std::_Vector_base<unsigned short, std::allocator<unsigned short> >::_Vector_impl::_Vector_impl (333,132 samples, 0.03%)
ns3::EnbMacMemberFfMacSchedSapUser::SchedDlConfigInd (1,650,854 samples, 0.17%)
void std::destroy_at<ns3::BuildDataListElement_s> (677,511 samples, 0.07%)
ns3::SpectrumValue::operator= (2,313,097 samples, 0.24%)
std::vector<ns3::PacketMetadata::Data*, std::allocator<ns3::PacketMetadata::Data*> >::end (160,537 samples, 0.02%)
void std::destroy_at<std::pair<unsigned short const, std::vector<double, std::allocator<double> > > > (198,551 samples, 0.02%)
ns3::NoOpComponentCarrierManager::DoTransmitPdu (886,429 samples, 0.09%)
std::_Rb_tree<unsigned char, std::pair<unsigned char const, ns3::LteMacSapProvider*>, std::_Select1st<std::pair<unsigned char const, ns3::LteMacSapProvider*> >, std::less<unsigned char>, std::allocator<std::pair<unsigned char const, ns3::LteMacSapProvider*> > >::_S_key (202,540 samples, 0.02%)
std::_Vector_base<unsigned char, std::allocator<unsigned char> >::_M_create_storage (153,635 samples, 0.02%)
std::_Tuple_impl<2ul, double const&>::_Tuple_impl (258,015 samples, 0.03%)
ns3::Buffer::Data* const& std::forward<ns3::Buffer::Data* const&> (201,496 samples, 0.02%)
ns3::Ptr<ns3::LteControlMessage>::~Ptr (186,011 samples, 0.02%)
std::tuple_element<0ul, std::tuple<ns3::LteSpectrumPhy*> >::type& std::get<0ul, ns3::LteSpectrumPhy*> (724,506 samples, 0.07%)
ns3::TypeId::TypeId (152,238 samples, 0.02%)
std::_Rb_tree_node<std::pair<unsigned short const, ns3::LteEnbComponentCarrierManager::UeInfo> >::_M_valptr (250,138 samples, 0.03%)
ns3::DefaultSimulatorImpl::Now (231,403 samples, 0.02%)
std::_Rb_tree<unsigned int, std::pair<unsigned int const, ns3::TxSpectrumModelInfo>, std::_Select1st<std::pair<unsigned int const, ns3::TxSpectrumModelInfo> >, std::less<unsigned int>, std::allocator<std::pair<unsigned int const, ns3::TxSpectrumModelInfo> > >::_M_lower_bound (1,788,371 samples, 0.18%)
ns3::SpectrumValue::ConstValuesBegin (200,731 samples, 0.02%)
ns3::MemberSchedSapProvider<ns3::PfFfMacScheduler>::SchedDlTriggerReq (4,972,136 samples, 0.51%)
ns3::Ptr<ns3::EventImpl>::operator= (191,741 samples, 0.02%)
std::_Vector_base<ns3::HarqProcessInfoElement_t, std::allocator<ns3::HarqProcessInfoElement_t> >::_Vector_base (694,137 samples, 0.07%)
unsigned short* std::__uninitialized_move_a<unsigned short*, unsigned short*, std::allocator<unsigned short> > (1,127,032 samples, 0.12%)
std::__cxx11::_List_base<ns3::Ptr<ns3::PacketBurst>, std::allocator<ns3::Ptr<ns3::PacketBurst> > >::_M_get_Node_allocator (237,832 samples, 0.02%)
std::vector<bool, std::allocator<bool> >::size (766,734 samples, 0.08%)
std::_Tuple_impl<3ul, ns3::Ptr<ns3::SpectrumSignalParameters>, ns3::Ptr<ns3::SpectrumPhy>, std::map<unsigned int, ns3::Ptr<ns3::SpectrumValue>, std::less<unsigned int>, std::allocator<std::pair<unsigned int const, ns3::Ptr<ns3::SpectrumValue> > > > >::_Tuple_impl<ns3::Ptr<ns3::SpectrumSignalParameters>&, ns3::Ptr<ns3::SpectrumPhy>&, std::map<unsigned int, ns3::Ptr<ns3::SpectrumValue>, std::less<unsigned int>, std::allocator<std::pair<unsigned int const, ns3::Ptr<ns3::SpectrumValue> > > >&, void> (163,911 samples, 0.02%)
std::_Tuple_impl<3ul, ns3::Ptr<ns3::SpectrumSignalParameters>, ns3::Ptr<ns3::SpectrumPhy>, std::map<unsigned int, ns3::Ptr<ns3::SpectrumValue>, std::less<unsigned int>, std::allocator<std::pair<unsigned int const, ns3::Ptr<ns3::SpectrumValue> > > > >::_Tuple_impl<ns3::Ptr<ns3::SpectrumSignalParameters>&, ns3::Ptr<ns3::SpectrumPhy>&, std::map<unsigned int, ns3::Ptr<ns3::SpectrumValue>, std::less<unsigned int>, std::allocator<std::pair<unsigned int const, ns3::Ptr<ns3::SpectrumValue> > > >&, void> (317,763 samples, 0.03%)
ns3::EventId::operator= (191,741 samples, 0.02%)
std::map<unsigned char, ns3::LteMacSapProvider*, std::less<unsigned char>, std::allocator<std::pair<unsigned char const, ns3::LteMacSapProvider*> > >::find (1,168,142 samples, 0.12%)
std::_Head_base<0ul, double const&, false>::_Head_base (202,567 samples, 0.02%)
std::__cxx11::_List_base<ns3::Ptr<ns3::LteControlMessage>, std::allocator<ns3::Ptr<ns3::LteControlMessage> > >::_M_get_node (149,240 samples, 0.02%)
std::_List_iterator<ns3::Ptr<ns3::LteChunkProcessor> >::operator++ (161,403 samples, 0.02%)
ns3::operator!= (199,253 samples, 0.02%)
ns3::LteUePhy::GenerateCqiRsrpRsrq (24,060,374 samples, 2.48%)
std::vector<ns3::UlDciListElement_s, std::allocator<ns3::UlDciListElement_s> >::vector (711,457 samples, 0.07%)
ns3::SimpleUeCcmMacSapProvider::ReportBufferStatus (1,286,769 samples, 0.13%)
ns3::LteEnbMac::DoSchedDlConfigInd (314,249 samples, 0.03%)
ns3::Tag::Tag (291,173 samples, 0.03%)
ns3::EventImpl::EventImpl (184,225 samples, 0.02%)
ns3::SimpleRefCount<ns3::SpectrumSignalParameters, ns3::Empty, ns3::DefaultDeleter<ns3::SpectrumSignalParameters> >::Unref (676,765 samples, 0.07%)
std::__new_allocator<double>::allocate (429,586 samples, 0.04%)
void std::_Destroy<ns3::MacCeListElement_s*> (796,900 samples, 0.08%)
ns3::MacCeListElement_s* std::__uninitialized_move_if_noexcept_a<ns3::MacCeListElement_s*, ns3::MacCeListElement_s*, std::allocator<ns3::MacCeListElement_s> > (659,885 samples, 0.07%)
std::_Rb_tree<unsigned short, std::pair<unsigned short const, std::vector<unsigned short, std::allocator<unsigned short> > >, std::_Select1st<std::pair<unsigned short const, std::vector<unsigned short, std::allocator<unsigned short> > > >, std::less<unsigned short>, std::allocator<std::pair<unsigned short const, std::vector<unsigned short, std::allocator<unsigned short> > > > >::_M_get_node (432,981 samples, 0.04%)
ns3::RngStream::RandU01 (729,422 samples, 0.08%)
std::map<unsigned short, ns3::LteEnbComponentCarrierManager::UeInfo, std::less<unsigned short>, std::allocator<std::pair<unsigned short const, ns3::LteEnbComponentCarrierManager::UeInfo> > >::lower_bound (1,052,171 samples, 0.11%)
std::_Rb_tree<unsigned short, std::pair<unsigned short const, std::vector<double, std::allocator<double> > >, std::_Select1st<std::pair<unsigned short const, std::vector<double, std::allocator<double> > > >, std::less<unsigned short>, std::allocator<std::pair<unsigned short const, std::vector<double, std::allocator<double> > > > >::_M_destroy_node (193,911 samples, 0.02%)
std::_Vector_base<int, std::allocator<int> >::_M_allocate (127,589 samples, 0.01%)
ns3::LteEnbPhy::DequeueUlDci[abi:cxx11] (1,038,704 samples, 0.11%)
void std::allocator_traits<std::allocator<std::_List_node<ns3::Ptr<ns3::LteControlMessage> > > >::destroy<ns3::Ptr<ns3::LteControlMessage> > (269,841 samples, 0.03%)
ns3::LtePhy::SetControlMessages (460,469 samples, 0.05%)
std::_Rb_tree<ns3::Scheduler::EventKey, std::pair<ns3::Scheduler::EventKey const, ns3::EventImpl*>, std::_Select1st<std::pair<ns3::Scheduler::EventKey const, ns3::EventImpl*> >, std::less<ns3::Scheduler::EventKey>, std::allocator<std::pair<ns3::Scheduler::EventKey const, ns3::EventImpl*> > >::_Auto_node::_M_key (161,415 samples, 0.02%)
std::vector<ns3::UlDciListElement_s, std::allocator<ns3::UlDciListElement_s> >::_M_check_len (840,073 samples, 0.09%)
ns3::HigherLayerSelected_s* std::uninitialized_copy<__gnu_cxx::__normal_iterator<ns3::HigherLayerSelected_s const*, std::vector<ns3::HigherLayerSelected_s, std::allocator<ns3::HigherLayerSelected_s> > >, ns3::HigherLayerSelected_s*> (151,182 samples, 0.02%)
std::_List_const_iterator<ns3::Ptr<ns3::LteControlMessage> >::operator* (248,928 samples, 0.03%)
std::map<ns3::LteFlowId_t, ns3::FfMacSchedSapProvider::SchedDlRlcBufferReqParameters, std::less<ns3::LteFlowId_t>, std::allocator<std::pair<ns3::LteFlowId_t const, ns3::FfMacSchedSapProvider::SchedDlRlcBufferReqParameters> > >::find (767,836 samples, 0.08%)
ns3::LteEnbPhy::DoSendLteControlMessage (162,081 samples, 0.02%)
std::__cxx11::list<ns3::Ptr<ns3::LteControlMessage>, std::allocator<ns3::Ptr<ns3::LteControlMessage> > >::splice (371,326 samples, 0.04%)
void std::_Bind<void (2,105,662 samples, 0.22%)
std::_Rb_tree<unsigned int, std::pair<unsigned int const, ns3::Ptr<ns3::SpectrumValue> >, std::_Select1st<std::pair<unsigned int const, ns3::Ptr<ns3::SpectrumValue> > >, std::less<unsigned int>, std::allocator<std::pair<unsigned int const, ns3::Ptr<ns3::SpectrumValue> > > >::_Rb_tree (434,612 samples, 0.04%)
std::_Rb_tree<unsigned short, std::pair<unsigned short const, std::map<unsigned char, ns3::LteMacSapUser*, std::less<unsigned char>, std::allocator<std::pair<unsigned char const, ns3::LteMacSapUser*> > > >, std::_Select1st<std::pair<unsigned short const, std::map<unsigned char, ns3::LteMacSapUser*, std::less<unsigned char>, std::allocator<std::pair<unsigned char const, ns3::LteMacSapUser*> > > > >, std::less<unsigned short>, std::allocator<std::pair<unsigned short const, std::map<unsigned char, ns3::LteMacSapUser*, std::less<unsigned char>, std::allocator<std::pair<unsigned char const, ns3::LteMacSapUser*> > > > > >::_M_begin (553,771 samples, 0.06%)
std::_Vector_base<double, std::allocator<double> >::_M_allocate (150,187 samples, 0.02%)
std::pair<unsigned short const, std::vector<double, std::allocator<double> > >::pair (2,848,710 samples, 0.29%)
std::vector<std::vector<int, std::allocator<int> >, std::allocator<std::vector<int, std::allocator<int> > > >::_M_range_check (126,869 samples, 0.01%)
double const* std::__niter_base<double const*, std::vector<double, std::allocator<double> > > (126,294 samples, 0.01%)
ns3::VendorSpecificListElement_s* std::__do_uninit_copy<__gnu_cxx::__normal_iterator<ns3::VendorSpecificListElement_s const*, std::vector<ns3::VendorSpecificListElement_s, std::allocator<ns3::VendorSpecificListElement_s> > >, ns3::VendorSpecificListElement_s*> (308,120 samples, 0.03%)
ns3::Ptr<ns3::PacketBurst> ns3::Create<ns3::PacketBurst> (3,725,107 samples, 0.38%)
ns3::DlInfoListElement_s::HarqStatus_e* std::__copy_move_a<false, __gnu_cxx::__normal_iterator<ns3::DlInfoListElement_s::HarqStatus_e const*, std::vector<ns3::DlInfoListElement_s::HarqStatus_e, std::allocator<ns3::DlInfoListElement_s::HarqStatus_e> > >, ns3::DlInfoListElement_s::HarqStatus_e*> (234,294 samples, 0.02%)
ns3::Time::~Time (234,871 samples, 0.02%)
ns3::Angles::Angles (1,553,770 samples, 0.16%)
ns3::ObjectBase::~ObjectBase (149,528 samples, 0.02%)
void std::_Destroy<ns3::BuildBroadcastListElement_s*> (197,106 samples, 0.02%)
void std::__cxx11::list<ns3::Ptr<ns3::LteControlMessage>, std::allocator<ns3::Ptr<ns3::LteControlMessage> > >::_M_initialize_dispatch<std::_List_const_iterator<ns3::Ptr<ns3::LteControlMessage> > > (3,161,094 samples, 0.33%)
std::_Rb_tree<unsigned short, std::pair<unsigned short const, std::vector<double, std::allocator<double> > >, std::_Select1st<std::pair<unsigned short const, std::vector<double, std::allocator<double> > > >, std::less<unsigned short>, std::allocator<std::pair<unsigned short const, std::vector<double, std::allocator<double> > > > >::_M_erase (983,671 samples, 0.10%)
std::vector<std::vector<ns3::RlcPduListElement_s, std::allocator<ns3::RlcPduListElement_s> >, std::allocator<std::vector<ns3::RlcPduListElement_s, std::allocator<ns3::RlcPduListElement_s> > > >::_M_check_len (545,391 samples, 0.06%)
std::enable_if<std::is_constructible<std::pair<ns3::Scheduler::EventKey const, ns3::EventImpl*>, std::pair<ns3::Scheduler::EventKey, ns3::EventImpl*> >::value, std::pair<std::_Rb_tree_iterator<std::pair<ns3::Scheduler::EventKey const, ns3::EventImpl*> >, bool> >::type std::map<ns3::Scheduler::EventKey, ns3::EventImpl*, std::less<ns3::Scheduler::EventKey>, std::allocator<std::pair<ns3::Scheduler::EventKey const, ns3::EventImpl*> > >::insert<std::pair<ns3::Scheduler::EventKey, ns3::EventImpl*> > (8,106,001 samples, 0.84%)
ns3::BuildDataListElement_s* std::__uninitialized_copy<false>::__uninit_copy<__gnu_cxx::__normal_iterator<ns3::BuildDataListElement_s const*, std::vector<ns3::BuildDataListElement_s, std::allocator<ns3::BuildDataListElement_s> > >, ns3::BuildDataListElement_s*> (143,073 samples, 0.01%)
void (394,385 samples, 0.04%)
double* std::copy<__gnu_cxx::__normal_iterator<double const*, std::vector<double, std::allocator<double> > >, double*> (895,799 samples, 0.09%)
std::_Vector_base<int, std::allocator<int> >::_Vector_base (251,724 samples, 0.03%)
std::_Tuple_impl<5ul, std::map<unsigned int, ns3::Ptr<ns3::SpectrumValue>, std::less<unsigned int>, std::allocator<std::pair<unsigned int const, ns3::Ptr<ns3::SpectrumValue> > > > >::_Tuple_impl<std::map<unsigned int, ns3::Ptr<ns3::SpectrumValue>, std::less<unsigned int>, std::allocator<std::pair<unsigned int const, ns3::Ptr<ns3::SpectrumValue> > > >&> (318,126 samples, 0.03%)
std::_Rb_tree<unsigned int, std::pair<unsigned int const, ns3::Ptr<ns3::SpectrumValue> >, std::_Select1st<std::pair<unsigned int const, ns3::Ptr<ns3::SpectrumValue> > >, std::less<unsigned int>, std::allocator<std::pair<unsigned int const, ns3::Ptr<ns3::SpectrumValue> > > >::_M_drop_node (397,972 samples, 0.04%)
std::vector<double, std::allocator<double> >::vector (314,226 samples, 0.03%)
std::_Rb_tree<unsigned short, std::pair<unsigned short const, ns3::LteEnbComponentCarrierManager::UeInfo>, std::_Select1st<std::pair<unsigned short const, ns3::LteEnbComponentCarrierManager::UeInfo> >, std::less<unsigned short>, std::allocator<std::pair<unsigned short const, ns3::LteEnbComponentCarrierManager::UeInfo> > >::key_comp (161,213 samples, 0.02%)
__gnu_cxx::__aligned_membuf<std::pair<unsigned short const, std::map<unsigned char, ns3::LteMacSapUser*, std::less<unsigned char>, std::allocator<std::pair<unsigned char const, ns3::LteMacSapUser*> > > > >::_M_ptr (233,529 samples, 0.02%)
std::_Vector_base<unsigned char, std::allocator<unsigned char> >::_M_deallocate (275,158 samples, 0.03%)
void std::_Destroy<ns3::RlcPduListElement_s*> (190,862 samples, 0.02%)
ns3::LteSpectrumPhy::AddExpectedTb (5,493,975 samples, 0.57%)
unsigned char* std::__uninitialized_copy_a<__gnu_cxx::__normal_iterator<unsigned char const*, std::vector<unsigned char, std::allocator<unsigned char> > >, unsigned char*, unsigned char> (204,725 samples, 0.02%)
std::vector<ns3::BuildDataListElement_s, std::allocator<ns3::BuildDataListElement_s> >::at (192,817 samples, 0.02%)
ns3::Ptr<ns3::SpectrumPhy>::Ptr (241,373 samples, 0.02%)
__gnu_cxx::__normal_iterator<double*, std::vector<double, std::allocator<double> > >::base (155,897 samples, 0.02%)
std::__cxx11::list<ns3::Callback<void, unsigned short, unsigned char, unsigned int>, std::allocator<ns3::Callback<void, unsigned short, unsigned char, unsigned int> > >::begin (250,676 samples, 0.03%)
std::allocator<double>::deallocate (154,926 samples, 0.02%)
ns3::LteRlcSpecificLteMacSapUser::ReceivePdu (5,789,710 samples, 0.60%)
std::_Vector_base<int, std::allocator<int> >::~_Vector_base (270,798 samples, 0.03%)
void std::_Destroy_aux<false>::__destroy<ns3::CqiListElement_s*> (416,767 samples, 0.04%)
std::vector<bool, std::allocator<bool> >::_M_copy_aligned (1,193,749 samples, 0.12%)
ns3::int64x64_t::int64x64_t (159,152 samples, 0.02%)
void std::_Destroy<ns3::Ptr<ns3::Object>*, ns3::Ptr<ns3::Object> > (575,552 samples, 0.06%)
void std::_Destroy<std::vector<ns3::RlcPduListElement_s, std::allocator<ns3::RlcPduListElement_s> >*, std::vector<ns3::RlcPduListElement_s, std::allocator<ns3::RlcPduListElement_s> > > (240,649 samples, 0.02%)
ns3::operator*= (308,769 samples, 0.03%)
std::_Rb_tree<unsigned short, std::pair<unsigned short const, unsigned char>, std::_Select1st<std::pair<unsigned short const, unsigned char> >, std::less<unsigned short>, std::allocator<std::pair<unsigned short const, unsigned char> > >::_S_key (376,510 samples, 0.04%)
(303,690 samples, 0.03%)
std::_Rb_tree<unsigned short, std::pair<unsigned short const, ns3::DlInfoListElement_s>, std::_Select1st<std::pair<unsigned short const, ns3::DlInfoListElement_s> >, std::less<unsigned short>, std::allocator<std::pair<unsigned short const, ns3::DlInfoListElement_s> > >::_Auto_node::_M_key (162,159 samples, 0.02%)
ns3::SpectrumSignalParameters::SpectrumSignalParameters (1,058,660 samples, 0.11%)
std::allocator<unsigned char>::allocate (157,055 samples, 0.02%)
std::vector<unsigned short, std::allocator<unsigned short> >::~vector (197,904 samples, 0.02%)
__gnu_cxx::__normal_iterator<ns3::UlDciListElement_s*, std::vector<ns3::UlDciListElement_s, std::allocator<ns3::UlDciListElement_s> > >::__normal_iterator (202,471 samples, 0.02%)
std::_Bind_helper<std::__or_<std::is_integral<std::decay<void (151,641 samples, 0.02%)
std::vector<unsigned char, std::allocator<unsigned char> >::~vector (510,825 samples, 0.05%)
ns3::SimpleRefCount<ns3::Packet, ns3::Empty, ns3::DefaultDeleter<ns3::Packet> >::Unref (1,114,557 samples, 0.11%)
std::_Vector_base<ns3::Ptr<ns3::Object>, std::allocator<ns3::Ptr<ns3::Object> > >::_Vector_base (745,210 samples, 0.08%)
void (609,849 samples, 0.06%)
std::_Rb_tree_node<std::pair<unsigned short const, std::vector<std::vector<ns3::Ptr<ns3::PacketBurst>, std::allocator<ns3::Ptr<ns3::PacketBurst> > >, std::allocator<std::vector<ns3::Ptr<ns3::PacketBurst>, std::allocator<ns3::Ptr<ns3::PacketBurst> > > > > > >::_M_valptr (160,660 samples, 0.02%)
std::_Rb_tree<unsigned short, std::pair<unsigned short const, ns3::pfsFlowPerf_t>, std::_Select1st<std::pair<unsigned short const, ns3::pfsFlowPerf_t> >, std::less<unsigned short>, std::allocator<std::pair<unsigned short const, ns3::pfsFlowPerf_t> > >::_M_begin (190,024 samples, 0.02%)
std::_Head_base<2ul, unsigned int, false>::_M_head (165,154 samples, 0.02%)
std::vector<unsigned short, std::allocator<unsigned short> >::size (244,680 samples, 0.03%)
std::map<unsigned short, std::vector<unsigned short, std::allocator<unsigned short> >, std::less<unsigned short>, std::allocator<std::pair<unsigned short const, std::vector<unsigned short, std::allocator<unsigned short> > > > >::find (820,315 samples, 0.08%)
ns3::FfMacSchedSapProvider::SchedDlTriggerReqParameters::SchedDlTriggerReqParameters (944,566 samples, 0.10%)
std::tuple_element<0ul, std::tuple<ns3::LteEnbPhy*, ns3::Ptr<ns3::PacketBurst> > >::type& std::get<0ul, ns3::LteEnbPhy*, ns3::Ptr<ns3::PacketBurst> > (409,426 samples, 0.04%)
ns3::ObjectDeleter::Delete (1,989,572 samples, 0.21%)
ns3::Time::From (739,923 samples, 0.08%)
std::_Rb_tree_iterator<std::pair<ns3::TbId_t const, ns3::tbInfo_t> > std::_Rb_tree<ns3::TbId_t, std::pair<ns3::TbId_t const, ns3::tbInfo_t>, std::_Select1st<std::pair<ns3::TbId_t const, ns3::tbInfo_t> >, std::less<ns3::TbId_t>, std::allocator<std::pair<ns3::TbId_t const, ns3::tbInfo_t> > >::_M_emplace_hint_unique<std::pair<ns3::TbId_t, ns3::tbInfo_t> > (143,473 samples, 0.01%)
ns3::UeMemberLteUePhySapUser::ReceiveLteControlMessage (45,543,635 samples, 4.70%) ns3..
std::_Rb_tree<ns3::Scheduler::EventKey, std::pair<ns3::Scheduler::EventKey const, ns3::EventImpl*>, std::_Select1st<std::pair<ns3::Scheduler::EventKey const, ns3::EventImpl*> >, std::less<ns3::Scheduler::EventKey>, std::allocator<std::pair<ns3::Scheduler::EventKey const, ns3::EventImpl*> > >::_M_begin (327,923 samples, 0.03%)
std::vector<ns3::Ptr<ns3::PacketBurst>, std::allocator<ns3::Ptr<ns3::PacketBurst> > >::at (183,105 samples, 0.02%)
ns3::Object::Construct (2,631,536 samples, 0.27%)
void std::__invoke_impl<void, ns3::Callback<void, std::__cxx11::list<ns3::Ptr<ns3::LteControlMessage>, std::allocator<ns3::Ptr<ns3::LteControlMessage> > > >::Callback<void (28,112,022 samples, 2.90%) v..
ns3::CallbackImpl<void, ns3::Ptr<ns3::Packet> >::operator (21,094,361 samples, 2.18%)
ns3::UeMemberLteMacSapProvider::TransmitPdu (5,533,169 samples, 0.57%)
ns3::Ptr<ns3::LteControlMessage>& std::__cxx11::list<ns3::Ptr<ns3::LteControlMessage>, std::allocator<ns3::Ptr<ns3::LteControlMessage> > >::emplace_back<ns3::Ptr<ns3::LteControlMessage> const&> (564,216 samples, 0.06%)
std::map<unsigned int, ns3::Ptr<ns3::SpectrumValue>, std::less<unsigned int>, std::allocator<std::pair<unsigned int const, ns3::Ptr<ns3::SpectrumValue> > > >::at (187,560 samples, 0.02%)
ns3::SpectrumValue::GetSpectrumModel (124,953 samples, 0.01%)
ns3::Callback<void, std::__cxx11::list<ns3::Ptr<ns3::LteControlMessage>, std::allocator<ns3::Ptr<ns3::LteControlMessage> > > >::IsNull (376,180 samples, 0.04%)
std::allocator_traits<std::allocator<std::_Rb_tree_node<std::pair<ns3::Scheduler::EventKey const, ns3::EventImpl*> > > >::allocate (185,306 samples, 0.02%)
std::map<unsigned short, unsigned int, std::less<unsigned short>, std::allocator<std::pair<unsigned short const, unsigned int> > >::begin (281,870 samples, 0.03%)
std::__cxx11::list<ns3::Ptr<ns3::LteControlMessage>, std::allocator<ns3::Ptr<ns3::LteControlMessage> > >* std::__niter_base<std::__cxx11::list<ns3::Ptr<ns3::LteControlMessage>, std::allocator<ns3::Ptr<ns3::LteControlMessage> > >*, std::vector<std::__cxx11::list<ns3::Ptr<ns3::LteControlMessage>, std::allocator<ns3::Ptr<ns3::LteControlMessage> > >, std::allocator<std::__cxx11::list<ns3::Ptr<ns3::LteControlMessage>, std::allocator<ns3::Ptr<ns3::LteControlMessage> > > > > > (187,610 samples, 0.02%)
ns3::Ptr<ns3::NixVector>::Ptr (125,319 samples, 0.01%)
std::vector<std::vector<ns3::RlcPduListElement_s, std::allocator<ns3::RlcPduListElement_s> >, std::allocator<std::vector<ns3::RlcPduListElement_s, std::allocator<ns3::RlcPduListElement_s> > > >::end (195,428 samples, 0.02%)
std::vector<double, std::allocator<double> >::end (304,038 samples, 0.03%)
ns3::Ptr<ns3::PacketBurst>* std::__niter_base<ns3::Ptr<ns3::PacketBurst>*, std::vector<ns3::Ptr<ns3::PacketBurst>, std::allocator<ns3::Ptr<ns3::PacketBurst> > > > (194,031 samples, 0.02%)
void std::_Rb_tree<ns3::Scheduler::EventKey, std::pair<ns3::Scheduler::EventKey const, ns3::EventImpl*>, std::_Select1st<std::pair<ns3::Scheduler::EventKey const, ns3::EventImpl*> >, std::less<ns3::Scheduler::EventKey>, std::allocator<std::pair<ns3::Scheduler::EventKey const, ns3::EventImpl*> > >::_M_construct_node<std::pair<ns3::Scheduler::EventKey, ns3::EventImpl*> > (199,972 samples, 0.02%)
std::vector<unsigned char, std::allocator<unsigned char> >::vector (836,469 samples, 0.09%)
unsigned short* std::__copy_move_a<false, __gnu_cxx::__normal_iterator<unsigned short const*, std::vector<unsigned short, std::allocator<unsigned short> > >, unsigned short*> (450,981 samples, 0.05%)
std::_Vector_base<unsigned char, std::allocator<unsigned char> >::_M_deallocate (317,082 samples, 0.03%)
std::vector<unsigned char, std::allocator<unsigned char> >::at (331,136 samples, 0.03%)
int* std::__uninitialized_copy<true>::__uninit_copy<__gnu_cxx::__normal_iterator<int const*, std::vector<int, std::allocator<int> > >, int*> (730,011 samples, 0.08%)
void std::allocator_traits<std::allocator<std::_Rb_tree_node<std::pair<unsigned short const, ns3::DlInfoListElement_s> > > >::construct<std::pair<unsigned short const, ns3::DlInfoListElement_s>, std::pair<unsigned short, ns3::DlInfoListElement_s> > (724,895 samples, 0.07%)
ns3::EventId ns3::Simulator::Schedule<void (572,651 samples, 0.06%)
__gnu_cxx::__aligned_membuf<ns3::Ptr<ns3::LteControlMessage> >::_M_addr (156,809 samples, 0.02%)
std::vector<unsigned char, std::allocator<unsigned char> >::vector (323,441 samples, 0.03%)
std::allocator<unsigned short>::allocate (360,140 samples, 0.04%)
void std::_Destroy_aux<false>::__destroy<ns3::CqiListElement_s*> (154,796 samples, 0.02%)
ns3::Ptr<ns3::EventImpl>::Ptr (1,021,807 samples, 0.11%)
ns3::SimpleRefCount<ns3::Object, ns3::ObjectBase, ns3::ObjectDeleter>::SimpleRefCount (422,806 samples, 0.04%)
std::map<ns3::LteSpectrumModelId, ns3::Ptr<ns3::SpectrumModel>, std::less<ns3::LteSpectrumModelId>, std::allocator<std::pair<ns3::LteSpectrumModelId const, ns3::Ptr<ns3::SpectrumModel> > > >::find (1,429,003 samples, 0.15%)
std::_Rb_tree_node<std::pair<unsigned short const, ns3::LteEnbComponentCarrierManager::UeInfo> >::_M_valptr (379,355 samples, 0.04%)
unsigned char* std::__copy_move_a<false, __gnu_cxx::__normal_iterator<unsigned char const*, std::vector<unsigned char, std::allocator<unsigned char> > >, unsigned char*> (520,529 samples, 0.05%)
ns3::LteChunkProcessor::EvaluateChunk (8,414,736 samples, 0.87%)
__gnu_cxx::__normal_iterator<ns3::HigherLayerSelected_s*, std::vector<ns3::HigherLayerSelected_s, std::allocator<ns3::HigherLayerSelected_s> > > std::copy<__gnu_cxx::__normal_iterator<ns3::HigherLayerSelected_s const*, std::vector<ns3::HigherLayerSelected_s, std::allocator<ns3::HigherLayerSelected_s> > >, __gnu_cxx::__normal_iterator<ns3::HigherLayerSelected_s*, std::vector<ns3::HigherLayerSelected_s, std::allocator<ns3::HigherLayerSelected_s> > > > (337,592 samples, 0.03%)
__gnu_cxx::__normal_iterator<std::vector<ns3::HarqProcessInfoElement_t, std::allocator<ns3::HarqProcessInfoElement_t> >*, std::vector<std::vector<ns3::HarqProcessInfoElement_t, std::allocator<ns3::HarqProcessInfoElement_t> >, std::allocator<std::vector<ns3::HarqProcessInfoElement_t, std::allocator<ns3::HarqProcessInfoElement_t> > > > > std::move<__gnu_cxx::__normal_iterator<std::vector<ns3::HarqProcessInfoElement_t, std::allocator<ns3::HarqProcessInfoElement_t> >*, std::vector<std::vector<ns3::HarqProcessInfoElement_t, std::allocator<ns3::HarqProcessInfoElement_t> >, std::allocator<std::vector<ns3::HarqProcessInfoElement_t, std::allocator<ns3::HarqProcessInfoElement_t> > > > >, __gnu_cxx::__normal_iterator<std::vector<ns3::HarqProcessInfoElement_t, std::allocator<ns3::HarqProcessInfoElement_t> >*, std::vector<std::vector<ns3::HarqProcessInfoElement_t, std::allocator<ns3::HarqProcessInfoElement_t> >, std::allocator<std::vector<ns3::HarqProcessInfoElement_t, std::allocator<ns3::HarqProcessInfoElement_t> > > > > > (180,270 samples, 0.02%)
std::tuple<double const&, double const&, double const&>::tuple<true, true> (1,129,345 samples, 0.12%)
ns3::Simulator::GetSystemId (397,961 samples, 0.04%)
__gnu_cxx::__enable_if<std::__is_scalar<double>::__value, void>::__type std::__fill_a1<double*, double> (195,953 samples, 0.02%)
ns3::Ptr<ns3::Packet>::operator= (328,413 samples, 0.03%)
std::_Function_base::~_Function_base (488,113 samples, 0.05%)
std::map<ns3::LteSpectrumModelId, ns3::Ptr<ns3::SpectrumModel>, std::less<ns3::LteSpectrumModelId>, std::allocator<std::pair<ns3::LteSpectrumModelId const, ns3::Ptr<ns3::SpectrumModel> > > >::find (1,123,045 samples, 0.12%)
std::vector<ns3::MacCeListElement_s, std::allocator<ns3::MacCeListElement_s> >::erase (947,008 samples, 0.10%)
std::map<unsigned short, std::vector<ns3::DlDciListElement_s, std::allocator<ns3::DlDciListElement_s> >, std::less<unsigned short>, std::allocator<std::pair<unsigned short const, std::vector<ns3::DlDciListElement_s, std::allocator<ns3::DlDciListElement_s> > > > >::find (966,324 samples, 0.10%)
ns3::DefaultSimulatorImpl::Schedule (1,666,743 samples, 0.17%)
std::_Vector_base<ns3::Ptr<ns3::Object>, std::allocator<ns3::Ptr<ns3::Object> > >::_M_deallocate (162,767 samples, 0.02%)
std::_Rb_tree<int, std::pair<int const, double>, std::_Select1st<std::pair<int const, double> >, std::less<int>, std::allocator<std::pair<int const, double> > >::_M_erase (637,679 samples, 0.07%)
operator delete (125,509 samples, 0.01%)
std::map<unsigned short, unsigned char, std::less<unsigned short>, std::allocator<std::pair<unsigned short const, unsigned char> > >::end (239,197 samples, 0.02%)
std::vector<std::vector<ns3::RlcPduListElement_s, std::allocator<ns3::RlcPduListElement_s> >, std::allocator<std::vector<ns3::RlcPduListElement_s, std::allocator<ns3::RlcPduListElement_s> > > >::at (308,215 samples, 0.03%)
ns3::Ptr<ns3::EventImpl>::~Ptr (189,897 samples, 0.02%)
std::tuple<ns3::LteEnbPhy*, ns3::Ptr<ns3::PacketBurst> >::tuple (474,767 samples, 0.05%)
std::_Rb_tree_node<std::pair<unsigned short const, std::vector<double, std::allocator<double> > > >* std::_Rb_tree<unsigned short, std::pair<unsigned short const, std::vector<double, std::allocator<double> > >, std::_Select1st<std::pair<unsigned short const, std::vector<double, std::allocator<double> > > >, std::less<unsigned short>, std::allocator<std::pair<unsigned short const, std::vector<double, std::allocator<double> > > > >::_M_copy<false, std::_Rb_tree<unsigned short, std::pair<unsigned short const, std::vector<double, std::allocator<double> > >, std::_Select1st<std::pair<unsigned short const, std::vector<double, std::allocator<double> > > >, std::less<unsigned short>, std::allocator<std::pair<unsigned short const, std::vector<double, std::allocator<double> > > > >::_Alloc_node> (400,356 samples, 0.04%)
__gnu_cxx::__aligned_membuf<std::pair<unsigned short const, unsigned char> >::_M_ptr (189,215 samples, 0.02%)
void std::destroy_at<std::pair<unsigned short const, std::vector<double, std::allocator<double> > > > (555,448 samples, 0.06%)
std::pair<std::_Rb_tree_node_base*, std::_Rb_tree_node_base*>::pair<std::_Rb_tree_node<std::pair<unsigned short const, ns3::DlInfoListElement_s> >*&, std::_Rb_tree_node_base*&> (184,807 samples, 0.02%)
ns3::SimpleRefCount<ns3::SpectrumValue, ns3::Empty, ns3::DefaultDeleter<ns3::SpectrumValue> >::Unref (602,928 samples, 0.06%)
std::map<unsigned short, std::vector<std::vector<ns3::Ptr<ns3::PacketBurst>, std::allocator<ns3::Ptr<ns3::PacketBurst> > >, std::allocator<std::vector<ns3::Ptr<ns3::PacketBurst>, std::allocator<ns3::Ptr<ns3::PacketBurst> > > > >, std::less<unsigned short>, std::allocator<std::pair<unsigned short const, std::vector<std::vector<ns3::Ptr<ns3::PacketBurst>, std::allocator<ns3::Ptr<ns3::PacketBurst> > >, std::allocator<std::vector<ns3::Ptr<ns3::PacketBurst>, std::allocator<ns3::Ptr<ns3::PacketBurst> > > > > > > >::find (1,563,753 samples, 0.16%)
std::vector<double, std::allocator<double> >::~vector (531,401 samples, 0.05%)
ns3::EnbMacMemberLteEnbPhySapUser::SubframeIndication (314,249 samples, 0.03%)
__gnu_cxx::__normal_iterator<std::vector<ns3::HarqProcessInfoElement_t, std::allocator<ns3::HarqProcessInfoElement_t> > const*, std::vector<std::vector<ns3::HarqProcessInfoElement_t, std::allocator<ns3::HarqProcessInfoElement_t> >, std::allocator<std::vector<ns3::HarqProcessInfoElement_t, std::allocator<ns3::HarqProcessInfoElement_t> > > > >::__normal_iterator<std::vector<ns3::HarqProcessInfoElement_t, std::allocator<ns3::HarqProcessInfoElement_t> >*, void> (158,435 samples, 0.02%)
ns3::Packet::~Packet (1,078,177 samples, 0.11%)
ns3::SpectrumValue::GetSpectrumModel (161,203 samples, 0.02%)
[libc.so.6] (124,394 samples, 0.01%)
decltype (153,618 samples, 0.02%)
ns3::Ptr<ns3::PacketBurst>* std::__copy_move<true, false, std::random_access_iterator_tag>::__copy_m<ns3::Ptr<ns3::PacketBurst>*, ns3::Ptr<ns3::PacketBurst>*> (1,932,346 samples, 0.20%)
ns3::Object::DoDelete (667,572 samples, 0.07%)
int* std::__copy_move_a<false, int*, int*> (195,561 samples, 0.02%)
ns3::Ptr<ns3::PacketBurst> ns3::CreateObject<ns3::PacketBurst> (299,709 samples, 0.03%)
std::move_iterator<unsigned short*> std::make_move_iterator<unsigned short*> (398,257 samples, 0.04%)
unsigned long* std::__copy_move_a2<false, unsigned long*, unsigned long*> (228,596 samples, 0.02%)
std::vector<ns3::HigherLayerSelected_s, std::allocator<ns3::HigherLayerSelected_s> >::~vector (183,938 samples, 0.02%)
std::_Rb_tree<int, std::pair<int const, double>, std::_Select1st<std::pair<int const, double> >, std::less<int>, std::allocator<std::pair<int const, double> > >::_Rb_tree_impl<std::less<int>, true>::_Rb_tree_impl (172,014 samples, 0.02%)
ns3::AttributeConstructionList::AttributeConstructionList (587,413 samples, 0.06%)
std::__cxx11::list<ns3::Ptr<ns3::LteControlMessage>, std::allocator<ns3::Ptr<ns3::LteControlMessage> > >::_M_transfer (163,122 samples, 0.02%)
ns3::TbId_t::TbId_t (238,722 samples, 0.02%)
std::_Rb_tree_node<std::pair<unsigned int const, ns3::Ptr<ns3::SpectrumValue> > >* std::_Rb_tree<unsigned int, std::pair<unsigned int const, ns3::Ptr<ns3::SpectrumValue> >, std::_Select1st<std::pair<unsigned int const, ns3::Ptr<ns3::SpectrumValue> > >, std::less<unsigned int>, std::allocator<std::pair<unsigned int const, ns3::Ptr<ns3::SpectrumValue> > > >::_M_create_node<std::pair<unsigned int const, ns3::Ptr<ns3::SpectrumValue> > const&> (500,996 samples, 0.05%)
std::vector<int, std::allocator<int> >::operator= (340,476 samples, 0.04%)
__floatuntixf (240,107 samples, 0.02%)
ns3::MapScheduler::Insert (239,679 samples, 0.02%)
(151,530 samples, 0.02%)
std::__detail::_List_node_header::_List_node_header (157,771 samples, 0.02%)
std::__cxx11::list<ns3::Ptr<ns3::Packet>, std::allocator<ns3::Ptr<ns3::Packet> > >::~list (300,600 samples, 0.03%)
ns3::Object::Construct (3,213,288 samples, 0.33%)
std::vector<double, std::allocator<double> >::begin (594,572 samples, 0.06%)
std::__new_allocator<std::_List_node<ns3::Ptr<ns3::LteControlMessage> > >::deallocate (190,533 samples, 0.02%)
ns3::IidManager::GetParent (358,780 samples, 0.04%)
std::_Rb_tree<ns3::Scheduler::EventKey, std::pair<ns3::Scheduler::EventKey const, ns3::EventImpl*>, std::_Select1st<std::pair<ns3::Scheduler::EventKey const, ns3::EventImpl*> >, std::less<ns3::Scheduler::EventKey>, std::allocator<std::pair<ns3::Scheduler::EventKey const, ns3::EventImpl*> > >::_M_get_insert_hint_unique_pos (848,537 samples, 0.09%)
std::vector<ns3::VendorSpecificListElement_s, std::allocator<ns3::VendorSpecificListElement_s> >::vector (788,613 samples, 0.08%)
ns3::SpectrumValue::GetValuesN (126,759 samples, 0.01%)
std::vector<ns3::Ptr<ns3::Object>, std::allocator<ns3::Ptr<ns3::Object> > >::vector (573,370 samples, 0.06%)
std::__cxx11::list<ns3::Ptr<ns3::LteControlMessage>, std::allocator<ns3::Ptr<ns3::LteControlMessage> > >::empty (167,279 samples, 0.02%)
std::_Rb_tree<unsigned short, std::pair<unsigned short const, std::vector<ns3::DlDciListElement_s, std::allocator<ns3::DlDciListElement_s> > >, std::_Select1st<std::pair<unsigned short const, std::vector<ns3::DlDciListElement_s, std::allocator<ns3::DlDciListElement_s> > > >, std::less<unsigned short>, std::allocator<std::pair<unsigned short const, std::vector<ns3::DlDciListElement_s, std::allocator<ns3::DlDciListElement_s> > > > >::_S_key (309,647 samples, 0.03%)
std::vector<unsigned char, std::allocator<unsigned char> >::max_size (200,229 samples, 0.02%)
ns3::ByteTagList::Add (1,981,337 samples, 0.20%)
ns3::SimpleRefCount<ns3::SpectrumValue, ns3::Empty, ns3::DefaultDeleter<ns3::SpectrumValue> >::operator= (126,989 samples, 0.01%)
std::allocator_traits<std::allocator<std::_Rb_tree_node<std::pair<ns3::Scheduler::EventKey const, ns3::EventImpl*> > > >::allocate (659,007 samples, 0.07%)
unsigned char* std::uninitialized_fill_n<unsigned char*, unsigned long, unsigned char> (378,589 samples, 0.04%)
ns3::Callback<void, ns3::SpectrumValue const&>::Callback<void (240,445 samples, 0.02%)
ns3::DefaultSimulatorImpl::Schedule (1,203,174 samples, 0.12%)
std::_List_iterator<ns3::Ptr<ns3::LteControlMessage> > std::__cxx11::list<ns3::Ptr<ns3::LteControlMessage>, std::allocator<ns3::Ptr<ns3::LteControlMessage> > >::insert<std::_List_iterator<ns3::Ptr<ns3::LteControlMessage> >, void> (1,819,829 samples, 0.19%)
std::_Rb_tree<ns3::TbId_t, std::pair<ns3::TbId_t const, ns3::tbInfo_t>, std::_Select1st<std::pair<ns3::TbId_t const, ns3::tbInfo_t> >, std::less<ns3::TbId_t>, std::allocator<std::pair<ns3::TbId_t const, ns3::tbInfo_t> > >::_M_drop_node (229,826 samples, 0.02%)
std::_Rb_tree_node<std::pair<unsigned short const, std::vector<unsigned char, std::allocator<unsigned char> > > >::_M_valptr (344,085 samples, 0.04%)
std::_Rb_tree<unsigned short, std::pair<unsigned short const, ns3::LteEnbComponentCarrierManager::UeInfo>, std::_Select1st<std::pair<unsigned short const, ns3::LteEnbComponentCarrierManager::UeInfo> >, std::less<unsigned short>, std::allocator<std::pair<unsigned short const, ns3::LteEnbComponentCarrierManager::UeInfo> > >::_M_mbegin (144,996 samples, 0.01%)
[libm.so.6] (150,649 samples, 0.02%)
[libc.so.6] (923,730,017 samples, 95.25%) [libc.so.6]
std::vector<double, std::allocator<double> >::operator= (707,925 samples, 0.07%)
std::vector<ns3::CqiListElement_s, std::allocator<ns3::CqiListElement_s> >::at (149,647 samples, 0.02%)
operator new (165,071 samples, 0.02%)
std::__cxx11::list<ns3::Ptr<ns3::PacketBurst>, std::allocator<ns3::Ptr<ns3::PacketBurst> > >::end (182,299 samples, 0.02%)
decltype (998,649 samples, 0.10%)
ns3::DefaultDeleter<ns3::EventImpl>::Delete (401,412 samples, 0.04%)
std::_Rb_tree<unsigned int, std::pair<unsigned int const, ns3::Ptr<ns3::SpectrumValue> >, std::_Select1st<std::pair<unsigned int const, ns3::Ptr<ns3::SpectrumValue> > >, std::less<unsigned int>, std::allocator<std::pair<unsigned int const, ns3::Ptr<ns3::SpectrumValue> > > >::_M_get_insert_hint_unique_pos (202,320 samples, 0.02%)
ns3::LteEnbPhy::CreateSrsCqiReport (244,160 samples, 0.03%)
std::_Function_base::_Function_base (342,542 samples, 0.04%)
ns3::PacketBurst::~PacketBurst (269,240 samples, 0.03%)
__do_global_dtors_aux (155,299 samples, 0.02%)
__gnu_cxx::__aligned_membuf<std::pair<unsigned short const, std::vector<unsigned char, std::allocator<unsigned char> > > >::_M_ptr (277,428 samples, 0.03%)
std::_Rb_tree_iterator<std::pair<ns3::Scheduler::EventKey const, ns3::EventImpl*> > std::_Rb_tree<ns3::Scheduler::EventKey, std::pair<ns3::Scheduler::EventKey const, ns3::EventImpl*>, std::_Select1st<std::pair<ns3::Scheduler::EventKey const, ns3::EventImpl*> >, std::less<ns3::Scheduler::EventKey>, std::allocator<std::pair<ns3::Scheduler::EventKey const, ns3::EventImpl*> > >::_M_emplace_hint_unique<std::pair<ns3::Scheduler::EventKey, ns3::EventImpl*> > (538,288 samples, 0.06%)
ns3::SpectrumSignalParameters::SpectrumSignalParameters (5,377,108 samples, 0.55%)
operator new (169,709 samples, 0.02%)
std::_Function_base::_Function_base (186,634 samples, 0.02%)
void std::_Destroy_aux<false>::__destroy<__gnu_cxx::__normal_iterator<ns3::DlInfoListElement_s*, std::vector<ns3::DlInfoListElement_s, std::allocator<ns3::DlInfoListElement_s> > > > (269,165 samples, 0.03%)
std::_Rb_tree_node<std::pair<ns3::LteSpectrumModelId const, ns3::Ptr<ns3::SpectrumModel> > >::_M_valptr (227,886 samples, 0.02%)
std::vector<double, std::allocator<double> >::_M_range_check (187,936 samples, 0.02%)
ns3::LteSpectrumValueHelper::CreateTxPowerSpectralDensity (1,022,169 samples, 0.11%)
ns3::operator+ (125,077 samples, 0.01%)
std::_Rb_tree_node<std::pair<unsigned short const, std::map<unsigned char, ns3::LteMacSapUser*, std::less<unsigned char>, std::allocator<std::pair<unsigned char const, ns3::LteMacSapUser*> > > > >::_M_valptr (323,451 samples, 0.03%)
std::_Rb_tree<unsigned short, unsigned short, std::_Identity<unsigned short>, std::less<unsigned short>, std::allocator<unsigned short> >::find (273,587 samples, 0.03%)
std::allocator<std::_List_node<ns3::UlDciLteControlMessage> >::deallocate (278,972 samples, 0.03%)
std::_Rb_tree<ns3::TbId_t, std::pair<ns3::TbId_t const, ns3::tbInfo_t>, std::_Select1st<std::pair<ns3::TbId_t const, ns3::tbInfo_t> >, std::less<ns3::TbId_t>, std::allocator<std::pair<ns3::TbId_t const, ns3::tbInfo_t> > >::_S_key (313,691 samples, 0.03%)
std::_Vector_base<ns3::BuildDataListElement_s, std::allocator<ns3::BuildDataListElement_s> >::_Vector_base (790,436 samples, 0.08%)
std::vector<unsigned char, std::allocator<unsigned char> >::_M_fill_initialize (492,278 samples, 0.05%)
std::vector<unsigned char, std::allocator<unsigned char> >::operator= (270,541 samples, 0.03%)
std::_Bind_helper<std::__or_<std::is_integral<std::decay<void (857,965 samples, 0.09%)
std::_Rb_tree<ns3::Scheduler::EventKey, std::pair<ns3::Scheduler::EventKey const, ns3::EventImpl*>, std::_Select1st<std::pair<ns3::Scheduler::EventKey const, ns3::EventImpl*> >, std::less<ns3::Scheduler::EventKey>, std::allocator<std::pair<ns3::Scheduler::EventKey const, ns3::EventImpl*> > >::_M_get_insert_hint_unique_pos (687,499 samples, 0.07%)
ns3::Ptr<ns3::PacketBurst>* std::__copy_move_a2<true, ns3::Ptr<ns3::PacketBurst>*, ns3::Ptr<ns3::PacketBurst>*> (5,897,576 samples, 0.61%)
std::_Rb_tree<unsigned int, std::pair<unsigned int const, ns3::Ptr<ns3::SpectrumValue> >, std::_Select1st<std::pair<unsigned int const, ns3::Ptr<ns3::SpectrumValue> > >, std::less<unsigned int>, std::allocator<std::pair<unsigned int const, ns3::Ptr<ns3::SpectrumValue> > > >::_Rb_tree_impl<std::less<unsigned int>, true>::_Rb_tree_impl (152,827 samples, 0.02%)
ns3::EventImpl::Invoke (5,321,712 samples, 0.55%)
std::__cxx11::list<ns3::AttributeConstructionList::Item, std::allocator<ns3::AttributeConstructionList::Item> >::list (652,304 samples, 0.07%)
std::vector<unsigned char, std::allocator<unsigned char> >::_S_relocate (381,047 samples, 0.04%)
std::map<ns3::TbId_t, ns3::tbInfo_t, std::less<ns3::TbId_t>, std::allocator<std::pair<ns3::TbId_t const, ns3::tbInfo_t> > >::find (1,799,150 samples, 0.19%)
std::pair<ns3::Scheduler::EventKey const, ns3::EventImpl*>::pair<ns3::Scheduler::EventKey, ns3::EventImpl*> (481,004 samples, 0.05%)
unsigned short* std::__uninitialized_copy<true>::__uninit_copy<__gnu_cxx::__normal_iterator<unsigned short const*, std::vector<unsigned short, std::allocator<unsigned short> > >, unsigned short*> (545,960 samples, 0.06%)
ns3::LteHarqPhy::GetHarqProcessInfoUl (4,963,729 samples, 0.51%)
ns3::Ptr<ns3::LteNetDevice>::Ptr (241,803 samples, 0.02%)
std::_Select1st<std::pair<unsigned short const, ns3::pfsFlowPerf_t> >::operator (231,657 samples, 0.02%)
std::vector<double, std::allocator<double> >::_M_default_initialize (1,464,943 samples, 0.15%)
double* std::__copy_move_a<false, __gnu_cxx::__normal_iterator<double const*, std::vector<double, std::allocator<double> > >, double*> (165,918 samples, 0.02%)
ns3::TypeId::GetAttributeN (1,150,317 samples, 0.12%)
ns3::ConstantPositionMobilityModel::DoGetPosition (190,065 samples, 0.02%)
std::__cxx11::_List_base<ns3::Ptr<ns3::PacketBurst>, std::allocator<ns3::Ptr<ns3::PacketBurst> > >::_M_clear (2,445,979 samples, 0.25%)
[ld-linux-x86-64.so.2] (206,546 samples, 0.02%)
std::_Vector_base<double, std::allocator<double> >::_Vector_base (663,076 samples, 0.07%)
__gnu_cxx::__aligned_membuf<std::pair<unsigned short const, ns3::SbMeasResult_s> >::_M_ptr (163,489 samples, 0.02%)
std::_Vector_base<unsigned short, std::allocator<unsigned short> >::_M_allocate (360,140 samples, 0.04%)
std::vector<int, std::allocator<int> >::_M_range_check (154,783 samples, 0.02%)
std::_List_iterator<ns3::Ptr<ns3::PacketBurst> >::operator* (237,279 samples, 0.02%)
ns3::operator< (377,493 samples, 0.04%)
ns3::DlCqiLteControlMessage::SetDlCqi (1,473,854 samples, 0.15%)
std::vector<unsigned char, std::allocator<unsigned char> >::~vector (221,743 samples, 0.02%)
std::vector<std::__cxx11::list<ns3::Ptr<ns3::LteControlMessage>, std::allocator<ns3::Ptr<ns3::LteControlMessage> > >, std::allocator<std::__cxx11::list<ns3::Ptr<ns3::LteControlMessage>, std::allocator<ns3::Ptr<ns3::LteControlMessage> > > > >::at (473,755 samples, 0.05%)
std::vector<ns3::ByteTagListData*, std::allocator<ns3::ByteTagListData*> >::pop_back (350,982 samples, 0.04%)
std::_Bind<void (378,932 samples, 0.04%)
void std::allocator_traits<std::allocator<std::_List_node<ns3::UlDciLteControlMessage> > >::destroy<ns3::UlDciLteControlMessage> (234,425 samples, 0.02%)
ns3::int64x64_t::GetDouble (604,584 samples, 0.06%)
std::enable_if<std::is_constructible<std::pair<ns3::Scheduler::EventKey const, ns3::EventImpl*>, std::pair<ns3::Scheduler::EventKey, ns3::EventImpl*> >::value, std::pair<std::_Rb_tree_iterator<std::pair<ns3::Scheduler::EventKey const, ns3::EventImpl*> >, bool> >::type std::map<ns3::Scheduler::EventKey, ns3::EventImpl*, std::less<ns3::Scheduler::EventKey>, std::allocator<std::pair<ns3::Scheduler::EventKey const, ns3::EventImpl*> > >::insert<std::pair<ns3::Scheduler::EventKey, ns3::EventImpl*> > (297,456 samples, 0.03%)
unsigned char* std::copy<__gnu_cxx::__normal_iterator<unsigned char const*, std::vector<unsigned char, std::allocator<unsigned char> > >, unsigned char*> (556,653 samples, 0.06%)
std::_Vector_base<double, std::allocator<double> >::_M_get_Tp_allocator (169,242 samples, 0.02%)
ns3::Angles::Angles (1,554,886 samples, 0.16%)
void std::__cxx11::list<ns3::UlDciLteControlMessage, std::allocator<ns3::UlDciLteControlMessage> >::_M_initialize_dispatch<std::_List_const_iterator<ns3::UlDciLteControlMessage> > (139,939 samples, 0.01%)
std::vector<double, std::allocator<double> >::operator= (606,661 samples, 0.06%)
std::vector<std::__cxx11::list<ns3::UlDciLteControlMessage, std::allocator<ns3::UlDciLteControlMessage> >, std::allocator<std::__cxx11::list<ns3::UlDciLteControlMessage, std::allocator<ns3::UlDciLteControlMessage> > > >::operator[] (278,129 samples, 0.03%)
ns3::LteUePowerControl::ReportTpc (2,374,811 samples, 0.24%)
std::tuple_element<2ul, std::tuple<ns3::LteUePhy*, unsigned int, unsigned int> >::type& std::get<2ul, ns3::LteUePhy*, unsigned int, unsigned int> (349,917 samples, 0.04%)
std::tuple_element<0ul, std::tuple<ns3::LteEnbPhy*> >::type& std::get<0ul, ns3::LteEnbPhy*> (491,352 samples, 0.05%)
std::_Bvector_base<std::allocator<bool> >::_M_deallocate (352,416 samples, 0.04%)
std::_Rb_tree<unsigned int, std::pair<unsigned int const, ns3::Ptr<ns3::SpectrumValue> >, std::_Select1st<std::pair<unsigned int const, ns3::Ptr<ns3::SpectrumValue> > >, std::less<unsigned int>, std::allocator<std::pair<unsigned int const, ns3::Ptr<ns3::SpectrumValue> > > >::_Rb_tree (719,320 samples, 0.07%)
decltype (151,782 samples, 0.02%)
std::__cxx11::list<ns3::Ptr<ns3::LteControlMessage>, std::allocator<ns3::Ptr<ns3::LteControlMessage> > >::list (1,967,941 samples, 0.20%)
std::_Rb_tree<ns3::TbId_t, std::pair<ns3::TbId_t const, ns3::tbInfo_t>, std::_Select1st<std::pair<ns3::TbId_t const, ns3::tbInfo_t> >, std::less<ns3::TbId_t>, std::allocator<std::pair<ns3::TbId_t const, ns3::tbInfo_t> > >::_M_get_node (418,393 samples, 0.04%)
void std::_Destroy<int*> (161,562 samples, 0.02%)
ns3::FfMacSchedSapUser::SchedDlConfigIndParameters::SchedDlConfigIndParameters (1,092,598 samples, 0.11%)
std::_Rb_tree<int, std::pair<int const, double>, std::_Select1st<std::pair<int const, double> >, std::less<int>, std::allocator<std::pair<int const, double> > >::_M_erase (702,211 samples, 0.07%)
std::_Rb_tree_node<std::pair<unsigned int const, ns3::Ptr<ns3::SpectrumValue> > >* std::_Rb_tree<unsigned int, std::pair<unsigned int const, ns3::Ptr<ns3::SpectrumValue> >, std::_Select1st<std::pair<unsigned int const, ns3::Ptr<ns3::SpectrumValue> > >, std::less<unsigned int>, std::allocator<std::pair<unsigned int const, ns3::Ptr<ns3::SpectrumValue> > > >::_M_create_node<unsigned int const&, ns3::Ptr<ns3::SpectrumValue>&> (849,776 samples, 0.09%)
std::function<void (27,867,459 samples, 2.87%) s..
std::_Vector_base<ns3::DlInfoListElement_s::HarqStatus_e, std::allocator<ns3::DlInfoListElement_s::HarqStatus_e> >::_M_create_storage (499,008 samples, 0.05%)
unsigned short* std::copy<std::move_iterator<unsigned short*>, unsigned short*> (687,255 samples, 0.07%)
ns3::Simulator::DoSchedule (1,350,821 samples, 0.14%)
void std::_Function_base::_Base_manager<std::_Bind<void (240,043 samples, 0.02%)
std::_Tuple_impl<4ul, ns3::Ptr<ns3::SpectrumPhy>, std::map<unsigned int, ns3::Ptr<ns3::SpectrumValue>, std::less<unsigned int>, std::allocator<std::pair<unsigned int const, ns3::Ptr<ns3::SpectrumValue> > > > >::_Tuple_impl<ns3::Ptr<ns3::SpectrumPhy>&, std::map<unsigned int, ns3::Ptr<ns3::SpectrumValue>, std::less<unsigned int>, std::allocator<std::pair<unsigned int const, ns3::Ptr<ns3::SpectrumValue> > > >&, void> (317,763 samples, 0.03%)
std::map<unsigned int, ns3::Ptr<ns3::SpectrumValue>, std::less<unsigned int>, std::allocator<std::pair<unsigned int const, ns3::Ptr<ns3::SpectrumValue> > > >::lower_bound (163,786 samples, 0.02%)
std::_Rb_tree<unsigned int, std::pair<unsigned int const, ns3::TxSpectrumModelInfo>, std::_Select1st<std::pair<unsigned int const, ns3::TxSpectrumModelInfo> >, std::less<unsigned int>, std::allocator<std::pair<unsigned int const, ns3::TxSpectrumModelInfo> > >::_M_mbegin (229,108 samples, 0.02%)
ns3::LteEnbPhy*&& std::forward<ns3::LteEnbPhy*> (159,430 samples, 0.02%)
cfree (159,331 samples, 0.02%)
double& std::__get_helper<2ul, double, ns3::Ptr<ns3::SpectrumSignalParameters>, ns3::Ptr<ns3::SpectrumPhy>, std::map<unsigned int, ns3::Ptr<ns3::SpectrumValue>, std::less<unsigned int>, std::allocator<std::pair<unsigned int const, ns3::Ptr<ns3::SpectrumValue> > > > > (437,238 samples, 0.05%)
__gnu_cxx::__aligned_membuf<std::pair<unsigned short const, std::vector<double, std::allocator<double> > > >::_M_addr (164,453 samples, 0.02%)
void std::_Destroy<ns3::RlcPduListElement_s*, ns3::RlcPduListElement_s> (190,862 samples, 0.02%)
std::vector<unsigned char, std::allocator<unsigned char> >::vector (719,050 samples, 0.07%)
std::vector<ns3::HigherLayerSelected_s, std::allocator<ns3::HigherLayerSelected_s> >::vector (1,038,323 samples, 0.11%)
std::vector<ns3::IidManager::IidInformation, std::allocator<ns3::IidManager::IidInformation> >::operator[] (167,043 samples, 0.02%)
ns3::EnbMacMemberFfMacSchedSapUser::SchedDlConfigInd (3,932,604 samples, 0.41%)
std::vector<unsigned char, std::allocator<unsigned char> >::end (384,192 samples, 0.04%)
ns3::CeBitmap_e const* std::__niter_base<ns3::CeBitmap_e const*, std::vector<ns3::CeBitmap_e, std::allocator<ns3::CeBitmap_e> > > (152,075 samples, 0.02%)
ns3::PacketBurst::AddPacket (234,373 samples, 0.02%)
void std::_Destroy_aux<false>::__destroy<ns3::FfMacSchedSapProvider::SchedUlCqiInfoReqParameters*> (1,018,939 samples, 0.11%)
void std::_Rb_tree<unsigned int, std::pair<unsigned int const, ns3::Ptr<ns3::SpectrumValue> >, std::_Select1st<std::pair<unsigned int const, ns3::Ptr<ns3::SpectrumValue> > >, std::less<unsigned int>, std::allocator<std::pair<unsigned int const, ns3::Ptr<ns3::SpectrumValue> > > >::_M_construct_node<unsigned int const&, ns3::Ptr<ns3::SpectrumValue>&> (251,956 samples, 0.03%)
ns3::DlInfoListElement_s::HarqStatus_e* std::__uninitialized_copy_a<__gnu_cxx::__normal_iterator<ns3::DlInfoListElement_s::HarqStatus_e const*, std::vector<ns3::DlInfoListElement_s::HarqStatus_e, std::allocator<ns3::DlInfoListElement_s::HarqStatus_e> > >, ns3::DlInfoListElement_s::HarqStatus_e*, ns3::DlInfoListElement_s::HarqStatus_e> (723,994 samples, 0.07%)
ns3::EventId ns3::Simulator::Schedule<void (790,276 samples, 0.08%)
std::_Rb_tree<unsigned short, std::pair<unsigned short const, ns3::pfsFlowPerf_t>, std::_Select1st<std::pair<unsigned short const, ns3::pfsFlowPerf_t> >, std::less<unsigned short>, std::allocator<std::pair<unsigned short const, ns3::pfsFlowPerf_t> > >::_S_key (502,432 samples, 0.05%)
std::remove_reference<ns3::HigherLayerSelected_s&>::type&& std::move<ns3::HigherLayerSelected_s&> (170,828 samples, 0.02%)
ns3::EnbMacMemberLteEnbPhySapUser::SubframeIndication (4,972,136 samples, 0.51%)
ns3::PacketMetadata::PacketMetadata (1,027,645 samples, 0.11%)
ns3::Ptr<ns3::LteControlMessage>::Ptr<ns3::DlDciLteControlMessage> (316,058 samples, 0.03%)
std::vector<unsigned char, std::allocator<unsigned char> >::vector (200,365 samples, 0.02%)
std::map<unsigned short, std::vector<unsigned char, std::allocator<unsigned char> >, std::less<unsigned short>, std::allocator<std::pair<unsigned short const, std::vector<unsigned char, std::allocator<unsigned char> > > > >::end (422,449 samples, 0.04%)
std::vector<std::vector<ns3::RlcPduListElement_s, std::allocator<ns3::RlcPduListElement_s> >, std::allocator<std::vector<ns3::RlcPduListElement_s, std::allocator<ns3::RlcPduListElement_s> > > >::vector (765,141 samples, 0.08%)
ns3::PacketTagList::Add (1,584,708 samples, 0.16%)
__gnu_cxx::__normal_iterator<ns3::Buffer::Data* const*, std::vector<ns3::Buffer::Data*, std::allocator<ns3::Buffer::Data*> > >::__normal_iterator (154,434 samples, 0.02%)
std::allocator<std::_List_node<ns3::Ptr<ns3::PacketBurst> > >::allocate (428,661 samples, 0.04%)
std::tuple<ns3::LteSpectrumPhy*>::tuple (264,111 samples, 0.03%)
ns3::NoOpComponentCarrierManager::DoReportBufferStatus (747,299 samples, 0.08%)
std::_Rb_tree<unsigned short, std::pair<unsigned short const, ns3::LteUePhy::UeMeasurementsElement>, std::_Select1st<std::pair<unsigned short const, ns3::LteUePhy::UeMeasurementsElement> >, std::less<unsigned short>, std::allocator<std::pair<unsigned short const, ns3::LteUePhy::UeMeasurementsElement> > >::_M_lower_bound (202,753 samples, 0.02%)
ns3::UlInfoListElement_s* std::__uninitialized_copy<false>::__uninit_copy<__gnu_cxx::__normal_iterator<ns3::UlInfoListElement_s const*, std::vector<ns3::UlInfoListElement_s, std::allocator<ns3::UlInfoListElement_s> > >, ns3::UlInfoListElement_s*> (794,783 samples, 0.08%)
ns3::Ptr<ns3::SpectrumValue> ns3::Create<ns3::SpectrumValue, ns3::Ptr<ns3::SpectrumModel const> const&> (1,007,918 samples, 0.10%)
std::_Rb_tree<int, std::pair<int const, double>, std::_Select1st<std::pair<int const, double> >, std::less<int>, std::allocator<std::pair<int const, double> > >::_M_begin (148,965 samples, 0.02%)
std::_Function_base::_Base_manager<std::_Bind<void (488,113 samples, 0.05%)
std::operator== (145,718 samples, 0.02%)
std::vector<ns3::VendorSpecificListElement_s, std::allocator<ns3::VendorSpecificListElement_s> >::vector (275,175 samples, 0.03%)
__gnu_cxx::__promote_2<decltype (310,695 samples, 0.03%)
__gnu_cxx::__normal_iterator<ns3::ByteTagListData**, std::vector<ns3::ByteTagListData*, std::allocator<ns3::ByteTagListData*> > >::operator- (157,845 samples, 0.02%)
void std::__invoke_impl<void, ns3::Callback<void, unsigned short, ns3::Ptr<ns3::SpectrumValue> >::Callback<void (1,115,555 samples, 0.12%)
ns3::ByteTagList::Iterator::PrepareForNext (615,765 samples, 0.06%)
std::__cxx11::list<ns3::UlDciLteControlMessage, std::allocator<ns3::UlDciLteControlMessage> >::_M_move_assign (1,013,617 samples, 0.10%)
std::_Rb_tree_iterator<std::pair<ns3::Scheduler::EventKey const, ns3::EventImpl*> > std::_Rb_tree<ns3::Scheduler::EventKey, std::pair<ns3::Scheduler::EventKey const, ns3::EventImpl*>, std::_Select1st<std::pair<ns3::Scheduler::EventKey const, ns3::EventImpl*> >, std::less<ns3::Scheduler::EventKey>, std::allocator<std::pair<ns3::Scheduler::EventKey const, ns3::EventImpl*> > >::_M_emplace_hint_unique<std::pair<ns3::Scheduler::EventKey, ns3::EventImpl*> > (450,043 samples, 0.05%)
std::_Rb_tree_iterator<std::pair<unsigned short const, std::vector<unsigned char, std::allocator<unsigned char> > > >::operator* (279,655 samples, 0.03%)
std::_Rb_tree<unsigned char, std::pair<unsigned char const, ns3::LteCcmMacSapProvider*>, std::_Select1st<std::pair<unsigned char const, ns3::LteCcmMacSapProvider*> >, std::less<unsigned char>, std::allocator<std::pair<unsigned char const, ns3::LteCcmMacSapProvider*> > >::_S_key (572,914 samples, 0.06%)
(207,486 samples, 0.02%)
std::_Rb_tree_node_base::_S_maximum (160,901 samples, 0.02%)
std::__cxx11::list<ns3::Callback<void, ns3::PhyReceptionStatParameters>, std::allocator<ns3::Callback<void, ns3::PhyReceptionStatParameters> > >::end (157,995 samples, 0.02%)
ns3::CqiListElement_s::operator= (1,390,282 samples, 0.14%)
std::_Rb_tree<ns3::LteSpectrumModelId, std::pair<ns3::LteSpectrumModelId const, ns3::Ptr<ns3::SpectrumModel> >, std::_Select1st<std::pair<ns3::LteSpectrumModelId const, ns3::Ptr<ns3::SpectrumModel> > >, std::less<ns3::LteSpectrumModelId>, std::allocator<std::pair<ns3::LteSpectrumModelId const, ns3::Ptr<ns3::SpectrumModel> > > >::_S_key (491,785 samples, 0.05%)
ns3::RlcPduListElement_s* std::__uninitialized_copy<false>::__uninit_copy<__gnu_cxx::__normal_iterator<ns3::RlcPduListElement_s const*, std::vector<ns3::RlcPduListElement_s, std::allocator<ns3::RlcPduListElement_s> > >, ns3::RlcPduListElement_s*> (980,187 samples, 0.10%)
std::_Rb_tree<ns3::Scheduler::EventKey, std::pair<ns3::Scheduler::EventKey const, ns3::EventImpl*>, std::_Select1st<std::pair<ns3::Scheduler::EventKey const, ns3::EventImpl*> >, std::less<ns3::Scheduler::EventKey>, std::allocator<std::pair<ns3::Scheduler::EventKey const, ns3::EventImpl*> > >::_M_get_insert_hint_unique_pos (200,604 samples, 0.02%)
std::_Vector_base<int, std::allocator<int> >::~_Vector_base (169,673 samples, 0.02%)
std::map<int, double, std::less<int>, std::allocator<std::pair<int const, double> > >::clear (301,718 samples, 0.03%)
ns3::HigherLayerSelected_s* std::__uninitialized_copy_a<__gnu_cxx::__normal_iterator<ns3::HigherLayerSelected_s const*, std::vector<ns3::HigherLayerSelected_s, std::allocator<ns3::HigherLayerSelected_s> > >, ns3::HigherLayerSelected_s*, ns3::HigherLayerSelected_s> (213,295 samples, 0.02%)
bool __gnu_cxx::operator==<ns3::Buffer::Data* const*, std::vector<ns3::Buffer::Data*, std::allocator<ns3::Buffer::Data*> > > (253,162 samples, 0.03%)
std::_Function_base::_Function_base (204,573 samples, 0.02%)
ns3::TracedCallback<unsigned short, unsigned char, unsigned int, unsigned long>::operator (487,633 samples, 0.05%)
std::_Rb_tree<ns3::TbId_t, std::pair<ns3::TbId_t const, ns3::tbInfo_t>, std::_Select1st<std::pair<ns3::TbId_t const, ns3::tbInfo_t> >, std::less<ns3::TbId_t>, std::allocator<std::pair<ns3::TbId_t const, ns3::tbInfo_t> > >::_M_destroy_node (1,297,607 samples, 0.13%)
std::vector<ns3::ByteTagListData*, std::allocator<ns3::ByteTagListData*> >::push_back (480,087 samples, 0.05%)
unsigned short* std::uninitialized_copy<std::move_iterator<unsigned short*>, unsigned short*> (154,651 samples, 0.02%)
std::_Rb_tree_iterator<std::pair<ns3::TbId_t const, ns3::tbInfo_t> >::operator++ (161,661 samples, 0.02%)
std::_Vector_base<ns3::BuildDataListElement_s, std::allocator<ns3::BuildDataListElement_s> >::_Vector_impl_data::_Vector_impl_data (193,156 samples, 0.02%)
ns3::LteSpectrumValueHelper::GetSpectrumModel (332,755 samples, 0.03%)
void std::_Destroy<int*, int> (265,597 samples, 0.03%)
ns3::SpectrumModel::GetNumBands (216,568 samples, 0.02%)
ns3::SpectrumValue::~SpectrumValue (125,754 samples, 0.01%)
std::__cxx11::list<ns3::Ptr<ns3::LteControlMessage>, std::allocator<ns3::Ptr<ns3::LteControlMessage> > >::list (501,982 samples, 0.05%)
std::tuple<unsigned short const&>::tuple (265,541 samples, 0.03%)
std::_Bit_iterator_base::_Bit_iterator_base (148,793 samples, 0.02%)
void (370,976 samples, 0.04%)
ns3::VendorSpecificListElement_s* std::__uninitialized_copy_a<__gnu_cxx::__normal_iterator<ns3::VendorSpecificListElement_s const*, std::vector<ns3::VendorSpecificListElement_s, std::allocator<ns3::VendorSpecificListElement_s> > >, ns3::VendorSpecificListElement_s*, ns3::VendorSpecificListElement_s> (198,957 samples, 0.02%)
__gnu_cxx::__normal_iterator<std::__cxx11::list<ns3::Ptr<ns3::LteControlMessage>, std::allocator<ns3::Ptr<ns3::LteControlMessage> > > const*, std::vector<std::__cxx11::list<ns3::Ptr<ns3::LteControlMessage>, std::allocator<ns3::Ptr<ns3::LteControlMessage> > >, std::allocator<std::__cxx11::list<ns3::Ptr<ns3::LteControlMessage>, std::allocator<ns3::Ptr<ns3::LteControlMessage> > > > > >::__normal_iterator (155,343 samples, 0.02%)
ns3::LteUePhy::EnqueueDlHarqFeedback (2,635,248 samples, 0.27%)
void std::_Destroy<ns3::BuildDataListElement_s*> (793,632 samples, 0.08%)
ns3::int64x64_t::int64x64_t (1,284,908 samples, 0.13%)
ns3::SimpleRefCount<ns3::Object, ns3::ObjectBase, ns3::ObjectDeleter>::SimpleRefCount (335,668 samples, 0.03%)
std::allocator<int>::allocate (152,677 samples, 0.02%)
ns3::PacketBurst::GetSize (336,952 samples, 0.03%)
ns3::Ptr<ns3::PacketBurst>* std::__copy_move_a1<true, ns3::Ptr<ns3::PacketBurst>*, ns3::Ptr<ns3::PacketBurst>*> (5,935,274 samples, 0.61%)
ns3::Ptr<ns3::SpectrumValue>& std::__get_helper<1ul, ns3::Ptr<ns3::SpectrumValue>, double, ns3::Ptr<ns3::SpectrumSignalParameters>, ns3::Ptr<ns3::SpectrumPhy>, std::map<unsigned int, ns3::Ptr<ns3::SpectrumValue>, std::less<unsigned int>, std::allocator<std::pair<unsigned int const, ns3::Ptr<ns3::SpectrumValue> > > > > (465,270 samples, 0.05%)
std::_Rb_tree<ns3::LteFlowId_t, std::pair<ns3::LteFlowId_t const, ns3::FfMacSchedSapProvider::SchedDlRlcBufferReqParameters>, std::_Select1st<std::pair<ns3::LteFlowId_t const, ns3::FfMacSchedSapProvider::SchedDlRlcBufferReqParameters> >, std::less<ns3::LteFlowId_t>, std::allocator<std::pair<ns3::LteFlowId_t const, ns3::FfMacSchedSapProvider::SchedDlRlcBufferReqParameters> > >::begin (229,777 samples, 0.02%)
ns3::LteAmc::CreateCqiFeedbacks (6,876,813 samples, 0.71%)
std::__new_allocator<int>::allocate (137,246 samples, 0.01%)
std::vector<int, std::allocator<int> >::~vector (275,354 samples, 0.03%)
std::operator== (159,377 samples, 0.02%)
std::enable_if<is_invocable_r_v<void, void (874,599 samples, 0.09%)
std::vector<unsigned char, std::allocator<unsigned char> >::operator= (241,903 samples, 0.02%)
std::map<unsigned short, ns3::LteEnbComponentCarrierManager::UeInfo, std::less<unsigned short>, std::allocator<std::pair<unsigned short const, ns3::LteEnbComponentCarrierManager::UeInfo> > >::lower_bound (1,800,854 samples, 0.19%)
decltype (233,530 samples, 0.02%)
void std::destroy_at<ns3::FfMacSchedSapProvider::SchedUlCqiInfoReqParameters> (745,848 samples, 0.08%)
ns3::TypeId::TypeId (250,661 samples, 0.03%)
std::_List_const_iterator<ns3::Callback<void, ns3::Ptr<ns3::SpectrumPhy const>, ns3::Ptr<ns3::SpectrumPhy const>, double> >::_List_const_iterator (161,602 samples, 0.02%)
ns3::Tag::~Tag (233,481 samples, 0.02%)
std::_Rb_tree_node<std::pair<unsigned int const, ns3::Ptr<ns3::SpectrumValue> > >* std::_Rb_tree<unsigned int, std::pair<unsigned int const, ns3::Ptr<ns3::SpectrumValue> >, std::_Select1st<std::pair<unsigned int const, ns3::Ptr<ns3::SpectrumValue> > >, std::less<unsigned int>, std::allocator<std::pair<unsigned int const, ns3::Ptr<ns3::SpectrumValue> > > >::_M_copy<false, std::_Rb_tree<unsigned int, std::pair<unsigned int const, ns3::Ptr<ns3::SpectrumValue> >, std::_Select1st<std::pair<unsigned int const, ns3::Ptr<ns3::SpectrumValue> > >, std::less<unsigned int>, std::allocator<std::pair<unsigned int const, ns3::Ptr<ns3::SpectrumValue> > > >::_Alloc_node> (284,436 samples, 0.03%)
void std::destroy_at<ns3::Ptr<ns3::LteControlMessage> > (186,011 samples, 0.02%)
__gnu_cxx::__normal_iterator<ns3::CqiListElement_s*, std::vector<ns3::CqiListElement_s, std::allocator<ns3::CqiListElement_s> > > std::vector<ns3::CqiListElement_s, std::allocator<ns3::CqiListElement_s> >::insert<__gnu_cxx::__normal_iterator<ns3::CqiListElement_s*, std::vector<ns3::CqiListElement_s, std::allocator<ns3::CqiListElement_s> > >, void> (1,418,884 samples, 0.15%)
ns3::SimpleRefCount<ns3::SpectrumValue, ns3::Empty, ns3::DefaultDeleter<ns3::SpectrumValue> >::Unref (248,283 samples, 0.03%)
ns3::Ptr<ns3::SpectrumModel const>::Acquire (143,319 samples, 0.01%)
(158,234 samples, 0.02%)
ns3::FfMacSchedSapProvider::SchedDlRlcBufferReqParameters::SchedDlRlcBufferReqParameters (393,529 samples, 0.04%)
ns3::MobilityModel* ns3::PeekPointer<ns3::MobilityModel> (168,016 samples, 0.02%)
ns3::LogComponent::IsEnabled (252,384 samples, 0.03%)
ns3::SpectrumModel const* ns3::PeekPointer<ns3::SpectrumModel const> (253,729 samples, 0.03%)
std::_Rb_tree<int, std::pair<int const, double>, std::_Select1st<std::pair<int const, double> >, std::less<int>, std::allocator<std::pair<int const, double> > >::_M_get_node (236,751 samples, 0.02%)
ns3::Object::Object (1,300,864 samples, 0.13%)
std::allocator<std::_List_node<ns3::Ptr<ns3::LteControlMessage> > >::allocate (124,601 samples, 0.01%)
std::_Vector_base<ns3::BuildRarListElement_s, std::allocator<ns3::BuildRarListElement_s> >::_Vector_base (198,813 samples, 0.02%)
double const& const& std::__get_helper<1ul, double const&, double const&> (407,082 samples, 0.04%)
std::vector<ns3::HigherLayerSelected_s, std::allocator<ns3::HigherLayerSelected_s> >::operator= (701,868 samples, 0.07%)
ns3::TypeId::GetUid (236,772 samples, 0.02%)
ns3::SpectrumValue::SpectrumValue (534,268 samples, 0.06%)
ns3::FriisPropagationLossModel::DoCalcRxPower (2,967,176 samples, 0.31%)
std::allocator<ns3::DlInfoListElement_s::HarqStatus_e>::deallocate (189,106 samples, 0.02%)
std::function<void (304,521 samples, 0.03%)
std::allocator_traits<std::allocator<unsigned short> >::allocate (163,524 samples, 0.02%)
void std::destroy_at<ns3::ByteTagListData*> (350,982 samples, 0.04%)
ns3::int64x64_t::int64x64_t (246,965 samples, 0.03%)
std::vector<ns3::Ptr<ns3::Object>, std::allocator<ns3::Ptr<ns3::Object> > >::~vector (419,148 samples, 0.04%)
ns3::PacketBurst::GetTypeId (231,702 samples, 0.02%)
std::__cxx11::list<ns3::Ptr<ns3::Packet>, std::allocator<ns3::Ptr<ns3::Packet> > >::begin (148,148 samples, 0.02%)
ns3::LtePhy::SetControlMessages (1,385,802 samples, 0.14%)
__gnu_cxx::__aligned_membuf<std::pair<unsigned short const, std::vector<std::vector<ns3::Ptr<ns3::PacketBurst>, std::allocator<ns3::Ptr<ns3::PacketBurst> > >, std::allocator<std::vector<ns3::Ptr<ns3::PacketBurst>, std::allocator<ns3::Ptr<ns3::PacketBurst> > > > > > >::_M_addr (159,937 samples, 0.02%)
unsigned int* std::__uninitialized_fill_n_a<unsigned int*, unsigned long, unsigned int, unsigned int> (1,206,539 samples, 0.12%)
malloc (156,584 samples, 0.02%)
std::_Rb_tree_node<std::pair<int const, double> >* std::_Rb_tree<int, std::pair<int const, double>, std::_Select1st<std::pair<int const, double> >, std::less<int>, std::allocator<std::pair<int const, double> > >::_M_create_node<std::pair<int const, double> const&> (417,843 samples, 0.04%)
void std::__invoke_impl<void, void (18,977,087 samples, 1.96%)
ns3::DlInfoListElement_s::HarqStatus_e* std::copy<__gnu_cxx::__normal_iterator<ns3::DlInfoListElement_s::HarqStatus_e const*, std::vector<ns3::DlInfoListElement_s::HarqStatus_e, std::allocator<ns3::DlInfoListElement_s::HarqStatus_e> > >, ns3::DlInfoListElement_s::HarqStatus_e*> (683,830 samples, 0.07%)
std::vector<ns3::VendorSpecificListElement_s, std::allocator<ns3::VendorSpecificListElement_s> >::~vector (234,807 samples, 0.02%)
std::_Vector_base<unsigned char, std::allocator<unsigned char> >::_Vector_base (254,332 samples, 0.03%)
std::vector<double, std::allocator<double> >::~vector (193,911 samples, 0.02%)
void std::_Destroy<ns3::HigherLayerSelected_s*, ns3::HigherLayerSelected_s> (126,894 samples, 0.01%)
ns3::SbMeasResult_s::operator= (338,715 samples, 0.03%)
ns3::SimpleRefCount<ns3::Object, ns3::ObjectBase, ns3::ObjectDeleter>::Unref (238,924 samples, 0.02%)
ns3::SpectrumValue::GetSpectrumModel (551,820 samples, 0.06%)
std::vector<ns3::BuildBroadcastListElement_s, std::allocator<ns3::BuildBroadcastListElement_s> >::~vector (432,794 samples, 0.04%)
std::_Rb_tree_iterator<std::pair<unsigned short const, unsigned int> >::operator* (303,984 samples, 0.03%)
std::_Vector_base<ns3::VendorSpecificListElement_s, std::allocator<ns3::VendorSpecificListElement_s> >::~_Vector_base (220,788 samples, 0.02%)
std::vector<unsigned long, std::allocator<unsigned long> >::end (154,845 samples, 0.02%)
std::_Rb_tree<ns3::TbId_t, std::pair<ns3::TbId_t const, ns3::tbInfo_t>, std::_Select1st<std::pair<ns3::TbId_t const, ns3::tbInfo_t> >, std::less<ns3::TbId_t>, std::allocator<std::pair<ns3::TbId_t const, ns3::tbInfo_t> > >::_M_get_insert_hint_unique_pos (473,287 samples, 0.05%)
ns3::LteEnbMac::ReceiveBsrMessage (4,862,603 samples, 0.50%)
ns3::LteEnbMac::DoTransmitPdu (5,387,885 samples, 0.56%)
void std::_Rb_tree<unsigned int, std::pair<unsigned int const, ns3::Ptr<ns3::SpectrumValue> >, std::_Select1st<std::pair<unsigned int const, ns3::Ptr<ns3::SpectrumValue> > >, std::less<unsigned int>, std::allocator<std::pair<unsigned int const, ns3::Ptr<ns3::SpectrumValue> > > >::_M_construct_node<std::pair<unsigned int const, ns3::Ptr<ns3::SpectrumValue> > const&> (344,140 samples, 0.04%)
ns3::IidManager::LookupInformation (534,682 samples, 0.06%)
ns3::TracedCallback<unsigned short, unsigned char, unsigned int>::operator (515,825 samples, 0.05%)
std::_Rb_tree<ns3::TbId_t, std::pair<ns3::TbId_t const, ns3::tbInfo_t>, std::_Select1st<std::pair<ns3::TbId_t const, ns3::tbInfo_t> >, std::less<ns3::TbId_t>, std::allocator<std::pair<ns3::TbId_t const, ns3::tbInfo_t> > >::_M_destroy_node (229,826 samples, 0.02%)
double* std::__uninitialized_default_n_1<true>::__uninit_default_n<double*, unsigned long> (403,975 samples, 0.04%)
ns3::CqiListElement_s::CqiListElement_s (1,645,474 samples, 0.17%)
std::_Vector_base<double, std::allocator<double> >::_Vector_base (206,509 samples, 0.02%)
ns3::LteHarqPhy::ResetUlHarqProcessStatus (2,339,527 samples, 0.24%)
std::_Rb_tree_node<std::pair<int const, double> >* std::_Rb_tree<int, std::pair<int const, double>, std::_Select1st<std::pair<int const, double> >, std::less<int>, std::allocator<std::pair<int const, double> > >::_M_copy<false, std::_Rb_tree<int, std::pair<int const, double>, std::_Select1st<std::pair<int const, double> >, std::less<int>, std::allocator<std::pair<int const, double> > >::_Alloc_node> (1,950,782 samples, 0.20%)
ns3::RlcTag::Serialize (366,372 samples, 0.04%)
ns3::Ptr<ns3::PacketBurst> ns3::Create<ns3::PacketBurst> (610,469 samples, 0.06%)
void std::destroy_at<std::pair<ns3::TbId_t const, ns3::tbInfo_t> > (1,015,028 samples, 0.10%)
ns3::PacketMetadata::PacketMetadata (796,815 samples, 0.08%)
std::enable_if<std::is_constructible<std::pair<int const, double>, std::pair<int, double> >::value, std::pair<std::_Rb_tree_iterator<std::pair<int const, double> >, bool> >::type std::map<int, double, std::less<int>, std::allocator<std::pair<int const, double> > >::insert<std::pair<int, double> > (2,157,773 samples, 0.22%)
ns3::Ptr<ns3::SpectrumModel const>::Ptr (280,962 samples, 0.03%)
ns3::SimpleRefCount<ns3::SpectrumSignalParameters, ns3::Empty, ns3::DefaultDeleter<ns3::SpectrumSignalParameters> >::Unref (2,461,305 samples, 0.25%)
decltype (169,019 samples, 0.02%)
ns3::LteSpectrumPhy::GetMobility (496,870 samples, 0.05%)
std::_Rb_tree_node<std::pair<ns3::Scheduler::EventKey const, ns3::EventImpl*> >::_M_valptr (827,930 samples, 0.09%)
(160,403 samples, 0.02%)
ns3::PacketBurst::DoDispose (865,729 samples, 0.09%)
ns3::DlDciListElement_s::operator= (918,195 samples, 0.09%)
std::_Rb_tree<unsigned int, std::pair<unsigned int const, ns3::Ptr<ns3::SpectrumValue> >, std::_Select1st<std::pair<unsigned int const, ns3::Ptr<ns3::SpectrumValue> > >, std::less<unsigned int>, std::allocator<std::pair<unsigned int const, ns3::Ptr<ns3::SpectrumValue> > > >::_M_get_insert_hint_unique_pos (165,767 samples, 0.02%)
std::allocator_traits<std::allocator<double> >::deallocate (190,332 samples, 0.02%)
ns3::Ptr<ns3::SpectrumModel>::operator= (145,744 samples, 0.02%)
ns3::PacketBurst::PacketBurst (301,065 samples, 0.03%)
ns3::UlInfoListElement_s* std::uninitialized_copy<__gnu_cxx::__normal_iterator<ns3::UlInfoListElement_s const*, std::vector<ns3::UlInfoListElement_s, std::allocator<ns3::UlInfoListElement_s> > >, ns3::UlInfoListElement_s*> (794,783 samples, 0.08%)
ns3::Packet::AddByteTag (2,074,064 samples, 0.21%)
ns3::HigherLayerSelected_s* std::__do_uninit_copy<__gnu_cxx::__normal_iterator<ns3::HigherLayerSelected_s const*, std::vector<ns3::HigherLayerSelected_s, std::allocator<ns3::HigherLayerSelected_s> > >, ns3::HigherLayerSelected_s*> (241,929 samples, 0.02%)
std::_Bit_iterator std::__copy_move_a<false, std::_Bit_const_iterator, std::_Bit_iterator> (273,527 samples, 0.03%)
std::enable_if<std::is_constructible<std::pair<ns3::TbId_t const, ns3::tbInfo_t>, std::pair<ns3::TbId_t, ns3::tbInfo_t> >::value, std::pair<std::_Rb_tree_iterator<std::pair<ns3::TbId_t const, ns3::tbInfo_t> >, bool> >::type std::map<ns3::TbId_t, ns3::tbInfo_t, std::less<ns3::TbId_t>, std::allocator<std::pair<ns3::TbId_t const, ns3::tbInfo_t> > >::insert<std::pair<ns3::TbId_t, ns3::tbInfo_t> > (2,996,775 samples, 0.31%)
ns3::Time::Time (197,236 samples, 0.02%)
std::__cxx11::_List_base<ns3::AttributeConstructionList::Item, std::allocator<ns3::AttributeConstructionList::Item> >::_List_base (495,491 samples, 0.05%)
ns3::LtePhy::GetTti (159,059 samples, 0.02%)
std::vector<ns3::RlcPduListElement_s, std::allocator<ns3::RlcPduListElement_s> >::_M_erase_at_end (228,146 samples, 0.02%)
std::vector<ns3::DlInfoListElement_s::HarqStatus_e, std::allocator<ns3::DlInfoListElement_s::HarqStatus_e> >::~vector (429,894 samples, 0.04%)
std::_Rb_tree_node<std::pair<unsigned short const, std::vector<double, std::allocator<double> > > >* std::_Rb_tree<unsigned short, std::pair<unsigned short const, std::vector<double, std::allocator<double> > >, std::_Select1st<std::pair<unsigned short const, std::vector<double, std::allocator<double> > > >, std::less<unsigned short>, std::allocator<std::pair<unsigned short const, std::vector<double, std::allocator<double> > > > >::_M_copy<false, std::_Rb_tree<unsigned short, std::pair<unsigned short const, std::vector<double, std::allocator<double> > >, std::_Select1st<std::pair<unsigned short const, std::vector<double, std::allocator<double> > > >, std::less<unsigned short>, std::allocator<std::pair<unsigned short const, std::vector<double, std::allocator<double> > > > >::_Alloc_node> (3,799,581 samples, 0.39%)
std::_Vector_base<unsigned short, std::allocator<unsigned short> >::_Vector_base (364,748 samples, 0.04%)
ns3::ObjectDeleter::Delete (4,924,388 samples, 0.51%)
std::_Select1st<std::pair<unsigned short const, ns3::LteEnbComponentCarrierManager::UeInfo> >::operator (148,923 samples, 0.02%)
std::vector<std::__cxx11::list<ns3::Ptr<ns3::LteControlMessage>, std::allocator<ns3::Ptr<ns3::LteControlMessage> > >, std::allocator<std::__cxx11::list<ns3::Ptr<ns3::LteControlMessage>, std::allocator<ns3::Ptr<ns3::LteControlMessage> > > > >::_M_erase (2,189,170 samples, 0.23%)
std::__cxx11::_List_base<ns3::Ptr<ns3::LteControlMessage>, std::allocator<ns3::Ptr<ns3::LteControlMessage> > >::_M_put_node (269,933 samples, 0.03%)
cfree (155,386 samples, 0.02%)
std::_Rb_tree<ns3::Scheduler::EventKey, std::pair<ns3::Scheduler::EventKey const, ns3::EventImpl*>, std::_Select1st<std::pair<ns3::Scheduler::EventKey const, ns3::EventImpl*> >, std::less<ns3::Scheduler::EventKey>, std::allocator<std::pair<ns3::Scheduler::EventKey const, ns3::EventImpl*> > >::_M_end (247,206 samples, 0.03%)
std::_Tuple_impl<0ul, double const&, double const&, double const&>::_M_head (311,781 samples, 0.03%)
std::map<unsigned int, ns3::Ptr<ns3::SpectrumValue>, std::less<unsigned int>, std::allocator<std::pair<unsigned int const, ns3::Ptr<ns3::SpectrumValue> > > >::map (198,211 samples, 0.02%)
ns3::Simulator::Now (151,574 samples, 0.02%)
void std::allocator_traits<std::allocator<ns3::Buffer::Data*> >::construct<ns3::Buffer::Data*, ns3::Buffer::Data* const&> (345,768 samples, 0.04%)
std::_Rb_tree<ns3::Scheduler::EventKey, std::pair<ns3::Scheduler::EventKey const, ns3::EventImpl*>, std::_Select1st<std::pair<ns3::Scheduler::EventKey const, ns3::EventImpl*> >, std::less<ns3::Scheduler::EventKey>, std::allocator<std::pair<ns3::Scheduler::EventKey const, ns3::EventImpl*> > >::lower_bound (1,665,605 samples, 0.17%)
std::map<unsigned short, ns3::DlInfoListElement_s, std::less<unsigned short>, std::allocator<std::pair<unsigned short const, ns3::DlInfoListElement_s> > >::begin (250,766 samples, 0.03%)
std::_Vector_base<double, std::allocator<double> >::~_Vector_base (190,332 samples, 0.02%)
std::_Rb_tree<ns3::Scheduler::EventKey, std::pair<ns3::Scheduler::EventKey const, ns3::EventImpl*>, std::_Select1st<std::pair<ns3::Scheduler::EventKey const, ns3::EventImpl*> >, std::less<ns3::Scheduler::EventKey>, std::allocator<std::pair<ns3::Scheduler::EventKey const, ns3::EventImpl*> > >::_S_key (340,756 samples, 0.04%)
ns3::PacketBurst::DoDispose (5,576,521 samples, 0.58%)
pow (501,451 samples, 0.05%)
ns3::SimpleRefCount<ns3::Object, ns3::ObjectBase, ns3::ObjectDeleter>::Unref (158,753 samples, 0.02%)
std::_Vector_base<double, std::allocator<double> >::_M_get_Tp_allocator (158,009 samples, 0.02%)
void std::_Destroy<ns3::HarqProcessInfoElement_t*, ns3::HarqProcessInfoElement_t> (288,179 samples, 0.03%)
std::_Rb_tree<unsigned int, std::pair<unsigned int const, ns3::TxSpectrumModelInfo>, std::_Select1st<std::pair<unsigned int const, ns3::TxSpectrumModelInfo> >, std::less<unsigned int>, std::allocator<std::pair<unsigned int const, ns3::TxSpectrumModelInfo> > >::_S_key (209,098 samples, 0.02%)
ns3::LteUePowerControl::SetRsrp (935,867 samples, 0.10%)
std::_Vector_base<int, std::allocator<int> >::_M_allocate (231,272 samples, 0.02%)
ns3::UeMemberLteUePhySapUser::ReceivePhyPdu (4,482,363 samples, 0.46%)
void std::__cxx11::list<ns3::LteUePhy::PssElement, std::allocator<ns3::LteUePhy::PssElement> >::_M_insert<ns3::LteUePhy::PssElement const&> (194,530 samples, 0.02%)
ns3::DefaultDeleter<ns3::EventImpl>::Delete (444,360 samples, 0.05%)
__gnu_cxx::__aligned_membuf<std::pair<unsigned short const, std::vector<std::vector<ns3::HarqProcessInfoElement_t, std::allocator<ns3::HarqProcessInfoElement_t> >, std::allocator<std::vector<ns3::HarqProcessInfoElement_t, std::allocator<ns3::HarqProcessInfoElement_t> > > > > >::_M_addr (147,511 samples, 0.02%)
malloc (220,654 samples, 0.02%)
std::__cxx11::list<ns3::Ptr<ns3::Packet>, std::allocator<ns3::Ptr<ns3::Packet> > >::list (276,041 samples, 0.03%)
std::__cxx11::list<ns3::Ptr<ns3::LteControlMessage>, std::allocator<ns3::Ptr<ns3::LteControlMessage> > >::~list (343,413 samples, 0.04%)
ns3::MacCeValue_u::MacCeValue_u (234,615 samples, 0.02%)
std::_Rb_tree_iterator<std::pair<int const, double> > std::map<int, double, std::less<int>, std::allocator<std::pair<int const, double> > >::emplace_hint<std::pair<int, double> > (1,385,087 samples, 0.14%)
ns3::MemberSchedSapProvider<ns3::PfFfMacScheduler>::SchedDlTriggerReq (1,650,854 samples, 0.17%)
__gnu_cxx::__aligned_membuf<ns3::Ptr<ns3::Packet> >::_M_ptr (199,234 samples, 0.02%)
ns3::BuildDataListElement_s* std::uninitialized_copy<__gnu_cxx::__normal_iterator<ns3::BuildDataListElement_s const*, std::vector<ns3::BuildDataListElement_s, std::allocator<ns3::BuildDataListElement_s> > >, ns3::BuildDataListElement_s*> (143,073 samples, 0.01%)
std::pair<std::_Rb_tree_iterator<std::pair<unsigned int const, ns3::Ptr<ns3::SpectrumValue> > >, bool> std::map<unsigned int, ns3::Ptr<ns3::SpectrumValue>, std::less<unsigned int>, std::allocator<std::pair<unsigned int const, ns3::Ptr<ns3::SpectrumValue> > > >::emplace<unsigned int const&, ns3::Ptr<ns3::SpectrumValue>&> (1,130,669 samples, 0.12%)
std::_Tuple_impl<0ul, ns3::LteSpectrumPhy*>::_Tuple_impl<ns3::LteSpectrumPhy*&> (415,211 samples, 0.04%)
std::_Vector_base<unsigned short, std::allocator<unsigned short> >::_Vector_impl::~_Vector_impl (154,656 samples, 0.02%)
std::vector<std::vector<std::vector<ns3::RlcPduListElement_s, std::allocator<ns3::RlcPduListElement_s> >, std::allocator<std::vector<ns3::RlcPduListElement_s, std::allocator<ns3::RlcPduListElement_s> > > >, std::allocator<std::vector<std::vector<ns3::RlcPduListElement_s, std::allocator<ns3::RlcPduListElement_s> >, std::allocator<std::vector<ns3::RlcPduListElement_s, std::allocator<ns3::RlcPduListElement_s> > > > > >::_M_range_check (158,396 samples, 0.02%)
std::__cxx11::list<ns3::UlDciLteControlMessage, std::allocator<ns3::UlDciLteControlMessage> >::~list (231,280 samples, 0.02%)
std::pair<std::__strip_reference_wrapper<std::decay<ns3::Scheduler::EventKey const&>::type>::__type, std::__strip_reference_wrapper<std::decay<ns3::EventImpl* const&>::type>::__type> std::make_pair<ns3::Scheduler::EventKey const&, ns3::EventImpl* const&> (141,536 samples, 0.01%)
std::tuple_element<1ul, std::pair<unsigned int const&, ns3::Ptr<ns3::SpectrumValue>&> >::type&& std::get<1ul, unsigned int const&, ns3::Ptr<ns3::SpectrumValue>&> (161,945 samples, 0.02%)
__gnu_cxx::__normal_iterator<ns3::BuildDataListElement_s const*, std::vector<ns3::BuildDataListElement_s, std::allocator<ns3::BuildDataListElement_s> > >::operator* (163,914 samples, 0.02%)
std::vector<int, std::allocator<int> >::operator= (1,045,585 samples, 0.11%)
std::__new_allocator<double>::deallocate (190,332 samples, 0.02%)
ns3::Ptr<ns3::SpectrumValue const>::operator (129,312 samples, 0.01%)
ns3::LteSpectrumPhy::SetTxPowerSpectralDensity (1,023,722 samples, 0.11%)
std::pair<ns3::TbId_t, ns3::tbInfo_t>::~pair (656,469 samples, 0.07%)
void std::_Destroy<ns3::CqiListElement_s*, ns3::CqiListElement_s> (190,387 samples, 0.02%)
ns3::Ptr<ns3::SpectrumValue>::Ptr (158,198 samples, 0.02%)
std::__new_allocator<double>::allocate (126,483 samples, 0.01%)
std::vector<ns3::FfMacSchedSapProvider::SchedUlCqiInfoReqParameters, std::allocator<ns3::FfMacSchedSapProvider::SchedUlCqiInfoReqParameters> >::push_back (722,100 samples, 0.07%)
ns3::int64x64_t::int64x64_t (1,343,589 samples, 0.14%)
ns3::TagBuffer::WriteU16 (309,646 samples, 0.03%)
decltype (518,331 samples, 0.05%)
ns3::PfFfMacScheduler::DoSchedDlRlcBufferReq (605,673 samples, 0.06%)
std::_List_node<ns3::Ptr<ns3::LteControlMessage> >* std::__cxx11::list<ns3::Ptr<ns3::LteControlMessage>, std::allocator<ns3::Ptr<ns3::LteControlMessage> > >::_M_create_node<ns3::Ptr<ns3::LteControlMessage> const&> (494,618 samples, 0.05%)
std::vector<double, std::allocator<double> >::_M_default_initialize (1,425,764 samples, 0.15%)
std::_Rb_tree_node<unsigned short>::_M_valptr (202,650 samples, 0.02%)
std::vector<unsigned char, std::allocator<unsigned char> >::_S_relocate (348,271 samples, 0.04%)
ns3::TagBuffer::TagBuffer (294,318 samples, 0.03%)
std::_Rb_tree<ns3::LteSpectrumModelId, std::pair<ns3::LteSpectrumModelId const, ns3::Ptr<ns3::SpectrumModel> >, std::_Select1st<std::pair<ns3::LteSpectrumModelId const, ns3::Ptr<ns3::SpectrumModel> > >, std::less<ns3::LteSpectrumModelId>, std::allocator<std::pair<ns3::LteSpectrumModelId const, ns3::Ptr<ns3::SpectrumModel> > > >::_M_lower_bound (843,869 samples, 0.09%)
ns3::MakeEvent<void (379,721 samples, 0.04%)
ns3::Ptr<ns3::LteSpectrumSignalParametersDataFrame>::Ptr (160,095 samples, 0.02%)
std::allocator_traits<std::allocator<std::_Rb_tree_node<std::pair<ns3::Scheduler::EventKey const, ns3::EventImpl*> > > >::allocate (258,278 samples, 0.03%)
std::pair<std::_Rb_tree_node_base*, std::_Rb_tree_node_base*>::pair<std::_Rb_tree_node<std::pair<int const, double> >*&, std::_Rb_tree_node_base*&> (186,478 samples, 0.02%)
malloc (169,207 samples, 0.02%)
std::vector<unsigned short, std::allocator<unsigned short> >::~vector (242,607 samples, 0.03%)
ns3::TypeId::~TypeId (183,254 samples, 0.02%)
ns3::PacketMetadata::Recycle (521,509 samples, 0.05%)
std::allocator_traits<std::allocator<unsigned short> >::allocate (360,140 samples, 0.04%)
__gnu_cxx::__normal_iterator<ns3::VendorSpecificListElement_s const*, std::vector<ns3::VendorSpecificListElement_s, std::allocator<ns3::VendorSpecificListElement_s> > >::base (158,549 samples, 0.02%)
double* std::__uninitialized_copy_a<__gnu_cxx::__normal_iterator<double const*, std::vector<double, std::allocator<double> > >, double*, double> (251,522 samples, 0.03%)
ns3::Ptr<ns3::PacketBurst>::~Ptr (2,069,772 samples, 0.21%)
unsigned char* std::uninitialized_copy<__gnu_cxx::__normal_iterator<unsigned char const*, std::vector<unsigned char, std::allocator<unsigned char> > >, unsigned char*> (190,052 samples, 0.02%)
std::_Rb_tree<unsigned short, std::pair<unsigned short const, ns3::DlInfoListElement_s>, std::_Select1st<std::pair<unsigned short const, ns3::DlInfoListElement_s> >, std::less<unsigned short>, std::allocator<std::pair<unsigned short const, ns3::DlInfoListElement_s> > >::_M_get_insert_hint_unique_pos (501,334 samples, 0.05%)
ns3::IidManager::GetAttributeN (456,193 samples, 0.05%)
std::vector<ns3::Ptr<ns3::Object>, std::allocator<ns3::Ptr<ns3::Object> > >::clear (158,065 samples, 0.02%)
ns3::SimpleRefCount<ns3::LteControlMessage, ns3::Empty, ns3::DefaultDeleter<ns3::LteControlMessage> >::Ref (156,385 samples, 0.02%)
void std::_Function_base::_Base_manager<std::_Bind<void (489,748 samples, 0.05%)
unsigned long const& std::min<unsigned long> (159,495 samples, 0.02%)
unsigned char* std::__copy_move_a2<false, unsigned char const*, unsigned char*> (185,651 samples, 0.02%)
unsigned char* std::__uninitialized_copy<true>::__uninit_copy<__gnu_cxx::__normal_iterator<unsigned char const*, std::vector<unsigned char, std::allocator<unsigned char> > >, unsigned char*> (163,843 samples, 0.02%)
void std::__invoke_impl<void, ns3::Callback<void, ns3::SpectrumValue const&>::Callback<void (34,038,084 samples, 3.51%) v..
ns3::Packet::AddPacketTag (1,534,193 samples, 0.16%)
std::_Rb_tree<int, std::pair<int const, double>, std::_Select1st<std::pair<int const, double> >, std::less<int>, std::allocator<std::pair<int const, double> > >::_M_drop_node (325,437 samples, 0.03%)
std::vector<int, std::allocator<int> >::vector (677,875 samples, 0.07%)
std::_Tuple_impl<5ul, std::map<unsigned int, ns3::Ptr<ns3::SpectrumValue>, std::less<unsigned int>, std::allocator<std::pair<unsigned int const, ns3::Ptr<ns3::SpectrumValue> > > > >::~_Tuple_impl (220,721 samples, 0.02%)
std::function<void (2,496,720 samples, 0.26%)
std::vector<std::vector<ns3::RlcPduListElement_s, std::allocator<ns3::RlcPduListElement_s> >, std::allocator<std::vector<ns3::RlcPduListElement_s, std::allocator<ns3::RlcPduListElement_s> > > >::_M_range_check (228,068 samples, 0.02%)
ns3::Ptr<ns3::PacketBurst>::~Ptr (816,661 samples, 0.08%)
std::map<ns3::Scheduler::EventKey, ns3::EventImpl*, std::less<ns3::Scheduler::EventKey>, std::allocator<std::pair<ns3::Scheduler::EventKey const, ns3::EventImpl*> > >::lower_bound (2,631,944 samples, 0.27%)
__gnu_cxx::__normal_iterator<unsigned short*, std::vector<unsigned short, std::allocator<unsigned short> > >::__normal_iterator (153,496 samples, 0.02%)
ns3::TagBuffer::ReadU16 (721,482 samples, 0.07%)
ns3::Buffer::~Buffer (1,257,420 samples, 0.13%)
ns3::LteRlcSm::DoReceivePdu (5,629,506 samples, 0.58%)
void std::_Construct<ns3::HigherLayerSelected_s, ns3::HigherLayerSelected_s const&> (241,929 samples, 0.02%)
double* std::__uninitialized_default_n<double*, unsigned long> (152,182 samples, 0.02%)
ns3::Buffer::Create (1,901,878 samples, 0.20%)
ns3::DefaultSimulatorImpl::ScheduleWithContext (6,714,863 samples, 0.69%)
ns3::DlInfoListElement_s* std::__copy_move_a<false, ns3::DlInfoListElement_s*, ns3::DlInfoListElement_s*> (394,051 samples, 0.04%)
std::_Vector_base<int, std::allocator<int> >::_Vector_impl_data::_M_copy_data (368,766 samples, 0.04%)
ns3::CqiListElement_s* std::uninitialized_copy<__gnu_cxx::__normal_iterator<ns3::CqiListElement_s*, std::vector<ns3::CqiListElement_s, std::allocator<ns3::CqiListElement_s> > >, ns3::CqiListElement_s*> (3,635,299 samples, 0.37%)
std::_Rb_tree<ns3::Scheduler::EventKey, std::pair<ns3::Scheduler::EventKey const, ns3::EventImpl*>, std::_Select1st<std::pair<ns3::Scheduler::EventKey const, ns3::EventImpl*> >, std::less<ns3::Scheduler::EventKey>, std::allocator<std::pair<ns3::Scheduler::EventKey const, ns3::EventImpl*> > >::_Auto_node::_Auto_node<std::pair<ns3::Scheduler::EventKey, ns3::EventImpl*> > (403,625 samples, 0.04%)
std::_Rb_tree<unsigned char, std::pair<unsigned char const, ns3::LteMacSapProvider::ReportBufferStatusParameters>, std::_Select1st<std::pair<unsigned char const, ns3::LteMacSapProvider::ReportBufferStatusParameters> >, std::less<unsigned char>, std::allocator<std::pair<unsigned char const, ns3::LteMacSapProvider::ReportBufferStatusParameters> > >::_M_lower_bound (904,347 samples, 0.09%)
__gnu_cxx::__aligned_membuf<std::pair<unsigned short const, double> >::_M_addr (198,698 samples, 0.02%)
ns3::PacketBurst::~PacketBurst (269,240 samples, 0.03%)
unsigned short* std::__uninitialized_copy<true>::__uninit_copy<__gnu_cxx::__normal_iterator<unsigned short const*, std::vector<unsigned short, std::allocator<unsigned short> > >, unsigned short*> (534,449 samples, 0.06%)
ns3::Angles::Angles (388,419 samples, 0.04%)
std::vector<double, std::allocator<double> >::at (431,395 samples, 0.04%)
ns3::Time::GetMilliSeconds (240,705 samples, 0.02%)
std::_Rb_tree<unsigned short, std::pair<unsigned short const, ns3::SbMeasResult_s>, std::_Select1st<std::pair<unsigned short const, ns3::SbMeasResult_s> >, std::less<unsigned short>, std::allocator<std::pair<unsigned short const, ns3::SbMeasResult_s> > >::_S_key (240,787 samples, 0.02%)
std::_List_const_iterator<ns3::Callback<void, unsigned short, unsigned short, double> >::_List_const_iterator (194,040 samples, 0.02%)
std::_Rb_tree<ns3::Scheduler::EventKey, std::pair<ns3::Scheduler::EventKey const, ns3::EventImpl*>, std::_Select1st<std::pair<ns3::Scheduler::EventKey const, ns3::EventImpl*> >, std::less<ns3::Scheduler::EventKey>, std::allocator<std::pair<ns3::Scheduler::EventKey const, ns3::EventImpl*> > >::_Auto_node::_M_key (311,517 samples, 0.03%)
std::_Tuple_impl<2ul, double, ns3::Ptr<ns3::SpectrumSignalParameters>, ns3::Ptr<ns3::SpectrumPhy>, std::map<unsigned int, ns3::Ptr<ns3::SpectrumValue>, std::less<unsigned int>, std::allocator<std::pair<unsigned int const, ns3::Ptr<ns3::SpectrumValue> > > > >::_Tuple_impl<double&, ns3::Ptr<ns3::SpectrumSignalParameters>&, ns3::Ptr<ns3::SpectrumPhy>&, std::map<unsigned int, ns3::Ptr<ns3::SpectrumValue>, std::less<unsigned int>, std::allocator<std::pair<unsigned int const, ns3::Ptr<ns3::SpectrumValue> > > >&, void> (163,911 samples, 0.02%)
std::_Vector_base<ns3::PhichListElement_s, std::allocator<ns3::PhichListElement_s> >::~_Vector_base (153,471 samples, 0.02%)
std::map<unsigned short, ns3::SbMeasResult_s, std::less<unsigned short>, std::allocator<std::pair<unsigned short const, ns3::SbMeasResult_s> > >::end (191,621 samples, 0.02%)
bool __gnu_cxx::operator==<ns3::ByteTagListData* const*, std::vector<ns3::ByteTagListData*, std::allocator<ns3::ByteTagListData*> > > (160,543 samples, 0.02%)
ns3::PfFfMacScheduler::DoSchedDlCqiInfoReq (4,461,995 samples, 0.46%)
std::_Rb_tree<ns3::TbId_t, std::pair<ns3::TbId_t const, ns3::tbInfo_t>, std::_Select1st<std::pair<ns3::TbId_t const, ns3::tbInfo_t> >, std::less<ns3::TbId_t>, std::allocator<std::pair<ns3::TbId_t const, ns3::tbInfo_t> > >::_M_get_insert_unique_pos (403,662 samples, 0.04%)
decltype (351,931 samples, 0.04%)
ns3::RlcTag::GetTypeId (126,373 samples, 0.01%)
std::_Vector_base<int, std::allocator<int> >::_Vector_base (576,261 samples, 0.06%)
std::allocator_traits<std::allocator<std::_List_node<ns3::Ptr<ns3::PacketBurst> > > >::deallocate (158,232 samples, 0.02%)
ns3::LteSpectrumSignalParametersDataFrame::LteSpectrumSignalParametersDataFrame (6,515,982 samples, 0.67%)
std::_Rb_tree_node<std::pair<unsigned short const, std::map<unsigned char, ns3::LteMacSapUser*, std::less<unsigned char>, std::allocator<std::pair<unsigned char const, ns3::LteMacSapUser*> > > > >::_M_valptr (233,529 samples, 0.02%)
__libc_start_main (2,105,662 samples, 0.22%)
std::vector<double, std::allocator<double> >::vector (712,112 samples, 0.07%)
ns3::LteSpectrumSignalParametersDlCtrlFrame::~LteSpectrumSignalParametersDlCtrlFrame (656,172 samples, 0.07%)
std::vector<unsigned char, std::allocator<unsigned char> >::_M_check_len (226,478 samples, 0.02%)
__gnu_cxx::__normal_iterator<ns3::DlInfoListElement_s*, std::vector<ns3::DlInfoListElement_s, std::allocator<ns3::DlInfoListElement_s> > > std::__copy_move_a<false, __gnu_cxx::__normal_iterator<ns3::DlInfoListElement_s const*, std::vector<ns3::DlInfoListElement_s, std::allocator<ns3::DlInfoListElement_s> > >, __gnu_cxx::__normal_iterator<ns3::DlInfoListElement_s*, std::vector<ns3::DlInfoListElement_s, std::allocator<ns3::DlInfoListElement_s> > > > (293,879 samples, 0.03%)
ns3::PfFfMacScheduler::DoSchedDlTriggerReq (102,241,082 samples, 10.54%) ns3::PfFf..
ns3::Simulator::ScheduleWithContext (179,532 samples, 0.02%)
std::_Vector_base<unsigned short, std::allocator<unsigned short> >::_M_deallocate (126,977 samples, 0.01%)
std::__cxx11::list<ns3::Ptr<ns3::LteControlMessage>, std::allocator<ns3::Ptr<ns3::LteControlMessage> > >::back (197,417 samples, 0.02%)
(309,905 samples, 0.03%)
ns3::DefaultSimulatorImpl::ProcessEventsWithContext (229,456 samples, 0.02%)
ns3::ByteTagList::ByteTagList (194,885 samples, 0.02%)
unsigned char* std::uninitialized_copy<__gnu_cxx::__normal_iterator<unsigned char const*, std::vector<unsigned char, std::allocator<unsigned char> > >, unsigned char*> (356,896 samples, 0.04%)
ns3::LteRlcSpecificLteMacSapUser::NotifyTxOpportunity (19,853,193 samples, 2.05%)
ns3::SpectrumValue::ConstValuesEnd (330,602 samples, 0.03%)
std::_Vector_base<unsigned short, std::allocator<unsigned short> >::_Vector_base (189,435 samples, 0.02%)
ns3::TypeId::SetUid (156,879 samples, 0.02%)
std::_Rb_tree_node<std::pair<unsigned short const, unsigned int> >::_M_valptr (265,616 samples, 0.03%)
ns3::Object::Object (1,324,951 samples, 0.14%)
std::vector<ns3::Ptr<ns3::Object>, std::allocator<ns3::Ptr<ns3::Object> > >::clear (272,736 samples, 0.03%)
unsigned char* std::__uninitialized_copy<true>::__uninit_copy<__gnu_cxx::__normal_iterator<unsigned char const*, std::vector<unsigned char, std::allocator<unsigned char> > >, unsigned char*> (360,886 samples, 0.04%)
std::__cxx11::_List_base<ns3::Ptr<ns3::Packet>, std::allocator<ns3::Ptr<ns3::Packet> > >::_M_put_node (124,434 samples, 0.01%)
std::__new_allocator<double>::deallocate (237,323 samples, 0.02%)
std::_Rb_tree<unsigned short, std::pair<unsigned short const, ns3::Ptr<ns3::UeManager> >, std::_Select1st<std::pair<unsigned short const, ns3::Ptr<ns3::UeManager> > >, std::less<unsigned short>, std::allocator<std::pair<unsigned short const, ns3::Ptr<ns3::UeManager> > > >::find (1,377,498 samples, 0.14%)
std::_Rb_tree<unsigned int, std::pair<unsigned int const, ns3::TxSpectrumModelInfo>, std::_Select1st<std::pair<unsigned int const, ns3::TxSpectrumModelInfo> >, std::less<unsigned int>, std::allocator<std::pair<unsigned int const, ns3::TxSpectrumModelInfo> > >::_S_key (613,816 samples, 0.06%)
ns3::CqiListElement_s* std::__do_uninit_copy<__gnu_cxx::__normal_iterator<ns3::CqiListElement_s*, std::vector<ns3::CqiListElement_s, std::allocator<ns3::CqiListElement_s> > >, ns3::CqiListElement_s*> (1,085,784 samples, 0.11%)
ns3::RlcTag::Serialize (343,838 samples, 0.04%)
std::_Rb_tree_node<std::pair<unsigned short const, ns3::SbMeasResult_s> >::_M_valptr (240,787 samples, 0.02%)
std::_Rb_tree<unsigned int, std::pair<unsigned int const, ns3::Ptr<ns3::SpectrumValue> >, std::_Select1st<std::pair<unsigned int const, ns3::Ptr<ns3::SpectrumValue> > >, std::less<unsigned int>, std::allocator<std::pair<unsigned int const, ns3::Ptr<ns3::SpectrumValue> > > >::_Auto_node::_M_key (128,223 samples, 0.01%)
std::_Vector_base<ns3::VendorSpecificListElement_s, std::allocator<ns3::VendorSpecificListElement_s> >::~_Vector_base (242,999 samples, 0.03%)
std::_Rb_tree<unsigned char, std::pair<unsigned char const, ns3::LteMacSapUser*>, std::_Select1st<std::pair<unsigned char const, ns3::LteMacSapUser*> >, std::less<unsigned char>, std::allocator<std::pair<unsigned char const, ns3::LteMacSapUser*> > >::find (964,623 samples, 0.10%)
ns3::int64x64_t::GetDouble (246,625 samples, 0.03%)
std::function<void (282,732 samples, 0.03%)
ns3::SimpleRefCount<ns3::Packet, ns3::Empty, ns3::DefaultDeleter<ns3::Packet> >::Unref (2,803,402 samples, 0.29%)
std::_Vector_base<ns3::VendorSpecificListElement_s, std::allocator<ns3::VendorSpecificListElement_s> >::_M_allocate (238,842 samples, 0.02%)
__gnu_cxx::__aligned_membuf<std::pair<unsigned short const, std::vector<std::vector<std::vector<ns3::RlcPduListElement_s, std::allocator<ns3::RlcPduListElement_s> >, std::allocator<std::vector<ns3::RlcPduListElement_s, std::allocator<ns3::RlcPduListElement_s> > > >, std::allocator<std::vector<std::vector<ns3::RlcPduListElement_s, std::allocator<ns3::RlcPduListElement_s> >, std::allocator<std::vector<ns3::RlcPduListElement_s, std::allocator<ns3::RlcPduListElement_s> > > > > > > >::_M_ptr (201,235 samples, 0.02%)
std::vector<std::vector<std::vector<ns3::RlcPduListElement_s, std::allocator<ns3::RlcPduListElement_s> >, std::allocator<std::vector<ns3::RlcPduListElement_s, std::allocator<ns3::RlcPduListElement_s> > > >, std::allocator<std::vector<std::vector<ns3::RlcPduListElement_s, std::allocator<ns3::RlcPduListElement_s> >, std::allocator<std::vector<ns3::RlcPduListElement_s, std::allocator<ns3::RlcPduListElement_s> > > > > >::at (311,692 samples, 0.03%)
ns3::DlDciLteControlMessage::SetDci (501,657 samples, 0.05%)
ns3::SpectrumValue::operator*= (412,379 samples, 0.04%)
std::_Head_base<1ul, ns3::Ptr<ns3::SpectrumValue>, false>::_M_head (146,531 samples, 0.02%)
std::__cxx11::list<ns3::Ptr<ns3::LteControlMessage>, std::allocator<ns3::Ptr<ns3::LteControlMessage> > >::~list (466,245 samples, 0.05%)
decltype (127,066 samples, 0.01%)
std::_Rb_tree_node<std::pair<unsigned int const, ns3::Ptr<ns3::SpectrumValue> > >::_M_valptr (128,223 samples, 0.01%)
__gnu_cxx::__promote_2<decltype (555,396 samples, 0.06%)
ns3::SimpleRefCount<ns3::Object, ns3::ObjectBase, ns3::ObjectDeleter>::Unref (384,276 samples, 0.04%)
std::_Vector_base<ns3::HarqProcessInfoElement_t, std::allocator<ns3::HarqProcessInfoElement_t> >::get_allocator (277,666 samples, 0.03%)
std::__cxx11::list<ns3::Ptr<ns3::LteControlMessage>, std::allocator<ns3::Ptr<ns3::LteControlMessage> > >::~list (159,855 samples, 0.02%)
ns3::TracedCallback<ns3::Ptr<ns3::SpectrumSignalParameters> >::operator (618,076 samples, 0.06%)
ns3::NoOpComponentCarrierManager::DoReportBufferStatus (1,019,985 samples, 0.11%)
ns3::PacketBurst::~PacketBurst (2,253,374 samples, 0.23%)
ns3::LogComponent::IsEnabled (152,096 samples, 0.02%)
std::_Rb_tree<unsigned short, std::pair<unsigned short const, std::vector<unsigned char, std::allocator<unsigned char> > >, std::_Select1st<std::pair<unsigned short const, std::vector<unsigned char, std::allocator<unsigned char> > > >, std::less<unsigned short>, std::allocator<std::pair<unsigned short const, std::vector<unsigned char, std::allocator<unsigned char> > > > >::find (1,373,897 samples, 0.14%)
std::map<unsigned char, ns3::LteMacSapUser*, std::less<unsigned char>, std::allocator<std::pair<unsigned char const, ns3::LteMacSapUser*> > >::find (224,964 samples, 0.02%)
std::vector<ns3::ByteTagListData*, std::allocator<ns3::ByteTagListData*> >::end (167,215 samples, 0.02%)
int* std::uninitialized_copy<__gnu_cxx::__normal_iterator<int const*, std::vector<int, std::allocator<int> > >, int*> (268,424 samples, 0.03%)
std::_Rb_tree<unsigned char, std::pair<unsigned char const, ns3::LteUeMac::LcInfo>, std::_Select1st<std::pair<unsigned char const, ns3::LteUeMac::LcInfo> >, std::less<unsigned char>, std::allocator<std::pair<unsigned char const, ns3::LteUeMac::LcInfo> > >::_M_lower_bound (893,620 samples, 0.09%)
ns3::Ptr<ns3::DlDciLteControlMessage>::Ptr (301,451 samples, 0.03%)
std::_Rb_tree_iterator<std::pair<unsigned short const, std::map<unsigned char, ns3::LteMacSapUser*, std::less<unsigned char>, std::allocator<std::pair<unsigned char const, ns3::LteMacSapUser*> > > > >::operator (160,344 samples, 0.02%)
std::__cxx11::list<ns3::Ptr<ns3::LteControlMessage>, std::allocator<ns3::Ptr<ns3::LteControlMessage> > >* std::__copy_move<true, false, std::random_access_iterator_tag>::__copy_m<std::__cxx11::list<ns3::Ptr<ns3::LteControlMessage>, std::allocator<ns3::Ptr<ns3::LteControlMessage> > >*, std::__cxx11::list<ns3::Ptr<ns3::LteControlMessage>, std::allocator<ns3::Ptr<ns3::LteControlMessage> > >*> (154,567 samples, 0.02%)
ns3::ByteTagList::Add (1,876,916 samples, 0.19%)
ns3::DlInfoListElement_s* std::uninitialized_copy<__gnu_cxx::__normal_iterator<ns3::DlInfoListElement_s const*, std::vector<ns3::DlInfoListElement_s, std::allocator<ns3::DlInfoListElement_s> > >, ns3::DlInfoListElement_s*> (411,592 samples, 0.04%)
std::enable_if<is_invocable_r_v<void, void (324,769 samples, 0.03%)
std::vector<double, std::allocator<double> >::vector (276,695 samples, 0.03%)
int const* std::__niter_base<int const*, std::vector<int, std::allocator<int> > > (149,777 samples, 0.02%)
ns3::SimpleRefCount<ns3::EventImpl, ns3::Empty, ns3::DefaultDeleter<ns3::EventImpl> >::Unref (635,403 samples, 0.07%)
std::_Rb_tree_iterator<std::pair<unsigned int const, ns3::RxSpectrumModelInfo> >::_Rb_tree_iterator (128,201 samples, 0.01%)
ns3::SimpleUeComponentCarrierManager::DoNotifyTxOpportunity (21,809,279 samples, 2.25%)
std::pair<std::_Rb_tree_node_base*, std::_Rb_tree_node_base*>::pair (186,508 samples, 0.02%)
std::_Head_base<1ul, ns3::Ptr<ns3::SpectrumValue const>, false>::_M_head (163,671 samples, 0.02%)
void std::allocator_traits<std::allocator<std::_Rb_tree_node<std::pair<ns3::TbId_t const, ns3::tbInfo_t> > > >::destroy<std::pair<ns3::TbId_t const, ns3::tbInfo_t> > (1,015,028 samples, 0.10%)
std::function<void (891,744,980 samples, 91.95%) std::function<void
ns3::HarqProcessInfoElement_t* std::uninitialized_copy<__gnu_cxx::__normal_iterator<ns3::HarqProcessInfoElement_t const*, std::vector<ns3::HarqProcessInfoElement_t, std::allocator<ns3::HarqProcessInfoElement_t> > >, ns3::HarqProcessInfoElement_t*> (1,522,938 samples, 0.16%)
std::_Function_handler<void (2,105,662 samples, 0.22%)
std::less<unsigned short>::operator (232,709 samples, 0.02%)
std::_Tuple_impl<3ul, ns3::Ptr<ns3::SpectrumSignalParameters>, ns3::Ptr<ns3::SpectrumPhy>, std::map<unsigned int, ns3::Ptr<ns3::SpectrumValue>, std::less<unsigned int>, std::allocator<std::pair<unsigned int const, ns3::Ptr<ns3::SpectrumValue> > > > >::~_Tuple_impl (297,048 samples, 0.03%)
ns3::PacketBurst::~PacketBurst (460,732 samples, 0.05%)
std::map<unsigned short, std::vector<unsigned short, std::allocator<unsigned short> >, std::less<unsigned short>, std::allocator<std::pair<unsigned short const, std::vector<unsigned short, std::allocator<unsigned short> > > > >::lower_bound (455,631 samples, 0.05%)
std::_Rb_tree<unsigned short, std::pair<unsigned short const, ns3::pfsFlowPerf_t>, std::_Select1st<std::pair<unsigned short const, ns3::pfsFlowPerf_t> >, std::less<unsigned short>, std::allocator<std::pair<unsigned short const, ns3::pfsFlowPerf_t> > >::find (198,041 samples, 0.02%)
ns3::Ptr<ns3::EventImpl>::Ptr (124,898 samples, 0.01%)
ns3::Buffer::Buffer (535,246 samples, 0.06%)
std::_Rb_tree<unsigned short, std::pair<unsigned short const, std::vector<ns3::UlDciListElement_s, std::allocator<ns3::UlDciListElement_s> > >, std::_Select1st<std::pair<unsigned short const, std::vector<ns3::UlDciListElement_s, std::allocator<ns3::UlDciListElement_s> > > >, std::less<unsigned short>, std::allocator<std::pair<unsigned short const, std::vector<ns3::UlDciListElement_s, std::allocator<ns3::UlDciListElement_s> > > > >::_M_lower_bound (347,387 samples, 0.04%)
std::_Rb_tree<ns3::TbId_t, std::pair<ns3::TbId_t const, ns3::tbInfo_t>, std::_Select1st<std::pair<ns3::TbId_t const, ns3::tbInfo_t> >, std::less<ns3::TbId_t>, std::allocator<std::pair<ns3::TbId_t const, ns3::tbInfo_t> > >::clear (2,200,745 samples, 0.23%)
std::vector<int, std::allocator<int> >::end (186,424 samples, 0.02%)
std::vector<ns3::HigherLayerSelected_s, std::allocator<ns3::HigherLayerSelected_s> >::_M_check_len (162,250 samples, 0.02%)
void std::_Destroy<ns3::PhichListElement_s*> (154,556 samples, 0.02%)
ns3::Object::DoDelete (4,921,016 samples, 0.51%)
ns3::LteSpectrumPhy::SetTxPowerSpectralDensity (252,668 samples, 0.03%)
ns3::operator< (151,762 samples, 0.02%)
ns3::SimpleRefCount<ns3::Object, ns3::ObjectBase, ns3::ObjectDeleter>::SimpleRefCount (283,524 samples, 0.03%)
ns3::MapScheduler::RemoveNext (12,466,528 samples, 1.29%)
std::allocator_traits<std::allocator<double> >::deallocate (276,642 samples, 0.03%)
ns3::TimeStep (151,604 samples, 0.02%)
ns3::Packet::Copy (1,194,409 samples, 0.12%)
std::_Rb_tree<unsigned int, std::pair<unsigned int const, ns3::Ptr<ns3::SpectrumValue> >, std::_Select1st<std::pair<unsigned int const, ns3::Ptr<ns3::SpectrumValue> > >, std::less<unsigned int>, std::allocator<std::pair<unsigned int const, ns3::Ptr<ns3::SpectrumValue> > > >::_Rb_tree (155,456 samples, 0.02%)
__gnu_cxx::__normal_iterator<unsigned short*, std::vector<unsigned short, std::allocator<unsigned short> > >::base (158,533 samples, 0.02%)
ns3::SimpleRefCount<ns3::EventImpl, ns3::Empty, ns3::DefaultDeleter<ns3::EventImpl> >::Unref (565,943 samples, 0.06%)
__gnu_cxx::__normal_iterator<ns3::HigherLayerSelected_s*, std::vector<ns3::HigherLayerSelected_s, std::allocator<ns3::HigherLayerSelected_s> > > std::__niter_wrap<__gnu_cxx::__normal_iterator<ns3::HigherLayerSelected_s*, std::vector<ns3::HigherLayerSelected_s, std::allocator<ns3::HigherLayerSelected_s> > >, ns3::HigherLayerSelected_s*> (126,370 samples, 0.01%)
std::_Vector_base<ns3::DlInfoListElement_s::HarqStatus_e, std::allocator<ns3::DlInfoListElement_s::HarqStatus_e> >::_M_create_storage (403,537 samples, 0.04%)
std::vector<ns3::Buffer::Data*, std::allocator<ns3::Buffer::Data*> >::size (288,898 samples, 0.03%)
std::_Rb_tree<ns3::TbId_t, std::pair<ns3::TbId_t const, ns3::tbInfo_t>, std::_Select1st<std::pair<ns3::TbId_t const, ns3::tbInfo_t> >, std::less<ns3::TbId_t>, std::allocator<std::pair<ns3::TbId_t const, ns3::tbInfo_t> > >::_M_get_insert_unique_pos (357,360 samples, 0.04%)
std::map<unsigned char, ns3::LteMacSapUser*, std::less<unsigned char>, std::allocator<std::pair<unsigned char const, ns3::LteMacSapUser*> > >::find (562,566 samples, 0.06%)
ns3::HarqProcessInfoElement_t* std::copy<__gnu_cxx::__normal_iterator<ns3::HarqProcessInfoElement_t const*, std::vector<ns3::HarqProcessInfoElement_t, std::allocator<ns3::HarqProcessInfoElement_t> > >, ns3::HarqProcessInfoElement_t*> (447,796 samples, 0.05%)
std::_Rb_tree<ns3::TbId_t, std::pair<ns3::TbId_t const, ns3::tbInfo_t>, std::_Select1st<std::pair<ns3::TbId_t const, ns3::tbInfo_t> >, std::less<ns3::TbId_t>, std::allocator<std::pair<ns3::TbId_t const, ns3::tbInfo_t> > >::_M_insert_node (194,473 samples, 0.02%)
void std::destroy_at<ns3::CqiListElement_s> (154,796 samples, 0.02%)
std::_Vector_base<ns3::VendorSpecificListElement_s, std::allocator<ns3::VendorSpecificListElement_s> >::_Vector_base (443,709 samples, 0.05%)
ns3::Object::DoDelete (8,154,602 samples, 0.84%)
std::pair<std::_Rb_tree_node_base*, std::_Rb_tree_node_base*>::pair<std::_Rb_tree_node<std::pair<ns3::TbId_t const, ns3::tbInfo_t> >*&, std::_Rb_tree_node_base*&> (331,552 samples, 0.03%)
std::map<unsigned short, std::vector<ns3::DlDciListElement_s, std::allocator<ns3::DlDciListElement_s> >, std::less<unsigned short>, std::allocator<std::pair<unsigned short const, std::vector<ns3::DlDciListElement_s, std::allocator<ns3::DlDciListElement_s> > > > >::find (184,813 samples, 0.02%)
ns3::HigherLayerSelected_s* std::__copy_move_a2<false, ns3::HigherLayerSelected_s const*, ns3::HigherLayerSelected_s*> (193,644 samples, 0.02%)
std::__cxx11::_List_base<ns3::UlDciLteControlMessage, std::allocator<ns3::UlDciLteControlMessage> >::_M_put_node (199,431 samples, 0.02%)
std::_Rb_tree<unsigned short, std::pair<unsigned short const, unsigned int>, std::_Select1st<std::pair<unsigned short const, unsigned int> >, std::less<unsigned short>, std::allocator<std::pair<unsigned short const, unsigned int> > >::begin (148,580 samples, 0.02%)
[libc.so.6] (270,636 samples, 0.03%)
ns3::MapScheduler::Insert (407,207 samples, 0.04%)
ns3::Ptr<ns3::Packet>::~Ptr (392,648 samples, 0.04%)
void std::_Destroy<__gnu_cxx::__normal_iterator<ns3::VendorSpecificListElement_s*, std::vector<ns3::VendorSpecificListElement_s, std::allocator<ns3::VendorSpecificListElement_s> > > > (317,071 samples, 0.03%)
std::_Vector_base<ns3::BuildDataListElement_s, std::allocator<ns3::BuildDataListElement_s> >::_M_create_storage (253,158 samples, 0.03%)
std::function<void (495,402 samples, 0.05%)
std::__cxx11::list<ns3::Ptr<ns3::LteControlMessage>, std::allocator<ns3::Ptr<ns3::LteControlMessage> > >::operator= (155,136 samples, 0.02%)
std::_Vector_base<double, std::allocator<double> >::_M_allocate (266,378 samples, 0.03%)
double* std::__uninitialized_copy<true>::__uninit_copy<__gnu_cxx::__normal_iterator<double const*, std::vector<double, std::allocator<double> > >, double*> (979,447 samples, 0.10%)
ns3::SpectrumConverter::Convert (724,879 samples, 0.07%)
std::__cxx11::list<ns3::Ptr<ns3::LteControlMessage>, std::allocator<ns3::Ptr<ns3::LteControlMessage> > >::list<std::_List_iterator<ns3::Ptr<ns3::LteControlMessage> >, void> (1,329,282 samples, 0.14%)
ns3::LteChunkProcessor::End (22,516,339 samples, 2.32%)
std::allocator_traits<std::allocator<ns3::BuildDataListElement_s> >::allocate (158,386 samples, 0.02%)
std::__cxx11::list<ns3::Ptr<ns3::Packet>, std::allocator<ns3::Ptr<ns3::Packet> > >::push_back (307,397 samples, 0.03%)
unsigned char* std::__uninitialized_copy_a<__gnu_cxx::__normal_iterator<unsigned char const*, std::vector<unsigned char, std::allocator<unsigned char> > >, unsigned char*, unsigned char> (685,962 samples, 0.07%)
std::__cxx11::list<ns3::Ptr<ns3::LteControlMessage>, std::allocator<ns3::Ptr<ns3::LteControlMessage> > >::back (161,548 samples, 0.02%)
void std::__invoke_impl<void, void (14,431,856 samples, 1.49%)
std::vector<ns3::DlInfoListElement_s, std::allocator<ns3::DlInfoListElement_s> >::_M_erase_at_end (1,267,352 samples, 0.13%)
ns3::Ptr<ns3::SpectrumModel const>::Ptr<ns3::SpectrumModel> (555,656 samples, 0.06%)
ns3::SpectrumValue::SpectrumValue (869,023 samples, 0.09%)
[ld-linux-x86-64.so.2] (155,299 samples, 0.02%)
ns3::DefaultSimulatorImpl::ScheduleWithContext (179,532 samples, 0.02%)
std::vector<ns3::HarqProcessInfoElement_t, std::allocator<ns3::HarqProcessInfoElement_t> >::vector (261,998 samples, 0.03%)
std::_Rb_tree<ns3::Scheduler::EventKey, std::pair<ns3::Scheduler::EventKey const, ns3::EventImpl*>, std::_Select1st<std::pair<ns3::Scheduler::EventKey const, ns3::EventImpl*> >, std::less<ns3::Scheduler::EventKey>, std::allocator<std::pair<ns3::Scheduler::EventKey const, ns3::EventImpl*> > >::_Auto_node::_M_key (191,540 samples, 0.02%)
void std::__invoke_impl<void, std::_Bind<void (22,443,594 samples, 2.31%)
ns3::HarqProcessInfoElement_t* std::__uninitialized_copy<true>::__uninit_copy<__gnu_cxx::__normal_iterator<ns3::HarqProcessInfoElement_t const*, std::vector<ns3::HarqProcessInfoElement_t, std::allocator<ns3::HarqProcessInfoElement_t> > >, ns3::HarqProcessInfoElement_t*> (185,369 samples, 0.02%)
std::_Rb_tree_node<std::pair<int const, double> >* std::_Rb_tree<int, std::pair<int const, double>, std::_Select1st<std::pair<int const, double> >, std::less<int>, std::allocator<std::pair<int const, double> > >::_M_copy<false, std::_Rb_tree<int, std::pair<int const, double>, std::_Select1st<std::pair<int const, double> >, std::less<int>, std::allocator<std::pair<int const, double> > >::_Alloc_node> (294,404 samples, 0.03%)
ns3::CallbackImpl<void, ns3::SpectrumValue const&>::operator (20,037,682 samples, 2.07%)
unsigned short* std::__uninitialized_copy_a<__gnu_cxx::__normal_iterator<unsigned short const*, std::vector<unsigned short, std::allocator<unsigned short> > >, unsigned short*, unsigned short> (192,062 samples, 0.02%)
std::allocator<std::_Rb_tree_node<std::pair<unsigned int const, ns3::Ptr<ns3::SpectrumValue> > > >::deallocate (164,554 samples, 0.02%)
std::vector<unsigned short, std::allocator<unsigned short> >::operator= (1,223,540 samples, 0.13%)
ns3::Buffer::Buffer (165,400 samples, 0.02%)
ns3::Ptr<ns3::MobilityModel>::Ptr (189,531 samples, 0.02%)
std::_Rb_tree<unsigned short, std::pair<unsigned short const, std::vector<unsigned short, std::allocator<unsigned short> > >, std::_Select1st<std::pair<unsigned short const, std::vector<unsigned short, std::allocator<unsigned short> > > >, std::less<unsigned short>, std::allocator<std::pair<unsigned short const, std::vector<unsigned short, std::allocator<unsigned short> > > > >::_M_get_Node_allocator (204,937 samples, 0.02%)
double* std::fill_n<double*, unsigned long, double> (550,124 samples, 0.06%)
std::vector<ns3::VendorSpecificListElement_s, std::allocator<ns3::VendorSpecificListElement_s> >::~vector (153,009 samples, 0.02%)
bool __gnu_cxx::operator==<ns3::HigherLayerSelected_s const*, std::vector<ns3::HigherLayerSelected_s, std::allocator<ns3::HigherLayerSelected_s> > > (229,505 samples, 0.02%)
ns3::EnbMacMemberFfMacSchedSapUser::SchedDlConfigInd (19,285,336 samples, 1.99%)
(157,592 samples, 0.02%)
ns3::NoOpComponentCarrierManager::DoReceivePdu (7,688,560 samples, 0.79%)
std::_Rb_tree<ns3::TbId_t, std::pair<ns3::TbId_t const, ns3::tbInfo_t>, std::_Select1st<std::pair<ns3::TbId_t const, ns3::tbInfo_t> >, std::less<ns3::TbId_t>, std::allocator<std::pair<ns3::TbId_t const, ns3::tbInfo_t> > >::_M_drop_node (1,378,012 samples, 0.14%)
unsigned char* std::__copy_move_a<false, __gnu_cxx::__normal_iterator<unsigned char const*, std::vector<unsigned char, std::allocator<unsigned char> > >, unsigned char*> (280,915 samples, 0.03%)
[ld-linux-x86-64.so.2] (279,737 samples, 0.03%)
std::vector<unsigned char, std::allocator<unsigned char> >::vector (153,635 samples, 0.02%)
ns3::SbMeasResult_s::operator= (986,836 samples, 0.10%)
ns3::FfMacSchedSapProvider::SchedUlCqiInfoReqParameters::~SchedUlCqiInfoReqParameters (544,597 samples, 0.06%)
double* std::__copy_move_a2<false, double const*, double*> (157,987 samples, 0.02%)
ns3::SpectrumValue::operator= (829,393 samples, 0.09%)
std::less<ns3::Scheduler::EventKey>::operator (678,555 samples, 0.07%)
std::__cxx11::list<ns3::AttributeConstructionList::Item, std::allocator<ns3::AttributeConstructionList::Item> >::list (568,564 samples, 0.06%)
unsigned short* std::uninitialized_copy<__gnu_cxx::__normal_iterator<unsigned short const*, std::vector<unsigned short, std::allocator<unsigned short> > >, unsigned short*> (575,480 samples, 0.06%)
ns3::SimpleUeCcmMacSapUser::NotifyTxOpportunity (21,852,046 samples, 2.25%)
void std::_Destroy<ns3::CqiListElement_s*, ns3::CqiListElement_s> (183,284 samples, 0.02%)
std::_Vector_base<ns3::DlInfoListElement_s, std::allocator<ns3::DlInfoListElement_s> >::_M_deallocate (158,001 samples, 0.02%)
std::__cxx11::list<ns3::Ptr<ns3::LteControlMessage>, std::allocator<ns3::Ptr<ns3::LteControlMessage> > >::_M_move_assign (524,495 samples, 0.05%)
ns3::Node::DoDispose (238,924 samples, 0.02%)
std::_Vector_base<double, std::allocator<double> >::_M_create_storage (150,187 samples, 0.02%)
std::function<void (1,713,426 samples, 0.18%)
ns3::LteSpectrumPhy::GetDevice (383,185 samples, 0.04%)
ns3::UlInfoListElement_s* std::vector<ns3::UlInfoListElement_s, std::allocator<ns3::UlInfoListElement_s> >::_M_allocate_and_copy<__gnu_cxx::__normal_iterator<ns3::UlInfoListElement_s const*, std::vector<ns3::UlInfoListElement_s, std::allocator<ns3::UlInfoListElement_s> > > > (1,018,809 samples, 0.11%)
std::_Vector_base<unsigned short, std::allocator<unsigned short> >::~_Vector_base (233,349 samples, 0.02%)
ns3::PacketBurst::AddPacket (2,126,604 samples, 0.22%)
ns3::PacketMetadata::PacketMetadata (262,148 samples, 0.03%)
ns3::LteEnbPhy::ReportUlHarqFeedback (652,539 samples, 0.07%)
ns3::EnbMacMemberFfMacSchedSapUser::SchedDlConfigInd (41,165,130 samples, 4.24%) ns..
std::vector<ns3::DlInfoListElement_s, std::allocator<ns3::DlInfoListElement_s> >::~vector (470,466 samples, 0.05%)
std::vector<unsigned short, std::allocator<unsigned short> >::vector (235,913 samples, 0.02%)
ns3::HarqProcessInfoElement_t const* std::__niter_base<ns3::HarqProcessInfoElement_t const*, std::vector<ns3::HarqProcessInfoElement_t, std::allocator<ns3::HarqProcessInfoElement_t> > > (200,788 samples, 0.02%)
std::_Vector_base<double, std::allocator<double> >::_Vector_impl_data::_Vector_impl_data (146,004 samples, 0.02%)
unsigned char* std::__fill_n_a<unsigned char*, unsigned long, unsigned char> (268,012 samples, 0.03%)
ns3::Time::GetSeconds (693,056 samples, 0.07%)
ns3::PacketTagList::Remove (349,447 samples, 0.04%)
std::_Rb_tree<unsigned short, std::pair<unsigned short const, std::vector<unsigned short, std::allocator<unsigned short> > >, std::_Select1st<std::pair<unsigned short const, std::vector<unsigned short, std::allocator<unsigned short> > > >, std::less<unsigned short>, std::allocator<std::pair<unsigned short const, std::vector<unsigned short, std::allocator<unsigned short> > > > >::_M_drop_node (496,453 samples, 0.05%)
ns3::LogComponent::IsEnabled (199,761 samples, 0.02%)
std::vector<std::vector<ns3::HarqProcessInfoElement_t, std::allocator<ns3::HarqProcessInfoElement_t> >, std::allocator<std::vector<ns3::HarqProcessInfoElement_t, std::allocator<ns3::HarqProcessInfoElement_t> > > >::at (589,794 samples, 0.06%)
ns3::DlDciListElement_s::DlDciListElement_s (3,299,485 samples, 0.34%)
ns3::Ptr<ns3::PacketBurst> ns3::CreateObject<ns3::PacketBurst> (4,247,837 samples, 0.44%)
std::enable_if<is_invocable_r_v<void, void (19,263,971 samples, 1.99%)
ns3::Ptr<ns3::PacketBurst const>::~Ptr (148,119 samples, 0.02%)
std::_Rb_tree<unsigned short, std::pair<unsigned short const, std::map<unsigned char, ns3::LteMacSapUser*, std::less<unsigned char>, std::allocator<std::pair<unsigned char const, ns3::LteMacSapUser*> > > >, std::_Select1st<std::pair<unsigned short const, std::map<unsigned char, ns3::LteMacSapUser*, std::less<unsigned char>, std::allocator<std::pair<unsigned char const, ns3::LteMacSapUser*> > > > >, std::less<unsigned short>, std::allocator<std::pair<unsigned short const, std::map<unsigned char, ns3::LteMacSapUser*, std::less<unsigned char>, std::allocator<std::pair<unsigned char const, ns3::LteMacSapUser*> > > > > >::_S_key (503,437 samples, 0.05%)
std::__detail::_List_node_header::_List_node_header (572,667 samples, 0.06%)
void std::_Destroy_aux<false>::__destroy<ns3::Ptr<ns3::Object>*> (162,694 samples, 0.02%)
void std::_Function_base::_Base_manager<std::_Bind<void (153,002 samples, 0.02%)
ns3::LteUePhy::ReceiveLteControlMessageList (71,922,230 samples, 7.42%) ns3::L..
std::_Vector_base<int, std::allocator<int> >::_M_get_Tp_allocator (179,945 samples, 0.02%)
ns3::LteUePhy::QueueSubChannelsForTransmission (714,483 samples, 0.07%)
ns3::DlInfoListElement_s::HarqStatus_e* std::__copy_move_a1<false, ns3::DlInfoListElement_s::HarqStatus_e const*, ns3::DlInfoListElement_s::HarqStatus_e*> (158,174 samples, 0.02%)
std::__cxx11::list<ns3::Ptr<ns3::LteControlMessage>, std::allocator<ns3::Ptr<ns3::LteControlMessage> > >::operator= (1,174,367 samples, 0.12%)
std::map<unsigned char, ns3::LteUeMac::LcInfo, std::less<unsigned char>, std::allocator<std::pair<unsigned char const, ns3::LteUeMac::LcInfo> > >::find (1,463,058 samples, 0.15%)
ns3::LteRlcSm::DoNotifyTxOpportunity (2,715,978 samples, 0.28%)
ns3::Object::DoDelete (1,607,547 samples, 0.17%)
ns3::PacketTagList::~PacketTagList (184,330 samples, 0.02%)
unsigned short* std::copy<__gnu_cxx::__normal_iterator<unsigned short const*, std::vector<unsigned short, std::allocator<unsigned short> > >, unsigned short*> (649,960 samples, 0.07%)
std::_Rb_tree_node<std::pair<unsigned char const, ns3::LteCcmMacSapProvider*> >::_M_valptr (243,580 samples, 0.03%)
(247,279 samples, 0.03%)
std::_List_node<ns3::Ptr<ns3::Packet> >* std::__cxx11::list<ns3::Ptr<ns3::Packet>, std::allocator<ns3::Ptr<ns3::Packet> > >::_M_create_node<ns3::Ptr<ns3::Packet> const&> (194,175 samples, 0.02%)
std::__tuple_compare<std::tuple<double const&, double const&, double const&>, std::tuple<double const&, double const&, double const&>, 0ul, 3ul>::__eq (2,160,599 samples, 0.22%)
double* std::uninitialized_copy<__gnu_cxx::__normal_iterator<double const*, std::vector<double, std::allocator<double> > >, double*> (156,421 samples, 0.02%)
ns3::DefaultSimulatorImpl::Run (2,105,662 samples, 0.22%)
void std::__cxx11::list<ns3::Ptr<ns3::Packet>, std::allocator<ns3::Ptr<ns3::Packet> > >::_M_insert<ns3::Ptr<ns3::Packet> const&> (1,174,204 samples, 0.12%)
std::_Rb_tree<ns3::Scheduler::EventKey, std::pair<ns3::Scheduler::EventKey const, ns3::EventImpl*>, std::_Select1st<std::pair<ns3::Scheduler::EventKey const, ns3::EventImpl*> >, std::less<ns3::Scheduler::EventKey>, std::allocator<std::pair<ns3::Scheduler::EventKey const, ns3::EventImpl*> > >::_S_key (206,860 samples, 0.02%)
ns3::tbInfo_t&& std::forward<ns3::tbInfo_t> (124,354 samples, 0.01%)
ns3::MemberLteCcmMacSapUser<ns3::NoOpComponentCarrierManager>::NotifyTxOpportunity (10,219,715 samples, 1.05%)
std::_Tuple_impl<5ul, std::map<unsigned int, ns3::Ptr<ns3::SpectrumValue>, std::less<unsigned int>, std::allocator<std::pair<unsigned int const, ns3::Ptr<ns3::SpectrumValue> > > > >::_Tuple_impl<std::map<unsigned int, ns3::Ptr<ns3::SpectrumValue>, std::less<unsigned int>, std::allocator<std::pair<unsigned int const, ns3::Ptr<ns3::SpectrumValue> > > >&> (236,989 samples, 0.02%)
std::_Rb_tree<unsigned short, std::pair<unsigned short const, ns3::LteEnbComponentCarrierManager::UeInfo>, std::_Select1st<std::pair<unsigned short const, ns3::LteEnbComponentCarrierManager::UeInfo> >, std::less<unsigned short>, std::allocator<std::pair<unsigned short const, ns3::LteEnbComponentCarrierManager::UeInfo> > >::_M_lower_bound (1,154,434 samples, 0.12%)
std::__new_allocator<double>::allocate (150,187 samples, 0.02%)
ns3::UlInfoListElement_s::UlInfoListElement_s (561,715 samples, 0.06%)
std::_Rb_tree<unsigned short, std::pair<unsigned short const, ns3::DlInfoListElement_s>, std::_Select1st<std::pair<unsigned short const, ns3::DlInfoListElement_s> >, std::less<unsigned short>, std::allocator<std::pair<unsigned short const, ns3::DlInfoListElement_s> > >::_M_get_Node_allocator (124,773 samples, 0.01%)
std::function<void (261,746 samples, 0.03%)
std::_Select1st<std::pair<unsigned int const, ns3::TxSpectrumModelInfo> >::operator (350,639 samples, 0.04%)
std::_Rb_tree<unsigned char, std::pair<unsigned char const, ns3::LteMacSapUser*>, std::_Select1st<std::pair<unsigned char const, ns3::LteMacSapUser*> >, std::less<unsigned char>, std::allocator<std::pair<unsigned char const, ns3::LteMacSapUser*> > >::_M_lower_bound (193,840 samples, 0.02%)
std::_Bind<void (869,324 samples, 0.09%)
double const& const& std::__get_helper<2ul, double const&> (303,442 samples, 0.03%)
std::_Rb_tree<ns3::Scheduler::EventKey, std::pair<ns3::Scheduler::EventKey const, ns3::EventImpl*>, std::_Select1st<std::pair<ns3::Scheduler::EventKey const, ns3::EventImpl*> >, std::less<ns3::Scheduler::EventKey>, std::allocator<std::pair<ns3::Scheduler::EventKey const, ns3::EventImpl*> > >::_M_insert_node (220,811 samples, 0.02%)
std::_Rb_tree<unsigned short, std::pair<unsigned short const, std::vector<double, std::allocator<double> > >, std::_Select1st<std::pair<unsigned short const, std::vector<double, std::allocator<double> > > >, std::less<unsigned short>, std::allocator<std::pair<unsigned short const, std::vector<double, std::allocator<double> > > > >::_M_drop_node (193,911 samples, 0.02%)
ns3::SbMeasResult_s::~SbMeasResult_s (493,524 samples, 0.05%)
std::__cxx11::_List_base<ns3::AttributeConstructionList::Item, std::allocator<ns3::AttributeConstructionList::Item> >::_List_base (414,980 samples, 0.04%)
ns3::LteSpectrumPhy*& std::forward<ns3::LteSpectrumPhy*&> (192,441 samples, 0.02%)
void std::_Destroy_aux<false>::__destroy<ns3::BuildDataListElement_s*> (793,632 samples, 0.08%)
ns3::HigherLayerSelected_s* std::__uninitialized_copy<false>::__uninit_copy<__gnu_cxx::__normal_iterator<ns3::HigherLayerSelected_s const*, std::vector<ns3::HigherLayerSelected_s, std::allocator<ns3::HigherLayerSelected_s> > >, ns3::HigherLayerSelected_s*> (213,295 samples, 0.02%)
__gnu_cxx::__normal_iterator<ns3::Ptr<ns3::PacketBurst>*, std::vector<ns3::Ptr<ns3::PacketBurst>, std::allocator<ns3::Ptr<ns3::PacketBurst> > > >::operator+ (151,748 samples, 0.02%)
std::_Rb_tree<unsigned short, std::pair<unsigned short const, ns3::pfsFlowPerf_t>, std::_Select1st<std::pair<unsigned short const, ns3::pfsFlowPerf_t> >, std::less<unsigned short>, std::allocator<std::pair<unsigned short const, ns3::pfsFlowPerf_t> > >::_M_end (156,504 samples, 0.02%)
decltype (1,840,875 samples, 0.19%)
std::__cxx11::list<ns3::Callback<void, ns3::Ptr<ns3::SpectrumSignalParameters> >, std::allocator<ns3::Callback<void, ns3::Ptr<ns3::SpectrumSignalParameters> > > >::begin (158,211 samples, 0.02%)
std::__cxx11::list<ns3::Ptr<ns3::LteControlMessage>, std::allocator<ns3::Ptr<ns3::LteControlMessage> > >::end (160,592 samples, 0.02%)
pow (358,907 samples, 0.04%)
std::_Rb_tree<unsigned short, std::pair<unsigned short const, std::vector<unsigned short, std::allocator<unsigned short> > >, std::_Select1st<std::pair<unsigned short const, std::vector<unsigned short, std::allocator<unsigned short> > > >, std::less<unsigned short>, std::allocator<std::pair<unsigned short const, std::vector<unsigned short, std::allocator<unsigned short> > > > >::lower_bound (431,721 samples, 0.04%)
ns3::Ptr<ns3::NixVector>::Acquire (419,529 samples, 0.04%)
ns3::Ptr<ns3::SpectrumModel const>::~Ptr (312,525 samples, 0.03%)
std::_Vector_base<ns3::DlInfoListElement_s::HarqStatus_e, std::allocator<ns3::DlInfoListElement_s::HarqStatus_e> >::_Vector_base (1,053,971 samples, 0.11%)
std::allocator<std::_List_node<ns3::Ptr<ns3::Packet> > >::allocate (493,183 samples, 0.05%)
double* std::__uninitialized_default_n_1<true>::__uninit_default_n<double*, unsigned long> (158,356 samples, 0.02%)
void std::__fill_a<double*, double> (344,019 samples, 0.04%)
__gnu_cxx::__normal_iterator<double*, std::vector<double, std::allocator<double> > > std::__copy_move_a<false, __gnu_cxx::__normal_iterator<double const*, std::vector<double, std::allocator<double> > >, __gnu_cxx::__normal_iterator<double*, std::vector<double, std::allocator<double> > > > (372,854 samples, 0.04%)
void std::_Destroy_aux<false>::__destroy<std::vector<ns3::RlcPduListElement_s, std::allocator<ns3::RlcPduListElement_s> >*> (160,848 samples, 0.02%)
std::__cxx11::list<ns3::Ptr<ns3::LteControlMessage>, std::allocator<ns3::Ptr<ns3::LteControlMessage> > >::push_back (452,241 samples, 0.05%)
ns3::HarqProcessInfoElement_t* std::uninitialized_copy<__gnu_cxx::__normal_iterator<ns3::HarqProcessInfoElement_t const*, std::vector<ns3::HarqProcessInfoElement_t, std::allocator<ns3::HarqProcessInfoElement_t> > >, ns3::HarqProcessInfoElement_t*> (419,766 samples, 0.04%)
std::vector<ns3::PhichListElement_s, std::allocator<ns3::PhichListElement_s> >::vector (813,912 samples, 0.08%)
std::map<ns3::Scheduler::EventKey, ns3::EventImpl*, std::less<ns3::Scheduler::EventKey>, std::allocator<std::pair<ns3::Scheduler::EventKey const, ns3::EventImpl*> > >::lower_bound (1,848,808 samples, 0.19%)
ns3::operator< (204,834 samples, 0.02%)
ns3::SimpleRefCount<ns3::Object, ns3::ObjectBase, ns3::ObjectDeleter>::SimpleRefCount (573,224 samples, 0.06%)
std::pair<unsigned short const, ns3::DlInfoListElement_s>::pair<unsigned short, ns3::DlInfoListElement_s> (569,357 samples, 0.06%)
__gnu_cxx::__normal_iterator<std::vector<ns3::HarqProcessInfoElement_t, std::allocator<ns3::HarqProcessInfoElement_t> >*, std::vector<std::vector<ns3::HarqProcessInfoElement_t, std::allocator<ns3::HarqProcessInfoElement_t> >, std::allocator<std::vector<ns3::HarqProcessInfoElement_t, std::allocator<ns3::HarqProcessInfoElement_t> > > > >::operator+ (155,822 samples, 0.02%)
std::vector<double, std::allocator<double> >::~vector (408,168 samples, 0.04%)
ns3::PfFfMacScheduler::DoSchedDlTriggerReq (2,983,151 samples, 0.31%)
ns3::LteSpectrumPhy::SetTxPowerSpectralDensity (266,358 samples, 0.03%)
ns3::SbMeasResult_s::~SbMeasResult_s (340,024 samples, 0.04%)
std::map<unsigned short, std::vector<unsigned short, std::allocator<unsigned short> >, std::less<unsigned short>, std::allocator<std::pair<unsigned short const, std::vector<unsigned short, std::allocator<unsigned short> > > > >::map (934,328 samples, 0.10%)
ns3::UniformRandomVariable::GetValue (1,052,360 samples, 0.11%)
std::operator+ (505,904 samples, 0.05%)
ns3::Ptr<ns3::LteUeNetDevice> ns3::Object::GetObject<ns3::LteUeNetDevice> (242,422 samples, 0.02%)
void std::__cxx11::list<ns3::Ptr<ns3::LteControlMessage>, std::allocator<ns3::Ptr<ns3::LteControlMessage> > >::_M_insert<ns3::Ptr<ns3::LteControlMessage> const&> (180,536 samples, 0.02%)
std::map<unsigned int, ns3::Ptr<ns3::SpectrumValue>, std::less<unsigned int>, std::allocator<std::pair<unsigned int const, ns3::Ptr<ns3::SpectrumValue> > > >::~map (934,712 samples, 0.10%)
__libc_start_main (923,730,017 samples, 95.25%) __libc_start_main
ns3::BuildDataListElement_s* std::__relocate_a<ns3::BuildDataListElement_s*, ns3::BuildDataListElement_s*, std::allocator<ns3::BuildDataListElement_s> > (268,184 samples, 0.03%)
std::_Rb_tree<unsigned short, std::pair<unsigned short const, std::vector<unsigned char, std::allocator<unsigned char> > >, std::_Select1st<std::pair<unsigned short const, std::vector<unsigned char, std::allocator<unsigned char> > > >, std::less<unsigned short>, std::allocator<std::pair<unsigned short const, std::vector<unsigned char, std::allocator<unsigned char> > > > >::_M_lower_bound (162,629 samples, 0.02%)
ns3::EnbMacMemberLteEnbPhySapUser::UlInfoListElementHarqFeedback (486,223 samples, 0.05%)
std::vector<ns3::HarqProcessInfoElement_t, std::allocator<ns3::HarqProcessInfoElement_t> >::vector (634,130 samples, 0.07%)
std::_Bind<void (396,468 samples, 0.04%)
ns3::Ptr<ns3::MatrixArray<std::complex<double> > const>::operator= (149,159 samples, 0.02%)
std::_Rb_tree_node<std::pair<unsigned char const, ns3::LteMacSapProvider::ReportBufferStatusParameters> >::_M_valptr (164,987 samples, 0.02%)
std::_Bit_iterator std::__copy_move_a2<false, std::_Bit_const_iterator, std::_Bit_iterator> (267,552 samples, 0.03%)
std::vector<double, std::allocator<double> >::operator= (1,826,902 samples, 0.19%)
std::_Rb_tree<ns3::Scheduler::EventKey, std::pair<ns3::Scheduler::EventKey const, ns3::EventImpl*>, std::_Select1st<std::pair<ns3::Scheduler::EventKey const, ns3::EventImpl*> >, std::less<ns3::Scheduler::EventKey>, std::allocator<std::pair<ns3::Scheduler::EventKey const, ns3::EventImpl*> > >::_M_get_node (493,361 samples, 0.05%)
double& std::forward<double&> (125,210 samples, 0.01%)
std::_List_const_iterator<ns3::Callback<void, ns3::Ptr<ns3::MobilityModel const>, ns3::Ptr<ns3::MobilityModel const>, double, double, double, double> >::_List_const_iterator (158,162 samples, 0.02%)
std::_List_const_iterator<ns3::Ptr<ns3::Packet> >::_List_const_iterator (161,744 samples, 0.02%)
void std::__invoke_impl<void, void (2,105,662 samples, 0.22%)
ns3::operator< (654,418 samples, 0.07%)
std::_Vector_base<ns3::HigherLayerSelected_s, std::allocator<ns3::HigherLayerSelected_s> >::_M_create_storage (160,120 samples, 0.02%)
std::_Rb_tree<ns3::LteSpectrumModelId, std::pair<ns3::LteSpectrumModelId const, ns3::Ptr<ns3::SpectrumModel> >, std::_Select1st<std::pair<ns3::LteSpectrumModelId const, ns3::Ptr<ns3::SpectrumModel> > >, std::less<ns3::LteSpectrumModelId>, std::allocator<std::pair<ns3::LteSpectrumModelId const, ns3::Ptr<ns3::SpectrumModel> > > >::end (125,572 samples, 0.01%)
unsigned char* std::__uninitialized_copy_a<__gnu_cxx::__normal_iterator<unsigned char const*, std::vector<unsigned char, std::allocator<unsigned char> > >, unsigned char*, unsigned char> (500,842 samples, 0.05%)
std::_Rb_tree<unsigned int, std::pair<unsigned int const, ns3::Ptr<ns3::SpectrumValue> >, std::_Select1st<std::pair<unsigned int const, ns3::Ptr<ns3::SpectrumValue> > >, std::less<unsigned int>, std::allocator<std::pair<unsigned int const, ns3::Ptr<ns3::SpectrumValue> > > >::_Auto_node::_M_key (154,486 samples, 0.02%)
std::_Rb_tree<unsigned short, std::pair<unsigned short const, std::vector<std::vector<std::vector<ns3::RlcPduListElement_s, std::allocator<ns3::RlcPduListElement_s> >, std::allocator<std::vector<ns3::RlcPduListElement_s, std::allocator<ns3::RlcPduListElement_s> > > >, std::allocator<std::vector<std::vector<ns3::RlcPduListElement_s, std::allocator<ns3::RlcPduListElement_s> >, std::allocator<std::vector<ns3::RlcPduListElement_s, std::allocator<ns3::RlcPduListElement_s> > > > > > >, std::_Select1st<std::pair<unsigned short const, std::vector<std::vector<std::vector<ns3::RlcPduListElement_s, std::allocator<ns3::RlcPduListElement_s> >, std::allocator<std::vector<ns3::RlcPduListElement_s, std::allocator<ns3::RlcPduListElement_s> > > >, std::allocator<std::vector<std::vector<ns3::RlcPduListElement_s, std::allocator<ns3::RlcPduListElement_s> >, std::allocator<std::vector<ns3::RlcPduListElement_s, std::allocator<ns3::RlcPduListElement_s> > > > > > > >, std::less<unsigned short>, std::allocator<std::pair<unsigned short const, std::vector<std::vector<std::vector<ns3::RlcPduListElement_s, std::allocator<ns3::RlcPduListElement_s> >, std::allocator<std::vector<ns3::RlcPduListElement_s, std::allocator<ns3::RlcPduListElement_s> > > >, std::allocator<std::vector<std::vector<ns3::RlcPduListElement_s, std::allocator<ns3::RlcPduListElement_s> >, std::allocator<std::vector<ns3::RlcPduListElement_s, std::allocator<ns3::RlcPduListElement_s> > > > > > > > >::find (151,942 samples, 0.02%)
ns3::Buffer::Initialize (198,909 samples, 0.02%)
decltype (189,091 samples, 0.02%)
ns3::SpectrumSignalParameters::~SpectrumSignalParameters (150,807 samples, 0.02%)
ns3::ByteTagList::~ByteTagList (286,110 samples, 0.03%)
ns3::Ptr<ns3::SpectrumModel const>::operator= (275,587 samples, 0.03%)
__gnu_cxx::__normal_iterator<int*, std::vector<int, std::allocator<int> > >::operator++ (129,245 samples, 0.01%)
std::set<unsigned short, std::less<unsigned short>, std::allocator<unsigned short> >::find (997,034 samples, 0.10%)
__gnu_cxx::__aligned_membuf<std::pair<unsigned int const, ns3::TxSpectrumModelInfo> >::_M_ptr (221,148 samples, 0.02%)
void std::allocator_traits<std::allocator<std::_Rb_tree_node<std::pair<ns3::Scheduler::EventKey const, ns3::EventImpl*> > > >::construct<std::pair<ns3::Scheduler::EventKey const, ns3::EventImpl*>, std::pair<ns3::Scheduler::EventKey, ns3::EventImpl*> > (558,175 samples, 0.06%)
ns3::ObjectDeleter::Delete (659,540 samples, 0.07%)
std::pair<unsigned short const, std::vector<unsigned short, std::allocator<unsigned short> > >::pair<unsigned short const&, 0ul> (363,578 samples, 0.04%)
std::_Rb_tree<unsigned short, std::pair<unsigned short const, std::vector<std::vector<ns3::Ptr<ns3::PacketBurst>, std::allocator<ns3::Ptr<ns3::PacketBurst> > >, std::allocator<std::vector<ns3::Ptr<ns3::PacketBurst>, std::allocator<ns3::Ptr<ns3::PacketBurst> > > > > >, std::_Select1st<std::pair<unsigned short const, std::vector<std::vector<ns3::Ptr<ns3::PacketBurst>, std::allocator<ns3::Ptr<ns3::PacketBurst> > >, std::allocator<std::vector<ns3::Ptr<ns3::PacketBurst>, std::allocator<ns3::Ptr<ns3::PacketBurst> > > > > > >, std::less<unsigned short>, std::allocator<std::pair<unsigned short const, std::vector<std::vector<ns3::Ptr<ns3::PacketBurst>, std::allocator<ns3::Ptr<ns3::PacketBurst> > >, std::allocator<std::vector<ns3::Ptr<ns3::PacketBurst>, std::allocator<ns3::Ptr<ns3::PacketBurst> > > > > > > >::_M_begin (473,969 samples, 0.05%)
std::__cxx11::list<ns3::Ptr<ns3::Packet>, std::allocator<ns3::Ptr<ns3::Packet> > >::end (304,113 samples, 0.03%)
std::less<ns3::LteSpectrumModelId>::operator (304,181 samples, 0.03%)
ns3::Time::~Time (126,395 samples, 0.01%)
std::vector<ns3::UlDciListElement_s, std::allocator<ns3::UlDciListElement_s> >::push_back (2,043,951 samples, 0.21%)
ns3::Angles::NormalizeAngles (187,861 samples, 0.02%)
std::_Rb_tree<ns3::LteFlowId_t, std::pair<ns3::LteFlowId_t const, ns3::FfMacSchedSapProvider::SchedDlRlcBufferReqParameters>, std::_Select1st<std::pair<ns3::LteFlowId_t const, ns3::FfMacSchedSapProvider::SchedDlRlcBufferReqParameters> >, std::less<ns3::LteFlowId_t>, std::allocator<std::pair<ns3::LteFlowId_t const, ns3::FfMacSchedSapProvider::SchedDlRlcBufferReqParameters> > >::_M_lower_bound (462,671 samples, 0.05%)
malloc (249,753 samples, 0.03%)
ns3::SpectrumValue::Add (189,127 samples, 0.02%)
void std::__invoke_impl<void, ns3::Callback<void, ns3::DlInfoListElement_s>::Callback<void (3,583,306 samples, 0.37%)
std::vector<unsigned int, std::allocator<unsigned int> >::_M_fill_initialize (1,326,838 samples, 0.14%)
__gnu_cxx::__normal_iterator<int*, std::vector<int, std::allocator<int> > > std::__copy_move_a<false, __gnu_cxx::__normal_iterator<int const*, std::vector<int, std::allocator<int> > >, __gnu_cxx::__normal_iterator<int*, std::vector<int, std::allocator<int> > > > (248,988 samples, 0.03%)
std::vector<unsigned short, std::allocator<unsigned short> >::back (194,530 samples, 0.02%)
ns3::DlInfoListElement_s::HarqStatus_e* std::uninitialized_copy<__gnu_cxx::__normal_iterator<ns3::DlInfoListElement_s::HarqStatus_e const*, std::vector<ns3::DlInfoListElement_s::HarqStatus_e, std::allocator<ns3::DlInfoListElement_s::HarqStatus_e> > >, ns3::DlInfoListElement_s::HarqStatus_e*> (147,743 samples, 0.02%)
std::_Function_handler<void (145,405 samples, 0.01%)
std::_Rb_tree<unsigned char, std::pair<unsigned char const, ns3::LteUeMac::LcInfo>, std::_Select1st<std::pair<unsigned char const, ns3::LteUeMac::LcInfo> >, std::less<unsigned char>, std::allocator<std::pair<unsigned char const, ns3::LteUeMac::LcInfo> > >::_M_lower_bound (805,256 samples, 0.08%)
ns3::Object::Construct (2,205,090 samples, 0.23%)
ns3::SpectrumValue::SpectrumValue (3,061,806 samples, 0.32%)
std::_Rb_tree<unsigned short, std::pair<unsigned short const, std::vector<ns3::UlDciListElement_s, std::allocator<ns3::UlDciListElement_s> > >, std::_Select1st<std::pair<unsigned short const, std::vector<ns3::UlDciListElement_s, std::allocator<ns3::UlDciListElement_s> > > >, std::less<unsigned short>, std::allocator<std::pair<unsigned short const, std::vector<ns3::UlDciListElement_s, std::allocator<ns3::UlDciListElement_s> > > > >::_S_key (155,594 samples, 0.02%)
ns3::LteInterference::DoSubtractSignal (20,555,876 samples, 2.12%)
std::_Rb_tree_node<std::pair<ns3::LteFlowId_t const, ns3::FfMacSchedSapProvider::SchedDlRlcBufferReqParameters> >::_M_valptr (158,324 samples, 0.02%)
operator new (152,076 samples, 0.02%)
ns3::SpectrumSignalParameters* ns3::PeekPointer<ns3::SpectrumSignalParameters> (126,810 samples, 0.01%)
std::tuple_element<2ul, std::tuple<double const&, double const&, double const&> >::type const& std::get<2ul, double const&, double const&, double const&> (498,549 samples, 0.05%)
ns3::LteSpectrumPhy::StartRx (40,953,039 samples, 4.22%) ns..
double std::reduce<__gnu_cxx::__normal_iterator<double const*, std::vector<double, std::allocator<double> > >, double, std::plus<void> > (163,427 samples, 0.02%)
std::_Rb_tree<unsigned short, unsigned short, std::_Identity<unsigned short>, std::less<unsigned short>, std::allocator<unsigned short> >::_Rb_tree_impl<std::less<unsigned short>, true>::_Rb_tree_impl (238,331 samples, 0.02%)
__gnu_cxx::__normal_iterator<double*, std::vector<double, std::allocator<double> > > std::copy<__gnu_cxx::__normal_iterator<double const*, std::vector<double, std::allocator<double> > >, __gnu_cxx::__normal_iterator<double*, std::vector<double, std::allocator<double> > > > (372,854 samples, 0.04%)
std::function<void (20,037,682 samples, 2.07%)
std::_Vector_base<ns3::HarqProcessInfoElement_t, std::allocator<ns3::HarqProcessInfoElement_t> >::_Vector_impl_data::_Vector_impl_data (152,701 samples, 0.02%)
ns3::LteSpectrumSignalParametersDataFrame::~LteSpectrumSignalParametersDataFrame (2,628,658 samples, 0.27%)
std::vector<ns3::Ptr<ns3::Object>, std::allocator<ns3::Ptr<ns3::Object> > >::~vector (266,121 samples, 0.03%)
void std::destroy_at<ns3::Ptr<ns3::Packet> > (4,680,368 samples, 0.48%)
__dynamic_cast (254,736 samples, 0.03%)
unsigned int* std::fill_n<unsigned int*, unsigned long, unsigned int> (716,615 samples, 0.07%)
unsigned char* std::fill_n<unsigned char*, unsigned long, unsigned char> (682,457 samples, 0.07%)
std::_List_iterator<ns3::UlDciLteControlMessage>::operator* (176,788 samples, 0.02%)
ns3::Ptr<ns3::MobilityModel const>::Acquire (164,722 samples, 0.02%)
std::_Vector_base<unsigned short, std::allocator<unsigned short> >::_Vector_base (125,979 samples, 0.01%)
std::vector<ns3::VendorSpecificListElement_s, std::allocator<ns3::VendorSpecificListElement_s> >::vector (297,291 samples, 0.03%)
std::vector<unsigned int, std::allocator<unsigned int> >::vector (2,570,731 samples, 0.27%)
std::__cxx11::list<ns3::UlDciLteControlMessage, std::allocator<ns3::UlDciLteControlMessage> >::list (4,322,765 samples, 0.45%)
std::_Vector_base<unsigned char, std::allocator<unsigned char> >::_Vector_impl::_Vector_impl (148,226 samples, 0.02%)
__gnu_cxx::__aligned_membuf<ns3::Ptr<ns3::PacketBurst> >::_M_addr (195,800 samples, 0.02%)
std::__cxx11::_List_base<ns3::Ptr<ns3::Packet>, std::allocator<ns3::Ptr<ns3::Packet> > >::_M_clear (5,410,131 samples, 0.56%)
void ns3::Callback<void, ns3::SpectrumValue const&>::Callback<void (18,776,737 samples, 1.94%)
std::_Function_handler<void (200,664 samples, 0.02%)
void std::_Function_base::_Base_manager<std::_Bind<void (495,402 samples, 0.05%)
ns3::Ptr<ns3::SpectrumValue> ns3::Create<ns3::SpectrumValue, ns3::Ptr<ns3::SpectrumModel const> const&> (997,289 samples, 0.10%)
std::_Function_handler<void (1,211,161 samples, 0.12%)
ns3::MemberLteFfrSapProvider<ns3::LteFrNoOpAlgorithm>::ReportUlCqiInfo (231,712 samples, 0.02%)
__gnu_cxx::__enable_if<std::__is_integer<int>::__value, double>::__type std::sqrt<int> (152,846 samples, 0.02%)
std::_Vector_base<unsigned char, std::allocator<unsigned char> >::_Vector_base (344,519 samples, 0.04%)
std::vector<ns3::HarqProcessInfoElement_t, std::allocator<ns3::HarqProcessInfoElement_t> >* std::__niter_base<std::vector<ns3::HarqProcessInfoElement_t, std::allocator<ns3::HarqProcessInfoElement_t> >*, std::vector<std::vector<ns3::HarqProcessInfoElement_t, std::allocator<ns3::HarqProcessInfoElement_t> >, std::allocator<std::vector<ns3::HarqProcessInfoElement_t, std::allocator<ns3::HarqProcessInfoElement_t> > > > > (393,544 samples, 0.04%)
ns3::SpectrumValue::operator*= (1,505,163 samples, 0.16%)
std::_List_const_iterator<ns3::Callback<void, unsigned short, unsigned char, unsigned int, unsigned long> >::_List_const_iterator (203,852 samples, 0.02%)
ns3::CallbackImpl<void, ns3::UlInfoListElement_s>::operator (2,539,404 samples, 0.26%)
std::_Vector_base<double, std::allocator<double> >::_Vector_base (187,036 samples, 0.02%)
void std::_Function_base::_Base_manager<std::_Bind<void (675,431 samples, 0.07%)
std::operator== (189,080 samples, 0.02%)
std::_Rb_tree<ns3::Scheduler::EventKey, std::pair<ns3::Scheduler::EventKey const, ns3::EventImpl*>, std::_Select1st<std::pair<ns3::Scheduler::EventKey const, ns3::EventImpl*> >, std::less<ns3::Scheduler::EventKey>, std::allocator<std::pair<ns3::Scheduler::EventKey const, ns3::EventImpl*> > >::_M_lower_bound (193,007 samples, 0.02%)
ns3::Ptr<ns3::SpectrumValue>::operator* (277,433 samples, 0.03%)
std::vector<double, std::allocator<double> >::_M_default_initialize (160,457 samples, 0.02%)
std::_Rb_tree_node<std::pair<unsigned int const, ns3::Ptr<ns3::SpectrumValue> > >* std::_Rb_tree<unsigned int, std::pair<unsigned int const, ns3::Ptr<ns3::SpectrumValue> >, std::_Select1st<std::pair<unsigned int const, ns3::Ptr<ns3::SpectrumValue> > >, std::less<unsigned int>, std::allocator<std::pair<unsigned int const, ns3::Ptr<ns3::SpectrumValue> > > >::_M_create_node<std::pair<unsigned int const, ns3::Ptr<ns3::SpectrumValue> > const&> (156,128 samples, 0.02%)
std::__cxx11::list<ns3::UlDciLteControlMessage, std::allocator<ns3::UlDciLteControlMessage> >::~list (234,294 samples, 0.02%)
ns3::LteEnbPhy* ns3::PeekPointer<ns3::LteEnbPhy> (151,158 samples, 0.02%)
std::map<unsigned short, std::vector<unsigned short, std::allocator<unsigned short> >, std::less<unsigned short>, std::allocator<std::pair<unsigned short const, std::vector<unsigned short, std::allocator<unsigned short> > > > >::operator[] (2,456,594 samples, 0.25%)
std::vector<ns3::BuildDataListElement_s, std::allocator<ns3::BuildDataListElement_s> >::max_size (153,400 samples, 0.02%)
std::_Rb_tree<unsigned short, std::pair<unsigned short const, std::vector<double, std::allocator<double> > >, std::_Select1st<std::pair<unsigned short const, std::vector<double, std::allocator<double> > > >, std::less<unsigned short>, std::allocator<std::pair<unsigned short const, std::vector<double, std::allocator<double> > > > >::_Rb_tree (4,812,209 samples, 0.50%)
std::vector<bool, std::allocator<bool> >::resize (149,910 samples, 0.02%)
std::function<void (3,263,000 samples, 0.34%)
ns3::HigherLayerSelected_s* std::__uninitialized_copy_a<__gnu_cxx::__normal_iterator<ns3::HigherLayerSelected_s const*, std::vector<ns3::HigherLayerSelected_s, std::allocator<ns3::HigherLayerSelected_s> > >, ns3::HigherLayerSelected_s*, ns3::HigherLayerSelected_s> (860,392 samples, 0.09%)
std::_Tuple_impl<0ul, ns3::LteSpectrumPhy*>::_Tuple_impl<ns3::LteSpectrumPhy*&> (205,546 samples, 0.02%)
std::allocator_traits<std::allocator<int> >::allocate (177,537 samples, 0.02%)
std::allocator_traits<std::allocator<std::_Rb_tree_node<std::pair<ns3::Scheduler::EventKey const, ns3::EventImpl*> > > >::allocate (195,540 samples, 0.02%)
ns3::LtePhy::GetControlMessages[abi:cxx11] (517,990 samples, 0.05%)
ns3::int64x64_t::int64x64_t (1,365,624 samples, 0.14%)
std::map<ns3::LteSpectrumModelId, ns3::Ptr<ns3::SpectrumModel>, std::less<ns3::LteSpectrumModelId>, std::allocator<std::pair<ns3::LteSpectrumModelId const, ns3::Ptr<ns3::SpectrumModel> > > >::find (220,015 samples, 0.02%)
ns3::LteRlcSm::ReportBufferStatus (1,286,769 samples, 0.13%)
std::__cxx11::_List_base<ns3::UlDciLteControlMessage, std::allocator<ns3::UlDciLteControlMessage> >::_M_clear (433,351 samples, 0.04%)
std::_Tuple_impl<0ul, ns3::LteEnbPhy*, ns3::Ptr<ns3::PacketBurst> >::_M_head (204,180 samples, 0.02%)
std::_Function_handler<void (34,696,291 samples, 3.58%) s..
__gnu_cxx::__aligned_membuf<std::pair<unsigned short const, std::vector<std::vector<ns3::Ptr<ns3::PacketBurst>, std::allocator<ns3::Ptr<ns3::PacketBurst> > >, std::allocator<std::vector<ns3::Ptr<ns3::PacketBurst>, std::allocator<ns3::Ptr<ns3::PacketBurst> > > > > > >::_M_ptr (200,206 samples, 0.02%)
ns3::FfMacSchedSapUser::SchedDlConfigIndParameters::SchedDlConfigIndParameters (5,344,608 samples, 0.55%)
ns3::Ptr<ns3::MobilityModel const>::Ptr<ns3::MobilityModel> (387,700 samples, 0.04%)
std::_Rb_tree_node<std::pair<unsigned short const, ns3::DlInfoListElement_s> >::_M_valptr (157,233 samples, 0.02%)
std::__cxx11::list<ns3::Ptr<ns3::Packet>, std::allocator<ns3::Ptr<ns3::Packet> > >::end (241,920 samples, 0.02%)
ns3::MemberLteCcmMacSapUser<ns3::NoOpComponentCarrierManager>::NotifyTxOpportunity (1,376,216 samples, 0.14%)
ns3::TypeId::~TypeId (294,683 samples, 0.03%)
ns3::LteRadioBearerTag::GetTypeId (197,030 samples, 0.02%)
std::_Vector_base<unsigned char, std::allocator<unsigned char> >::_Vector_base (183,612 samples, 0.02%)
__cxxabiv1::__si_class_type_info::__do_dyncast (350,826 samples, 0.04%)
ns3::SpectrumValue::~SpectrumValue (202,197 samples, 0.02%)
ns3::Ptr<ns3::Packet>::~Ptr (146,523 samples, 0.02%)
ns3::Ptr<ns3::SpectrumSignalParameters>& std::__get_helper<3ul, ns3::Ptr<ns3::SpectrumSignalParameters>, ns3::Ptr<ns3::SpectrumPhy>, std::map<unsigned int, ns3::Ptr<ns3::SpectrumValue>, std::less<unsigned int>, std::allocator<std::pair<unsigned int const, ns3::Ptr<ns3::SpectrumValue> > > > > (236,255 samples, 0.02%)
void std::__invoke_impl<void, std::_Bind<void (2,105,662 samples, 0.22%)
ns3::LteEnbPhy::SetDownlinkSubChannels (9,637,583 samples, 0.99%)
std::less<unsigned short>::operator (223,783 samples, 0.02%)
ns3::Ptr<ns3::LteUePhy>::Ptr (764,206 samples, 0.08%)
std::_Rb_tree_node<std::pair<unsigned int const, ns3::Ptr<ns3::SpectrumValue> > >* std::_Rb_tree<unsigned int, std::pair<unsigned int const, ns3::Ptr<ns3::SpectrumValue> >, std::_Select1st<std::pair<unsigned int const, ns3::Ptr<ns3::SpectrumValue> > >, std::less<unsigned int>, std::allocator<std::pair<unsigned int const, ns3::Ptr<ns3::SpectrumValue> > > >::_M_create_node<unsigned int const&, ns3::Ptr<ns3::SpectrumValue>&> (669,703 samples, 0.07%)
std::_Rb_tree<ns3::Scheduler::EventKey, std::pair<ns3::Scheduler::EventKey const, ns3::EventImpl*>, std::_Select1st<std::pair<ns3::Scheduler::EventKey const, ns3::EventImpl*> >, std::less<ns3::Scheduler::EventKey>, std::allocator<std::pair<ns3::Scheduler::EventKey const, ns3::EventImpl*> > >::_Auto_node::_Auto_node<std::pair<ns3::Scheduler::EventKey, ns3::EventImpl*> > (940,707 samples, 0.10%)
ns3::LteSpectrumValueHelper::CreateUlTxPowerSpectralDensity (5,829,900 samples, 0.60%)
ns3::IidManager::GetParent (309,404 samples, 0.03%)
std::_Rb_tree<unsigned int, std::pair<unsigned int const, ns3::Ptr<ns3::SpectrumValue> >, std::_Select1st<std::pair<unsigned int const, ns3::Ptr<ns3::SpectrumValue> > >, std::less<unsigned int>, std::allocator<std::pair<unsigned int const, ns3::Ptr<ns3::SpectrumValue> > > >::lower_bound (308,342 samples, 0.03%)
std::vector<double, std::allocator<double> >::_S_check_init_len (269,236 samples, 0.03%)
ns3::Time::GetSeconds (2,106,405 samples, 0.22%)
std::vector<int, std::allocator<int> >::back (308,674 samples, 0.03%)
ns3::Ptr<ns3::PacketBurst>::Ptr (242,157 samples, 0.02%)
std::vector<std::__cxx11::list<ns3::Ptr<ns3::LteControlMessage>, std::allocator<ns3::Ptr<ns3::LteControlMessage> > >, std::allocator<std::__cxx11::list<ns3::Ptr<ns3::LteControlMessage>, std::allocator<ns3::Ptr<ns3::LteControlMessage> > > > >::at (160,105 samples, 0.02%)
ns3::RarLteControlMessage::RarLteControlMessage (154,430 samples, 0.02%)
std::_Vector_base<double, std::allocator<double> >::~_Vector_base (201,377 samples, 0.02%)
ns3::Ptr<ns3::Node>::Ptr (264,636 samples, 0.03%)
std::__cxx11::_List_base<ns3::Ptr<ns3::Packet>, std::allocator<ns3::Ptr<ns3::Packet> > >::_M_clear (1,273,753 samples, 0.13%)
std::vector<int, std::allocator<int> >::operator= (396,148 samples, 0.04%)
ns3::EnbMemberLteEnbPhySapProvider::SendLteControlMessage (3,042,329 samples, 0.31%)
std::_Function_handler<void (324,769 samples, 0.03%)
ns3::Object::Check (206,111 samples, 0.02%)
std::_Rb_tree<unsigned short, std::pair<unsigned short const, std::vector<unsigned short, std::allocator<unsigned short> > >, std::_Select1st<std::pair<unsigned short const, std::vector<unsigned short, std::allocator<unsigned short> > > >, std::less<unsigned short>, std::allocator<std::pair<unsigned short const, std::vector<unsigned short, std::allocator<unsigned short> > > > >::_M_get_insert_unique_pos (159,018 samples, 0.02%)
ns3::PacketBurst::~PacketBurst (1,161,332 samples, 0.12%)
std::vector<int, std::allocator<int> >::end (181,482 samples, 0.02%)
std::_Function_base::_Base_manager<ns3::Callback<void, ns3::Ptr<ns3::Packet> >::Callback<void (426,263 samples, 0.04%)
unsigned short* std::__uninitialized_copy_a<std::move_iterator<unsigned short*>, unsigned short*, unsigned short> (728,775 samples, 0.08%)
ns3::PacketBurst::~PacketBurst (1,475,273 samples, 0.15%)
ns3::DefaultDeleter<ns3::SpectrumValue>::Delete (235,829 samples, 0.02%)
void std::allocator_traits<std::allocator<ns3::FfMacSchedSapProvider::SchedUlCqiInfoReqParameters> >::construct<ns3::FfMacSchedSapProvider::SchedUlCqiInfoReqParameters, ns3::FfMacSchedSapProvider::SchedUlCqiInfoReqParameters const&> (480,241 samples, 0.05%)
std::_Rb_tree<ns3::Scheduler::EventKey, std::pair<ns3::Scheduler::EventKey const, ns3::EventImpl*>, std::_Select1st<std::pair<ns3::Scheduler::EventKey const, ns3::EventImpl*> >, std::less<ns3::Scheduler::EventKey>, std::allocator<std::pair<ns3::Scheduler::EventKey const, ns3::EventImpl*> > >::lower_bound (2,631,944 samples, 0.27%)
int const& std::min<int> (162,428 samples, 0.02%)
std::_Rb_tree<ns3::Scheduler::EventKey, std::pair<ns3::Scheduler::EventKey const, ns3::EventImpl*>, std::_Select1st<std::pair<ns3::Scheduler::EventKey const, ns3::EventImpl*> >, std::less<ns3::Scheduler::EventKey>, std::allocator<std::pair<ns3::Scheduler::EventKey const, ns3::EventImpl*> > >::_S_key (573,784 samples, 0.06%)
ns3::Now (284,192 samples, 0.03%)
std::_Bind<void (889,944 samples, 0.09%)
std::_Rb_tree_iterator<std::pair<int const, double> > std::_Rb_tree<int, std::pair<int const, double>, std::_Select1st<std::pair<int const, double> >, std::less<int>, std::allocator<std::pair<int const, double> > >::_M_emplace_hint_unique<std::pair<int, double> > (385,367 samples, 0.04%)
std::map<unsigned short, std::vector<unsigned char, std::allocator<unsigned char> >, std::less<unsigned short>, std::allocator<std::pair<unsigned short const, std::vector<unsigned char, std::allocator<unsigned char> > > > >::find (277,435 samples, 0.03%)
ns3::Ptr<ns3::AntennaModel>::Acquire (338,066 samples, 0.03%)
cfree (157,707 samples, 0.02%)
void std::_Rb_tree<unsigned short, std::pair<unsigned short const, std::vector<unsigned short, std::allocator<unsigned short> > >, std::_Select1st<std::pair<unsigned short const, std::vector<unsigned short, std::allocator<unsigned short> > > >, std::less<unsigned short>, std::allocator<std::pair<unsigned short const, std::vector<unsigned short, std::allocator<unsigned short> > > > >::_M_construct_node<std::piecewise_construct_t const&, std::tuple<unsigned short const&>, std::tuple<> > (1,034,007 samples, 0.11%)
ns3::int64x64_t::int64x64_t (150,413 samples, 0.02%)
std::operator== (196,279 samples, 0.02%)
void std::_Destroy<unsigned char*, unsigned char> (220,248 samples, 0.02%)
std::vector<int, std::allocator<int> >::_M_check_len (170,871 samples, 0.02%)
std::_Rb_tree<ns3::TbId_t, std::pair<ns3::TbId_t const, ns3::tbInfo_t>, std::_Select1st<std::pair<ns3::TbId_t const, ns3::tbInfo_t> >, std::less<ns3::TbId_t>, std::allocator<std::pair<ns3::TbId_t const, ns3::tbInfo_t> > >::find (1,490,594 samples, 0.15%)
std::__cxx11::list<ns3::Ptr<ns3::LteControlMessage>, std::allocator<ns3::Ptr<ns3::LteControlMessage> > >* std::__copy_move<true, false, std::random_access_iterator_tag>::__copy_m<std::__cxx11::list<ns3::Ptr<ns3::LteControlMessage>, std::allocator<ns3::Ptr<ns3::LteControlMessage> > >*, std::__cxx11::list<ns3::Ptr<ns3::LteControlMessage>, std::allocator<ns3::Ptr<ns3::LteControlMessage> > >*> (603,213 samples, 0.06%)
ns3::Time::GetTimeStep (222,929 samples, 0.02%)
unsigned int& std::__get_helper<2ul, unsigned int> (546,981 samples, 0.06%)
std::_Bit_const_iterator::_M_const_cast (177,400 samples, 0.02%)
std::_Rb_tree<unsigned short, std::pair<unsigned short const, std::vector<std::vector<ns3::Ptr<ns3::PacketBurst>, std::allocator<ns3::Ptr<ns3::PacketBurst> > >, std::allocator<std::vector<ns3::Ptr<ns3::PacketBurst>, std::allocator<ns3::Ptr<ns3::PacketBurst> > > > > >, std::_Select1st<std::pair<unsigned short const, std::vector<std::vector<ns3::Ptr<ns3::PacketBurst>, std::allocator<ns3::Ptr<ns3::PacketBurst> > >, std::allocator<std::vector<ns3::Ptr<ns3::PacketBurst>, std::allocator<ns3::Ptr<ns3::PacketBurst> > > > > > >, std::less<unsigned short>, std::allocator<std::pair<unsigned short const, std::vector<std::vector<ns3::Ptr<ns3::PacketBurst>, std::allocator<ns3::Ptr<ns3::PacketBurst> > >, std::allocator<std::vector<ns3::Ptr<ns3::PacketBurst>, std::allocator<ns3::Ptr<ns3::PacketBurst> > > > > > > >::_S_key (463,094 samples, 0.05%)
std::__cxx11::list<ns3::Callback<void, ns3::Ptr<ns3::PacketBurst const> >, std::allocator<ns3::Callback<void, ns3::Ptr<ns3::PacketBurst const> > > >::begin (162,620 samples, 0.02%)
std::pair<unsigned short const, std::vector<double, std::allocator<double> > >::~pair (198,551 samples, 0.02%)
std::vector<int, std::allocator<int> >::back (166,101 samples, 0.02%)
std::less<unsigned short>::operator (282,929 samples, 0.03%)
std::vector<ns3::HigherLayerSelected_s, std::allocator<ns3::HigherLayerSelected_s> >::vector (154,721 samples, 0.02%)
std::_Rb_tree_iterator<std::pair<ns3::TbId_t const, ns3::tbInfo_t> > std::map<ns3::TbId_t, ns3::tbInfo_t, std::less<ns3::TbId_t>, std::allocator<std::pair<ns3::TbId_t const, ns3::tbInfo_t> > >::emplace_hint<std::pair<ns3::TbId_t, ns3::tbInfo_t> > (2,992,854 samples, 0.31%)
ns3::SpectrumSignalParameters::SpectrumSignalParameters (580,700 samples, 0.06%)
ns3::ObjectDeleter::Delete (1,607,547 samples, 0.17%)
std::vector<ns3::VendorSpecificListElement_s, std::allocator<ns3::VendorSpecificListElement_s> >::vector (1,506,714 samples, 0.16%)
ns3::LteEnbMac::DoSubframeIndication (19,358,790 samples, 2.00%)
malloc (197,254 samples, 0.02%)
ns3::EnbMacMemberLteMacSapProvider<ns3::NoOpComponentCarrierManager>::ReportBufferStatus (747,299 samples, 0.08%)
operator new (372,038 samples, 0.04%)
std::vector<ns3::HarqProcessInfoElement_t, std::allocator<ns3::HarqProcessInfoElement_t> >::empty (324,331 samples, 0.03%)
__gnu_cxx::__normal_iterator<std::__cxx11::list<ns3::Ptr<ns3::LteControlMessage>, std::allocator<ns3::Ptr<ns3::LteControlMessage> > >*, std::vector<std::__cxx11::list<ns3::Ptr<ns3::LteControlMessage>, std::allocator<ns3::Ptr<ns3::LteControlMessage> > >, std::allocator<std::__cxx11::list<ns3::Ptr<ns3::LteControlMessage>, std::allocator<ns3::Ptr<ns3::LteControlMessage> > > > > > std::__copy_move_a<true, __gnu_cxx::__normal_iterator<std::__cxx11::list<ns3::Ptr<ns3::LteControlMessage>, std::allocator<ns3::Ptr<ns3::LteControlMessage> > >*, std::vector<std::__cxx11::list<ns3::Ptr<ns3::LteControlMessage>, std::allocator<ns3::Ptr<ns3::LteControlMessage> > >, std::allocator<std::__cxx11::list<ns3::Ptr<ns3::LteControlMessage>, std::allocator<ns3::Ptr<ns3::LteControlMessage> > > > > >, __gnu_cxx::__normal_iterator<std::__cxx11::list<ns3::Ptr<ns3::LteControlMessage>, std::allocator<ns3::Ptr<ns3::LteControlMessage> > >*, std::vector<std::__cxx11::list<ns3::Ptr<ns3::LteControlMessage>, std::allocator<ns3::Ptr<ns3::LteControlMessage> > >, std::allocator<std::__cxx11::list<ns3::Ptr<ns3::LteControlMessage>, std::allocator<ns3::Ptr<ns3::LteControlMessage> > > > > > > (1,076,159 samples, 0.11%)
bool __gnu_cxx::operator==<ns3::DlInfoListElement_s*, std::vector<ns3::DlInfoListElement_s, std::allocator<ns3::DlInfoListElement_s> > > (230,973 samples, 0.02%)
std::_Rb_tree<unsigned short, std::pair<unsigned short const, ns3::pfsFlowPerf_t>, std::_Select1st<std::pair<unsigned short const, ns3::pfsFlowPerf_t> >, std::less<unsigned short>, std::allocator<std::pair<unsigned short const, ns3::pfsFlowPerf_t> > >::_M_lower_bound (464,204 samples, 0.05%)
ns3::DlInfoListElement_s::HarqStatus_e* std::__uninitialized_copy<true>::__uninit_copy<std::move_iterator<ns3::DlInfoListElement_s::HarqStatus_e*>, ns3::DlInfoListElement_s::HarqStatus_e*> (347,263 samples, 0.04%)
std::_Rb_tree<unsigned char, std::pair<unsigned char const, ns3::LteMacSapUser*>, std::_Select1st<std::pair<unsigned char const, ns3::LteMacSapUser*> >, std::less<unsigned char>, std::allocator<std::pair<unsigned char const, ns3::LteMacSapUser*> > >::_S_key (208,515 samples, 0.02%)
__gnu_cxx::__normal_iterator<std::vector<ns3::HarqProcessInfoElement_t, std::allocator<ns3::HarqProcessInfoElement_t> >*, std::vector<std::vector<ns3::HarqProcessInfoElement_t, std::allocator<ns3::HarqProcessInfoElement_t> >, std::allocator<std::vector<ns3::HarqProcessInfoElement_t, std::allocator<ns3::HarqProcessInfoElement_t> > > > > std::move<__gnu_cxx::__normal_iterator<std::vector<ns3::HarqProcessInfoElement_t, std::allocator<ns3::HarqProcessInfoElement_t> >*, std::vector<std::vector<ns3::HarqProcessInfoElement_t, std::allocator<ns3::HarqProcessInfoElement_t> >, std::allocator<std::vector<ns3::HarqProcessInfoElement_t, std::allocator<ns3::HarqProcessInfoElement_t> > > > >, __gnu_cxx::__normal_iterator<std::vector<ns3::HarqProcessInfoElement_t, std::allocator<ns3::HarqProcessInfoElement_t> >*, std::vector<std::vector<ns3::HarqProcessInfoElement_t, std::allocator<ns3::HarqProcessInfoElement_t> >, std::allocator<std::vector<ns3::HarqProcessInfoElement_t, std::allocator<ns3::HarqProcessInfoElement_t> > > > > > (3,099,663 samples, 0.32%)
ns3::FfMacSchedSapProvider::SchedDlCqiInfoReqParameters::SchedDlCqiInfoReqParameters (527,752 samples, 0.05%)
std::vector<unsigned short, std::allocator<unsigned short> >::max_size (189,176 samples, 0.02%)
std::_Rb_tree<unsigned short, std::pair<unsigned short const, std::map<unsigned char, ns3::LteMacSapUser*, std::less<unsigned char>, std::allocator<std::pair<unsigned char const, ns3::LteMacSapUser*> > > >, std::_Select1st<std::pair<unsigned short const, std::map<unsigned char, ns3::LteMacSapUser*, std::less<unsigned char>, std::allocator<std::pair<unsigned char const, ns3::LteMacSapUser*> > > > >, std::less<unsigned short>, std::allocator<std::pair<unsigned short const, std::map<unsigned char, ns3::LteMacSapUser*, std::less<unsigned char>, std::allocator<std::pair<unsigned char const, ns3::LteMacSapUser*> > > > > >::_M_lower_bound (925,594 samples, 0.10%)
ns3::LteUePhy::ReceivePss (833,626 samples, 0.09%)
std::__cxx11::_List_base<ns3::Ptr<ns3::Packet>, std::allocator<ns3::Ptr<ns3::Packet> > >::_M_clear (3,222,559 samples, 0.33%)
ns3::Ptr<ns3::MobilityModel>::operator (237,842 samples, 0.02%)
std::_Rb_tree<ns3::Scheduler::EventKey, std::pair<ns3::Scheduler::EventKey const, ns3::EventImpl*>, std::_Select1st<std::pair<ns3::Scheduler::EventKey const, ns3::EventImpl*> >, std::less<ns3::Scheduler::EventKey>, std::allocator<std::pair<ns3::Scheduler::EventKey const, ns3::EventImpl*> > >::_M_lower_bound (1,279,264 samples, 0.13%)
std::allocator<ns3::RlcPduListElement_s>::allocate (190,161 samples, 0.02%)
ns3::LteChunkProcessor::Start (1,058,141 samples, 0.11%)
void std::allocator_traits<std::allocator<std::__cxx11::list<ns3::Ptr<ns3::LteControlMessage>, std::allocator<ns3::Ptr<ns3::LteControlMessage> > > > >::construct<std::__cxx11::list<ns3::Ptr<ns3::LteControlMessage>, std::allocator<ns3::Ptr<ns3::LteControlMessage> > >, std::__cxx11::list<ns3::Ptr<ns3::LteControlMessage>, std::allocator<ns3::Ptr<ns3::LteControlMessage> > > const&> (406,463 samples, 0.04%)
ns3::Angles::Angles (1,131,340 samples, 0.12%)
ns3::Ptr<ns3::LteSpectrumPhy>::operator* (166,039 samples, 0.02%)
std::_Rb_tree<ns3::Scheduler::EventKey, std::pair<ns3::Scheduler::EventKey const, ns3::EventImpl*>, std::_Select1st<std::pair<ns3::Scheduler::EventKey const, ns3::EventImpl*> >, std::less<ns3::Scheduler::EventKey>, std::allocator<std::pair<ns3::Scheduler::EventKey const, ns3::EventImpl*> > >::lower_bound (152,705 samples, 0.02%)
std::_Vector_base<unsigned char, std::allocator<unsigned char> >::_Vector_impl::_Vector_impl (212,001 samples, 0.02%)
std::vector<ns3::HarqProcessInfoElement_t, std::allocator<ns3::HarqProcessInfoElement_t> >::vector (2,102,576 samples, 0.22%)
std::__cxx11::list<ns3::Ptr<ns3::LteControlMessage>, std::allocator<ns3::Ptr<ns3::LteControlMessage> > >::push_back (691,803 samples, 0.07%)
ns3::LteEnbPhy::StartFrame (38,351,386 samples, 3.95%) ns..
ns3::SimpleUeComponentCarrierManager::DoTransmitPdu (7,667,549 samples, 0.79%)
std::_Head_base<2ul, unsigned int, false>::_Head_base<unsigned int&> (281,440 samples, 0.03%)
std::_Rb_tree<ns3::TbId_t, std::pair<ns3::TbId_t const, ns3::tbInfo_t>, std::_Select1st<std::pair<ns3::TbId_t const, ns3::tbInfo_t> >, std::less<ns3::TbId_t>, std::allocator<std::pair<ns3::TbId_t const, ns3::tbInfo_t> > >::_Auto_node::_M_key (372,232 samples, 0.04%)
ns3::Object::GetInstanceTypeId (156,330 samples, 0.02%)
ns3::CqiListElement_s::~CqiListElement_s (894,967 samples, 0.09%)
ns3::MakeEvent<void (2,105,662 samples, 0.22%)
std::_Bvector_base<std::allocator<bool> >::_M_move_data (305,258 samples, 0.03%)
std::_Function_base::_Base_manager<std::_Bind<void (145,405 samples, 0.01%)
cfree (124,394 samples, 0.01%)
std::_Rb_tree_node<std::pair<unsigned short const, std::vector<ns3::DlDciListElement_s, std::allocator<ns3::DlDciListElement_s> > > >::_M_valptr (232,350 samples, 0.02%)
void std::_Destroy_aux<false>::__destroy<ns3::CqiListElement_s*> (933,761 samples, 0.10%)
std::_Rb_tree<unsigned int, std::pair<unsigned int const, ns3::TxSpectrumModelInfo>, std::_Select1st<std::pair<unsigned int const, ns3::TxSpectrumModelInfo> >, std::less<unsigned int>, std::allocator<std::pair<unsigned int const, ns3::TxSpectrumModelInfo> > >::_M_begin (244,771 samples, 0.03%)
std::__cxx11::_List_base<ns3::Ptr<ns3::LteControlMessage>, std::allocator<ns3::Ptr<ns3::LteControlMessage> > >::_M_clear (569,510 samples, 0.06%)
ns3::Ptr<ns3::NixVector>::Acquire (169,425 samples, 0.02%)
std::vector<std::__cxx11::list<ns3::Ptr<ns3::LteControlMessage>, std::allocator<ns3::Ptr<ns3::LteControlMessage> > >, std::allocator<std::__cxx11::list<ns3::Ptr<ns3::LteControlMessage>, std::allocator<ns3::Ptr<ns3::LteControlMessage> > > > >::erase (2,631,164 samples, 0.27%)
std::map<unsigned short, std::vector<unsigned short, std::allocator<unsigned short> >, std::less<unsigned short>, std::allocator<std::pair<unsigned short const, std::vector<unsigned short, std::allocator<unsigned short> > > > >::lower_bound (431,721 samples, 0.04%)
ns3::Ptr<ns3::DlDciLteControlMessage> ns3::DynamicCast<ns3::DlDciLteControlMessage, ns3::LteControlMessage> (458,846 samples, 0.05%)
std::vector<std::__cxx11::list<ns3::Ptr<ns3::LteControlMessage>, std::allocator<ns3::Ptr<ns3::LteControlMessage> > >, std::allocator<std::__cxx11::list<ns3::Ptr<ns3::LteControlMessage>, std::allocator<ns3::Ptr<ns3::LteControlMessage> > > > >::cbegin (469,030 samples, 0.05%)
ns3::SbMeasResult_s::SbMeasResult_s (365,319 samples, 0.04%)
ns3::TypeId::TypeId (165,840 samples, 0.02%)
std::vector<double, std::allocator<double> >::end (139,584 samples, 0.01%)
void ns3::Callback<void, ns3::Ptr<ns3::Packet> >::Callback<void (20,138,435 samples, 2.08%)
ns3::EnbMemberLteEnbPhySapProvider::SendLteControlMessage (498,633 samples, 0.05%)
void std::__invoke_impl<void, ns3::Callback<void, ns3::Ptr<ns3::Packet> >::Callback<void (20,180,449 samples, 2.08%)
std::__cxx11::list<ns3::Ptr<ns3::PacketBurst>, std::allocator<ns3::Ptr<ns3::PacketBurst> > >::clear (2,445,979 samples, 0.25%)
void std::__cxx11::list<ns3::Ptr<ns3::LteControlMessage>, std::allocator<ns3::Ptr<ns3::LteControlMessage> > >::_M_insert<ns3::Ptr<ns3::LteControlMessage> const&> (530,447 samples, 0.05%)
unsigned short* std::uninitialized_copy<std::move_iterator<unsigned short*>, unsigned short*> (728,775 samples, 0.08%)
std::_Rb_tree<ns3::TbId_t, std::pair<ns3::TbId_t const, ns3::tbInfo_t>, std::_Select1st<std::pair<ns3::TbId_t const, ns3::tbInfo_t> >, std::less<ns3::TbId_t>, std::allocator<std::pair<ns3::TbId_t const, ns3::tbInfo_t> > >::_Auto_node::_Auto_node<std::pair<ns3::TbId_t, ns3::tbInfo_t> > (1,620,533 samples, 0.17%)
ns3::LogComponent::IsEnabled (206,491 samples, 0.02%)
std::map<unsigned short, ns3::LteEnbComponentCarrierManager::UeInfo, std::less<unsigned short>, std::allocator<std::pair<unsigned short const, ns3::LteEnbComponentCarrierManager::UeInfo> > >::at (1,778,082 samples, 0.18%)
std::map<unsigned int, ns3::TxSpectrumModelInfo, std::less<unsigned int>, std::allocator<std::pair<unsigned int const, ns3::TxSpectrumModelInfo> > >::find (1,213,331 samples, 0.13%)
std::_Rb_tree_iterator<std::pair<unsigned short const, ns3::DlInfoListElement_s> > std::_Rb_tree<unsigned short, std::pair<unsigned short const, ns3::DlInfoListElement_s>, std::_Select1st<std::pair<unsigned short const, ns3::DlInfoListElement_s> >, std::less<unsigned short>, std::allocator<std::pair<unsigned short const, ns3::DlInfoListElement_s> > >::_M_emplace_hint_unique<std::pair<unsigned short, ns3::DlInfoListElement_s> > (2,130,125 samples, 0.22%)
ns3::SimpleRefCount<ns3::SpectrumValue, ns3::Empty, ns3::DefaultDeleter<ns3::SpectrumValue> >::Unref (227,190 samples, 0.02%)
ns3::Ptr<ns3::PropagationLossModel>::operator bool (286,148 samples, 0.03%)
std::vector<ns3::HigherLayerSelected_s, std::allocator<ns3::HigherLayerSelected_s> >::operator= (324,739 samples, 0.03%)
std::_Bvector_base<std::allocator<bool> >::_M_allocate (148,686 samples, 0.02%)
__dynamic_cast (724,942 samples, 0.07%)
ns3::RlcPduListElement_s* std::__relocate_a_1<ns3::RlcPduListElement_s*, ns3::RlcPduListElement_s*, std::allocator<ns3::RlcPduListElement_s> > (159,106 samples, 0.02%)
ns3::Ptr<ns3::LteSpectrumSignalParametersDataFrame> ns3::Create<ns3::LteSpectrumSignalParametersDataFrame> (1,120,807 samples, 0.12%)
ns3::EventImpl::EventImpl (155,310 samples, 0.02%)
ns3::MacCeListElement_s* std::__do_uninit_copy<std::move_iterator<ns3::MacCeListElement_s*>, ns3::MacCeListElement_s*> (193,178 samples, 0.02%)
void std::_Function_base::_Base_manager<std::_Bind<void (574,266 samples, 0.06%)
ns3::Ptr<ns3::SpectrumPhy>::operator= (154,933 samples, 0.02%)
std::__cxx11::_List_base<ns3::Ptr<ns3::LteControlMessage>, std::allocator<ns3::Ptr<ns3::LteControlMessage> > >::_M_clear (263,603 samples, 0.03%)
ns3::SpectrumValue::operator= (980,052 samples, 0.10%)
ns3::operator* (125,769 samples, 0.01%)
ns3::SimpleRefCount<ns3::Object, ns3::ObjectBase, ns3::ObjectDeleter>::Unref (1,713,044 samples, 0.18%)
ns3::SimpleRefCount<ns3::SpectrumValue, ns3::Empty, ns3::DefaultDeleter<ns3::SpectrumValue> >::Unref (127,422 samples, 0.01%)
ns3::operator*= (321,020 samples, 0.03%)
std::_Rb_tree_node<std::pair<unsigned short const, double> >::_M_valptr (275,175 samples, 0.03%)
ns3::FfMacSchedSapUser::SchedUlConfigIndParameters::~SchedUlConfigIndParameters (876,854 samples, 0.09%)
std::_Select1st<std::pair<unsigned short const, std::vector<std::vector<std::vector<ns3::RlcPduListElement_s, std::allocator<ns3::RlcPduListElement_s> >, std::allocator<std::vector<ns3::RlcPduListElement_s, std::allocator<ns3::RlcPduListElement_s> > > >, std::allocator<std::vector<std::vector<ns3::RlcPduListElement_s, std::allocator<ns3::RlcPduListElement_s> >, std::allocator<std::vector<ns3::RlcPduListElement_s, std::allocator<ns3::RlcPduListElement_s> > > > > > > >::operator (188,098 samples, 0.02%)
double* std::__uninitialized_default_n_1<true>::__uninit_default_n<double*, unsigned long> (322,925 samples, 0.03%)
ns3::PacketMetadata::Allocate (678,878 samples, 0.07%)
std::allocator<std::_Rb_tree_node<std::pair<unsigned int const, ns3::Ptr<ns3::SpectrumValue> > > >::allocate (126,498 samples, 0.01%)
void std::allocator_traits<std::allocator<std::_List_node<ns3::Ptr<ns3::PacketBurst> > > >::construct<ns3::Ptr<ns3::PacketBurst>, ns3::Ptr<ns3::PacketBurst> const&> (389,168 samples, 0.04%)
std::vector<signed char, std::allocator<signed char> >::_M_range_check (245,588 samples, 0.03%)
std::_Rb_tree_iterator<std::pair<ns3::Scheduler::EventKey const, ns3::EventImpl*> >::_Rb_tree_iterator (629,732 samples, 0.06%)
double* std::__uninitialized_default_n<double*, unsigned long> (605,341 samples, 0.06%)
std::__cxx11::list<ns3::Ptr<ns3::LteControlMessage>, std::allocator<ns3::Ptr<ns3::LteControlMessage> > >::end (153,672 samples, 0.02%)
ns3::DlInfoListElement_s::HarqStatus_e* std::__copy_move_a<true, ns3::DlInfoListElement_s::HarqStatus_e*, ns3::DlInfoListElement_s::HarqStatus_e*> (267,517 samples, 0.03%)
std::__cxx11::list<ns3::Callback<void, ns3::Ptr<ns3::Packet const> >, std::allocator<ns3::Callback<void, ns3::Ptr<ns3::Packet const> > > >::end (205,687 samples, 0.02%)
ns3::HarqProcessInfoElement_t* std::uninitialized_copy<__gnu_cxx::__normal_iterator<ns3::HarqProcessInfoElement_t const*, std::vector<ns3::HarqProcessInfoElement_t, std::allocator<ns3::HarqProcessInfoElement_t> > >, ns3::HarqProcessInfoElement_t*> (1,567,317 samples, 0.16%)
void std::_Construct<ns3::DlInfoListElement_s, ns3::DlInfoListElement_s&> (313,569 samples, 0.03%)
std::vector<ns3::CqiListElement_s, std::allocator<ns3::CqiListElement_s> >::_M_erase_at_end (416,767 samples, 0.04%)
std::_Rb_tree<ns3::Scheduler::EventKey, std::pair<ns3::Scheduler::EventKey const, ns3::EventImpl*>, std::_Select1st<std::pair<ns3::Scheduler::EventKey const, ns3::EventImpl*> >, std::less<ns3::Scheduler::EventKey>, std::allocator<std::pair<ns3::Scheduler::EventKey const, ns3::EventImpl*> > >::erase[abi:cxx11] (6,953,857 samples, 0.72%)
ns3::CqiListElement_s::CqiListElement_s (3,330,355 samples, 0.34%)
std::_Rb_tree<unsigned int, std::pair<unsigned int const, ns3::Ptr<ns3::SpectrumValue> >, std::_Select1st<std::pair<unsigned int const, ns3::Ptr<ns3::SpectrumValue> > >, std::less<unsigned int>, std::allocator<std::pair<unsigned int const, ns3::Ptr<ns3::SpectrumValue> > > >::_Rb_tree (152,827 samples, 0.02%)
bool __gnu_cxx::operator==<ns3::VendorSpecificListElement_s const*, std::vector<ns3::VendorSpecificListElement_s, std::allocator<ns3::VendorSpecificListElement_s> > > (156,843 samples, 0.02%)
ns3::SimpleRefCount<ns3::Object, ns3::ObjectBase, ns3::ObjectDeleter>::Unref (2,031,472 samples, 0.21%)
ns3::ByteTagList::~ByteTagList (336,743 samples, 0.03%)
std::vector<int, std::allocator<int> >::begin (166,916 samples, 0.02%)
ns3::SpectrumValue::operator[] (472,196 samples, 0.05%)
ns3::Ptr<ns3::SpectrumPhy> ns3::Object::GetObject<ns3::SpectrumPhy> (1,654,930 samples, 0.17%)
std::__cxx11::list<ns3::UlDciLteControlMessage, std::allocator<ns3::UlDciLteControlMessage> >::operator= (1,124,799 samples, 0.12%)
ns3::DefaultSimulatorImpl::Schedule (15,576,788 samples, 1.61%)
std::allocator_traits<std::allocator<ns3::DlInfoListElement_s> >::allocate (265,191 samples, 0.03%)
std::vector<ns3::HarqProcessInfoElement_t, std::allocator<ns3::HarqProcessInfoElement_t> >::size (154,036 samples, 0.02%)
decltype (181,678 samples, 0.02%)
void std::allocator_traits<std::allocator<std::_Rb_tree_node<std::pair<unsigned int const, ns3::Ptr<ns3::SpectrumValue> > > > >::construct<std::pair<unsigned int const, ns3::Ptr<ns3::SpectrumValue> >, std::pair<unsigned int const, ns3::Ptr<ns3::SpectrumValue> > const&> (127,066 samples, 0.01%)
ns3::PacketBurst::~PacketBurst (1,782,590 samples, 0.18%)
malloc (429,586 samples, 0.04%)
std::__cxx11::list<ns3::Callback<void, ns3::Ptr<ns3::SpectrumSignalParameters> >, std::allocator<ns3::Callback<void, ns3::Ptr<ns3::SpectrumSignalParameters> > > >::begin (232,164 samples, 0.02%)
ns3::SimpleRefCount<ns3::Packet, ns3::Empty, ns3::DefaultDeleter<ns3::Packet> >::SimpleRefCount (222,949 samples, 0.02%)
ns3::Buffer::Initialize (1,790,059 samples, 0.18%)
std::_Vector_base<ns3::Ptr<ns3::Object>, std::allocator<ns3::Ptr<ns3::Object> > >::_Vector_base (124,541 samples, 0.01%)
ns3::ByteTagList::Iterator::Iterator (236,079 samples, 0.02%)
std::vector<double, std::allocator<double> >::at (190,175 samples, 0.02%)
ns3::DlHarqFeedbackLteControlMessage::SetDlHarqFeedback (234,084 samples, 0.02%)
std::_Bit_const_iterator::_Bit_const_iterator (148,793 samples, 0.02%)
std::__cxx11::list<ns3::Ptr<ns3::Packet>, std::allocator<ns3::Ptr<ns3::Packet> > >::begin (160,992 samples, 0.02%)
std::vector<ns3::IidManager::IidInformation, std::allocator<ns3::IidManager::IidInformation> >::size (157,042 samples, 0.02%)
std::__cxx11::_List_base<ns3::Ptr<ns3::Packet>, std::allocator<ns3::Ptr<ns3::Packet> > >::_List_base (209,616 samples, 0.02%)
std::vector<ns3::DlInfoListElement_s, std::allocator<ns3::DlInfoListElement_s> >::begin (156,943 samples, 0.02%)
std::__cxx11::_List_base<ns3::Ptr<ns3::LteControlMessage>, std::allocator<ns3::Ptr<ns3::LteControlMessage> > >::_List_impl::_List_impl (410,572 samples, 0.04%)
void std::_Destroy_aux<false>::__destroy<ns3::VendorSpecificListElement_s*> (234,807 samples, 0.02%)
std::_Rb_tree<unsigned short, std::pair<unsigned short const, std::vector<std::vector<ns3::Ptr<ns3::PacketBurst>, std::allocator<ns3::Ptr<ns3::PacketBurst> > >, std::allocator<std::vector<ns3::Ptr<ns3::PacketBurst>, std::allocator<ns3::Ptr<ns3::PacketBurst> > > > > >, std::_Select1st<std::pair<unsigned short const, std::vector<std::vector<ns3::Ptr<ns3::PacketBurst>, std::allocator<ns3::Ptr<ns3::PacketBurst> > >, std::allocator<std::vector<ns3::Ptr<ns3::PacketBurst>, std::allocator<ns3::Ptr<ns3::PacketBurst> > > > > > >, std::less<unsigned short>, std::allocator<std::pair<unsigned short const, std::vector<std::vector<ns3::Ptr<ns3::PacketBurst>, std::allocator<ns3::Ptr<ns3::PacketBurst> > >, std::allocator<std::vector<ns3::Ptr<ns3::PacketBurst>, std::allocator<ns3::Ptr<ns3::PacketBurst> > > > > > > >::_M_mbegin (191,851 samples, 0.02%)
ns3::TypeId::GetAttributeN (942,736 samples, 0.10%)
std::vector<ns3::BuildDataListElement_s, std::allocator<ns3::BuildDataListElement_s> >::vector (1,851,121 samples, 0.19%)
std::_Vector_base<int, std::allocator<int> >::_M_create_storage (635,025 samples, 0.07%)
bool std::_Function_base::_Base_manager<std::_Bind<void (159,062 samples, 0.02%)
std::_Rb_tree_iterator<std::pair<unsigned short const, std::vector<unsigned short, std::allocator<unsigned short> > > >::_Rb_tree_iterator (189,556 samples, 0.02%)
ns3::Ptr<ns3::SpectrumModel const>::operator (157,592 samples, 0.02%)
ns3::Ptr<ns3::LteControlMessage>::~Ptr (167,870 samples, 0.02%)
ns3::PacketTagList::Remove (1,461,431 samples, 0.15%)
__gnu_cxx::__normal_iterator<double*, std::vector<double, std::allocator<double> > >::__normal_iterator (157,586 samples, 0.02%)
std::operator== (190,947 samples, 0.02%)
ns3::Ptr<ns3::DlDciLteControlMessage>::operator (247,279 samples, 0.03%)
double* std::__copy_move_a<false, __gnu_cxx::__normal_iterator<double const*, std::vector<double, std::allocator<double> > >, double*> (231,188 samples, 0.02%)
decltype (238,924 samples, 0.02%)
ns3::SimpleRefCount<ns3::Object, ns3::ObjectBase, ns3::ObjectDeleter>::Unref (4,924,388 samples, 0.51%)
ns3::Simulator::Run (5,321,712 samples, 0.55%)
void std::_Construct<ns3::CqiListElement_s, ns3::CqiListElement_s&> (3,446,655 samples, 0.36%)
ns3::Simulator::Destroy (238,924 samples, 0.02%)
std::_Rb_tree<unsigned short, std::pair<unsigned short const, ns3::DlInfoListElement_s>, std::_Select1st<std::pair<unsigned short const, ns3::DlInfoListElement_s> >, std::less<unsigned short>, std::allocator<std::pair<unsigned short const, ns3::DlInfoListElement_s> > >::find (353,675 samples, 0.04%)
std::__new_allocator<double>::deallocate (199,701 samples, 0.02%)
ns3::ObjectDeleter::Delete (2,326,898 samples, 0.24%)
std::_Rb_tree_iterator<std::pair<ns3::Scheduler::EventKey const, ns3::EventImpl*> > std::map<ns3::Scheduler::EventKey, ns3::EventImpl*, std::less<ns3::Scheduler::EventKey>, std::allocator<std::pair<ns3::Scheduler::EventKey const, ns3::EventImpl*> > >::emplace_hint<std::pair<ns3::Scheduler::EventKey, ns3::EventImpl*> > (2,428,249 samples, 0.25%)
std::_Vector_base<ns3::HigherLayerSelected_s, std::allocator<ns3::HigherLayerSelected_s> >::~_Vector_base (148,819 samples, 0.02%)
ns3::UlDciLteControlMessage& std::__cxx11::list<ns3::UlDciLteControlMessage, std::allocator<ns3::UlDciLteControlMessage> >::emplace_back<ns3::UlDciLteControlMessage const&> (139,939 samples, 0.01%)
ns3::SpectrumValue::GetSpectrumModel (192,465 samples, 0.02%)
std::allocator_traits<std::allocator<std::_Rb_tree_node<std::pair<unsigned short const, std::vector<unsigned short, std::allocator<unsigned short> > > > > >::allocate (228,044 samples, 0.02%)
std::_Vector_base<double, std::allocator<double> >::_M_deallocate (124,900 samples, 0.01%)
std::_Vector_base<unsigned int, std::allocator<unsigned int> >::_M_deallocate (393,825 samples, 0.04%)
ns3::TagBuffer::ReadU8 (242,549 samples, 0.03%)
std::vector<unsigned short, std::allocator<unsigned short> >::push_back (376,292 samples, 0.04%)
ns3::VendorSpecificListElement_s* std::__do_uninit_copy<__gnu_cxx::__normal_iterator<ns3::VendorSpecificListElement_s const*, std::vector<ns3::VendorSpecificListElement_s, std::allocator<ns3::VendorSpecificListElement_s> > >, ns3::VendorSpecificListElement_s*> (401,487 samples, 0.04%)
std::_Rb_tree_node<std::pair<unsigned short const, std::vector<double, std::allocator<double> > > >* std::_Rb_tree<unsigned short, std::pair<unsigned short const, std::vector<double, std::allocator<double> > >, std::_Select1st<std::pair<unsigned short const, std::vector<double, std::allocator<double> > > >, std::less<unsigned short>, std::allocator<std::pair<unsigned short const, std::vector<double, std::allocator<double> > > > >::_M_create_node<std::pair<unsigned short const, std::vector<double, std::allocator<double> > > const&> (3,565,957 samples, 0.37%)
std::__is_constant_evaluated (126,671 samples, 0.01%)
ns3::CqiListElement_s::CqiListElement_s (892,722 samples, 0.09%)
ns3::CallbackImpl<void, std::__cxx11::list<ns3::Ptr<ns3::LteControlMessage>, std::allocator<ns3::Ptr<ns3::LteControlMessage> > > >::operator (75,554,587 samples, 7.79%) ns3::C..
ns3::Object::Construct (2,912,216 samples, 0.30%)
__gnu_cxx::__normal_iterator<int const*, std::vector<int, std::allocator<int> > > std::__miter_base<__gnu_cxx::__normal_iterator<int const*, std::vector<int, std::allocator<int> > > > (153,542 samples, 0.02%)
std::_List_iterator<ns3::Ptr<ns3::LteControlMessage> > std::__cxx11::list<ns3::Ptr<ns3::LteControlMessage>, std::allocator<ns3::Ptr<ns3::LteControlMessage> > >::insert<std::_List_const_iterator<ns3::Ptr<ns3::LteControlMessage> >, void> (804,377 samples, 0.08%)
std::vector<ns3::HarqProcessInfoElement_t, std::allocator<ns3::HarqProcessInfoElement_t> >::~vector (530,782 samples, 0.05%)
std::_Rb_tree<unsigned char, std::pair<unsigned char const, ns3::LteMacSapUser*>, std::_Select1st<std::pair<unsigned char const, ns3::LteMacSapUser*> >, std::less<unsigned char>, std::allocator<std::pair<unsigned char const, ns3::LteMacSapUser*> > >::_M_begin (452,338 samples, 0.05%)
std::vector<unsigned short, std::allocator<unsigned short> >::_Temporary_value::_Temporary_value<unsigned short const&> (610,808 samples, 0.06%)
void std::_Destroy_aux<false>::__destroy<__gnu_cxx::__normal_iterator<ns3::VendorSpecificListElement_s*, std::vector<ns3::VendorSpecificListElement_s, std::allocator<ns3::VendorSpecificListElement_s> > > > (201,318 samples, 0.02%)
std::_Function_base::_Base_manager<std::_Bind<void (159,033 samples, 0.02%)
double* std::__uninitialized_copy<true>::__uninit_copy<__gnu_cxx::__normal_iterator<double const*, std::vector<double, std::allocator<double> > >, double*> (165,918 samples, 0.02%)
decltype (2,931,196 samples, 0.30%)
ns3::CqiListElement_s* std::__uninitialized_copy<false>::__uninit_copy<__gnu_cxx::__normal_iterator<ns3::CqiListElement_s*, std::vector<ns3::CqiListElement_s, std::allocator<ns3::CqiListElement_s> > >, ns3::CqiListElement_s*> (3,635,299 samples, 0.37%)
std::vector<unsigned char, std::allocator<unsigned char> >::back (207,937 samples, 0.02%)
ns3::MemberLteCcmMacSapUser<ns3::NoOpComponentCarrierManager>::NotifyTxOpportunity (314,249 samples, 0.03%)
void std::__invoke_impl<void, void (2,784,150 samples, 0.29%)
std::_Rb_tree<ns3::Scheduler::EventKey, std::pair<ns3::Scheduler::EventKey const, ns3::EventImpl*>, std::_Select1st<std::pair<ns3::Scheduler::EventKey const, ns3::EventImpl*> >, std::less<ns3::Scheduler::EventKey>, std::allocator<std::pair<ns3::Scheduler::EventKey const, ns3::EventImpl*> > >::_M_mbegin (202,221 samples, 0.02%)
__cxxabiv1::__vmi_class_type_info::__do_dyncast (186,796 samples, 0.02%)
ns3::operator- (162,725 samples, 0.02%)
decltype (290,705 samples, 0.03%)
std::_Vector_base<ns3::DlInfoListElement_s::HarqStatus_e, std::allocator<ns3::DlInfoListElement_s::HarqStatus_e> >::_Vector_impl::_Vector_impl (271,897 samples, 0.03%)
std::_Vector_base<double, std::allocator<double> >::_M_create_storage (235,300 samples, 0.02%)
std::vector<unsigned char, std::allocator<unsigned char> >::end (205,079 samples, 0.02%)
void std::__cxx11::list<ns3::Ptr<ns3::LteControlMessage>, std::allocator<ns3::Ptr<ns3::LteControlMessage> > >::_M_insert<ns3::Ptr<ns3::LteControlMessage> const&> (532,874 samples, 0.05%)
std::_Rb_tree<unsigned int, std::pair<unsigned int const, ns3::Ptr<ns3::SpectrumValue> >, std::_Select1st<std::pair<unsigned int const, ns3::Ptr<ns3::SpectrumValue> > >, std::less<unsigned int>, std::allocator<std::pair<unsigned int const, ns3::Ptr<ns3::SpectrumValue> > > >::_M_copy (527,289 samples, 0.05%)
__gnu_cxx::__aligned_membuf<std::pair<unsigned short const, std::vector<std::vector<ns3::HarqProcessInfoElement_t, std::allocator<ns3::HarqProcessInfoElement_t> >, std::allocator<std::vector<ns3::HarqProcessInfoElement_t, std::allocator<ns3::HarqProcessInfoElement_t> > > > > >::_M_ptr (246,841 samples, 0.03%)
ns3::MakeEvent<> (238,924 samples, 0.02%)
unsigned char* std::__copy_move_a2<false, unsigned char const*, unsigned char*> (225,178 samples, 0.02%)
ns3::EnbMacMemberLteEnbPhySapUser::UlCqiReport (1,913,367 samples, 0.20%)
unsigned char* std::vector<unsigned char, std::allocator<unsigned char> >::_M_allocate_and_copy<__gnu_cxx::__normal_iterator<unsigned char const*, std::vector<unsigned char, std::allocator<unsigned char> > > > (144,727 samples, 0.01%)
ns3::Ptr<ns3::SpectrumValue>::operator= (208,946 samples, 0.02%)
void std::_Destroy<ns3::Ptr<ns3::Object>*> (500,080 samples, 0.05%)
std::vector<ns3::Buffer::Data*, std::allocator<ns3::Buffer::Data*> >::end (168,242 samples, 0.02%)
ns3::Ptr<ns3::EventImpl>::~Ptr (261,450 samples, 0.03%)
__gnu_cxx::__normal_iterator<unsigned char const*, std::vector<unsigned char, std::allocator<unsigned char> > >::__normal_iterator (286,765 samples, 0.03%)
std::vector<unsigned char, std::allocator<unsigned char> >::end (185,556 samples, 0.02%)
malloc (125,582 samples, 0.01%)
ns3::VendorSpecificListElement_s* std::uninitialized_copy<__gnu_cxx::__normal_iterator<ns3::VendorSpecificListElement_s const*, std::vector<ns3::VendorSpecificListElement_s, std::allocator<ns3::VendorSpecificListElement_s> > >, ns3::VendorSpecificListElement_s*> (198,957 samples, 0.02%)
std::enable_if<is_member_pointer_v<void (239,715 samples, 0.02%)
std::vector<std::__cxx11::list<ns3::Ptr<ns3::LteControlMessage>, std::allocator<ns3::Ptr<ns3::LteControlMessage> > >, std::allocator<std::__cxx11::list<ns3::Ptr<ns3::LteControlMessage>, std::allocator<ns3::Ptr<ns3::LteControlMessage> > > > >::end (143,255 samples, 0.01%)
ns3::MemberLteCcmMacSapProvider<ns3::LteEnbMac>::ReportMacCeToScheduler (280,173 samples, 0.03%)
ns3::DlInfoListElement_s::HarqStatus_e* std::uninitialized_copy<std::move_iterator<ns3::DlInfoListElement_s::HarqStatus_e*>, ns3::DlInfoListElement_s::HarqStatus_e*> (347,263 samples, 0.04%)
ns3::Ptr<ns3::LteControlMessage>::~Ptr (269,841 samples, 0.03%)
__gnu_cxx::__aligned_membuf<std::pair<unsigned char const, ns3::LteMacSapProvider*> >::_M_ptr (279,342 samples, 0.03%)
__gnu_cxx::__normal_iterator<int*, std::vector<int, std::allocator<int> > > std::copy<__gnu_cxx::__normal_iterator<int const*, std::vector<int, std::allocator<int> > >, __gnu_cxx::__normal_iterator<int*, std::vector<int, std::allocator<int> > > > (489,292 samples, 0.05%)
ns3::Ptr<ns3::LteControlMessage>& std::__cxx11::list<ns3::Ptr<ns3::LteControlMessage>, std::allocator<ns3::Ptr<ns3::LteControlMessage> > >::emplace_back<ns3::Ptr<ns3::LteControlMessage> const&> (539,424 samples, 0.06%)
unsigned char& std::vector<unsigned char, std::allocator<unsigned char> >::emplace_back<unsigned char> (1,837,360 samples, 0.19%)
__gnu_cxx::__aligned_membuf<ns3::Ptr<ns3::Packet> >::_M_addr (160,217 samples, 0.02%)
ns3::Ptr<ns3::SpectrumSignalParameters>::~Ptr (3,444,708 samples, 0.36%)
ns3::Simulator::ScheduleWithContext (6,833,554 samples, 0.70%)
ns3::AttributeConstructionList::AttributeConstructionList (1,330,457 samples, 0.14%)
std::_Rb_tree<unsigned char, std::pair<unsigned char const, ns3::LteMacSapProvider*>, std::_Select1st<std::pair<unsigned char const, ns3::LteMacSapProvider*> >, std::less<unsigned char>, std::allocator<std::pair<unsigned char const, ns3::LteMacSapProvider*> > >::_S_key (393,630 samples, 0.04%)
std::_Rb_tree_node<std::pair<ns3::Scheduler::EventKey const, ns3::EventImpl*> >* std::_Rb_tree<ns3::Scheduler::EventKey, std::pair<ns3::Scheduler::EventKey const, ns3::EventImpl*>, std::_Select1st<std::pair<ns3::Scheduler::EventKey const, ns3::EventImpl*> >, std::less<ns3::Scheduler::EventKey>, std::allocator<std::pair<ns3::Scheduler::EventKey const, ns3::EventImpl*> > >::_M_create_node<std::pair<ns3::Scheduler::EventKey, ns3::EventImpl*> > (217,068 samples, 0.02%)
std::__cxx11::list<ns3::Ptr<ns3::Packet>, std::allocator<ns3::Ptr<ns3::Packet> > >::push_back (2,730,012 samples, 0.28%)
std::_Vector_base<double, std::allocator<double> >::_Vector_base (692,819 samples, 0.07%)
ns3::LteEnbRrcProtocolIdeal::DoSendSystemInformation (188,903 samples, 0.02%)
std::_Vector_base<ns3::BuildBroadcastListElement_s, std::allocator<ns3::BuildBroadcastListElement_s> >::_Vector_impl::_Vector_impl (185,676 samples, 0.02%)
__gnu_cxx::__aligned_membuf<std::pair<unsigned short const, std::vector<std::vector<ns3::HarqProcessInfoElement_t, std::allocator<ns3::HarqProcessInfoElement_t> >, std::allocator<std::vector<ns3::HarqProcessInfoElement_t, std::allocator<ns3::HarqProcessInfoElement_t> > > > > >::_M_addr (305,390 samples, 0.03%)
ns3::Ptr<ns3::DlDciLteControlMessage> ns3::DynamicCast<ns3::DlDciLteControlMessage, ns3::LteControlMessage> (478,172 samples, 0.05%)
std::map<unsigned short, std::vector<std::vector<ns3::Ptr<ns3::PacketBurst>, std::allocator<ns3::Ptr<ns3::PacketBurst> > >, std::allocator<std::vector<ns3::Ptr<ns3::PacketBurst>, std::allocator<ns3::Ptr<ns3::PacketBurst> > > > >, std::less<unsigned short>, std::allocator<std::pair<unsigned short const, std::vector<std::vector<ns3::Ptr<ns3::PacketBurst>, std::allocator<ns3::Ptr<ns3::PacketBurst> > >, std::allocator<std::vector<ns3::Ptr<ns3::PacketBurst>, std::allocator<ns3::Ptr<ns3::PacketBurst> > > > > > > >::find (153,882 samples, 0.02%)
ns3::DefaultSimulatorImpl::Schedule (192,930 samples, 0.02%)
std::vector<bool, std::allocator<bool> >::begin (414,441 samples, 0.04%)
ns3::LogComponent::IsEnabled (165,541 samples, 0.02%)
std::_Rb_tree<ns3::Scheduler::EventKey, std::pair<ns3::Scheduler::EventKey const, ns3::EventImpl*>, std::_Select1st<std::pair<ns3::Scheduler::EventKey const, ns3::EventImpl*> >, std::less<ns3::Scheduler::EventKey>, std::allocator<std::pair<ns3::Scheduler::EventKey const, ns3::EventImpl*> > >::lower_bound (294,424 samples, 0.03%)
std::vector<double, std::allocator<double> >::vector (1,634,801 samples, 0.17%)
std::__cxx11::list<ns3::Ptr<ns3::Packet>, std::allocator<ns3::Ptr<ns3::Packet> > >::end (154,831 samples, 0.02%)
ns3::DlDciListElement_s::~DlDciListElement_s (280,667 samples, 0.03%)
__gnu_cxx::__aligned_membuf<ns3::Ptr<ns3::Packet> >::_M_addr (280,432 samples, 0.03%)
ns3::Time::To (989,300 samples, 0.10%)
ns3::Ptr<ns3::SpectrumModel const>::Acquire (160,796 samples, 0.02%)
std::vector<unsigned int, std::allocator<unsigned int> >::at (426,836 samples, 0.04%)
ns3::Time::Time (201,450 samples, 0.02%)
malloc (147,798 samples, 0.02%)
ns3::RarLteControlMessage::~RarLteControlMessage (509,242 samples, 0.05%)
std::_Vector_base<double, std::allocator<double> >::_Vector_base (539,442 samples, 0.06%)
std::vector<std::__cxx11::list<ns3::Ptr<ns3::LteControlMessage>, std::allocator<ns3::Ptr<ns3::LteControlMessage> > >, std::allocator<std::__cxx11::list<ns3::Ptr<ns3::LteControlMessage>, std::allocator<ns3::Ptr<ns3::LteControlMessage> > > > >::cbegin (346,916 samples, 0.04%)
ns3::DlInfoListElement_s::HarqStatus_e* std::__copy_move_a1<false, ns3::DlInfoListElement_s::HarqStatus_e const*, ns3::DlInfoListElement_s::HarqStatus_e*> (749,922 samples, 0.08%)
std::allocator<unsigned long>::allocate (271,783 samples, 0.03%)
ns3::LteEnbPhy::DoSendLteControlMessage (773,102 samples, 0.08%)
void std::__fill_a<double*, double> (203,543 samples, 0.02%)
ns3::Buffer::Buffer (239,848 samples, 0.02%)
ns3::LteSpectrumSignalParametersDataFrame::Copy (7,176,472 samples, 0.74%)
std::_Rb_tree<unsigned short, std::pair<unsigned short const, unsigned char>, std::_Select1st<std::pair<unsigned short const, unsigned char> >, std::less<unsigned short>, std::allocator<std::pair<unsigned short const, unsigned char> > >::_M_lower_bound (709,426 samples, 0.07%)
std::vector<ns3::Ptr<ns3::PacketBurst>, std::allocator<ns3::Ptr<ns3::PacketBurst> > >::at (232,011 samples, 0.02%)
std::vector<unsigned char, std::allocator<unsigned char> >::_M_fill_initialize (189,712 samples, 0.02%)
std::enable_if<is_member_pointer_v<void (759,561 samples, 0.08%)
std::_Tuple_impl<0ul, ns3::LteSpectrumPhy*>::_Tuple_impl (202,993 samples, 0.02%)
std::vector<double, std::allocator<double> >::begin (193,810 samples, 0.02%)
ns3::Packet::~Packet (319,925 samples, 0.03%)
std::vector<std::__cxx11::list<ns3::Ptr<ns3::LteControlMessage>, std::allocator<ns3::Ptr<ns3::LteControlMessage> > >, std::allocator<std::__cxx11::list<ns3::Ptr<ns3::LteControlMessage>, std::allocator<ns3::Ptr<ns3::LteControlMessage> > > > >::at (322,129 samples, 0.03%)
std::__new_allocator<std::_Rb_tree_node<std::pair<ns3::Scheduler::EventKey const, ns3::EventImpl*> > >::allocate (423,703 samples, 0.04%)
ns3::MakeEvent<void (4,824,055 samples, 0.50%)
ns3::Ptr<ns3::LteControlMessage>::~Ptr (199,934 samples, 0.02%)
ns3::SpectrumValue::ChangeSign (1,192,502 samples, 0.12%)
ns3::Ptr<ns3::PacketBurst>::Ptr (160,262 samples, 0.02%)
ns3::DlInfoListElement_s::HarqStatus_e* std::__copy_move_a2<false, ns3::DlInfoListElement_s::HarqStatus_e const*, ns3::DlInfoListElement_s::HarqStatus_e*> (243,097 samples, 0.03%)
std::vector<double, std::allocator<double> >::end (293,521 samples, 0.03%)
ns3::Time::operator= (180,257 samples, 0.02%)
std::vector<std::vector<ns3::HarqProcessInfoElement_t, std::allocator<ns3::HarqProcessInfoElement_t> >, std::allocator<std::vector<ns3::HarqProcessInfoElement_t, std::allocator<ns3::HarqProcessInfoElement_t> > > >::erase (3,797,469 samples, 0.39%)
std::vector<bool, std::allocator<bool> >::insert (5,134,912 samples, 0.53%)
ns3::Simulator::Now (384,287 samples, 0.04%)
std::_Tuple_impl<0ul, ns3::LteEnbPhy*, ns3::Ptr<ns3::PacketBurst> >::_Tuple_impl (474,767 samples, 0.05%)
__gnu_cxx::__normal_iterator<ns3::VendorSpecificListElement_s*, std::vector<ns3::VendorSpecificListElement_s, std::allocator<ns3::VendorSpecificListElement_s> > > std::__copy_move_a<false, __gnu_cxx::__normal_iterator<ns3::VendorSpecificListElement_s const*, std::vector<ns3::VendorSpecificListElement_s, std::allocator<ns3::VendorSpecificListElement_s> > >, __gnu_cxx::__normal_iterator<ns3::VendorSpecificListElement_s*, std::vector<ns3::VendorSpecificListElement_s, std::allocator<ns3::VendorSpecificListElement_s> > > > (603,286 samples, 0.06%)
std::_Vector_base<double, std::allocator<double> >::_M_allocate (429,586 samples, 0.04%)
std::_List_node<ns3::Ptr<ns3::Packet> >* std::__cxx11::list<ns3::Ptr<ns3::Packet>, std::allocator<ns3::Ptr<ns3::Packet> > >::_M_create_node<ns3::Ptr<ns3::Packet> const&> (955,890 samples, 0.10%)
std::allocator_traits<std::allocator<std::_Rb_tree_node<std::pair<ns3::TbId_t const, ns3::tbInfo_t> > > >::allocate (264,767 samples, 0.03%)
std::numeric_limits<unsigned int>::max (161,154 samples, 0.02%)
ns3::PacketBurst::DoDispose (507,948 samples, 0.05%)
ns3::PacketBurst::PacketBurst (220,732 samples, 0.02%)
void std::_Destroy<ns3::Ptr<ns3::Object>*> (194,998 samples, 0.02%)
std::map<unsigned short, std::vector<unsigned char, std::allocator<unsigned char> >, std::less<unsigned short>, std::allocator<std::pair<unsigned short const, std::vector<unsigned char, std::allocator<unsigned char> > > > >::find (152,754 samples, 0.02%)
std::_Rb_tree_iterator<std::pair<ns3::TbId_t const, ns3::tbInfo_t> > std::_Rb_tree<ns3::TbId_t, std::pair<ns3::TbId_t const, ns3::tbInfo_t>, std::_Select1st<std::pair<ns3::TbId_t const, ns3::tbInfo_t> >, std::less<ns3::TbId_t>, std::allocator<std::pair<ns3::TbId_t const, ns3::tbInfo_t> > >::_M_emplace_hint_unique<std::pair<ns3::TbId_t, ns3::tbInfo_t> > (2,663,179 samples, 0.27%)
ns3::MacCeValue_u::~MacCeValue_u (408,728 samples, 0.04%)
std::map<unsigned short, ns3::SbMeasResult_s, std::less<unsigned short>, std::allocator<std::pair<unsigned short const, ns3::SbMeasResult_s> > >::find (873,028 samples, 0.09%)
ns3::SpectrumModel* ns3::PeekPointer<ns3::SpectrumModel> (148,477 samples, 0.02%)
bool __gnu_cxx::operator==<ns3::ByteTagListData* const*, std::vector<ns3::ByteTagListData*, std::allocator<ns3::ByteTagListData*> > > (357,081 samples, 0.04%)
std::_Rb_tree_node<std::pair<unsigned char const, ns3::LteMacSapUser*> >::_M_valptr (255,360 samples, 0.03%)
__gnu_cxx::__normal_iterator<ns3::ByteTagListData**, std::vector<ns3::ByteTagListData*, std::allocator<ns3::ByteTagListData*> > >::operator* (164,625 samples, 0.02%)
std::_Rb_tree<unsigned int, std::pair<unsigned int const, ns3::Ptr<ns3::SpectrumValue> >, std::_Select1st<std::pair<unsigned int const, ns3::Ptr<ns3::SpectrumValue> > >, std::less<unsigned int>, std::allocator<std::pair<unsigned int const, ns3::Ptr<ns3::SpectrumValue> > > >::_Rb_tree (198,211 samples, 0.02%)
ns3::LteEnbPhy::GeneratePowerAllocationMap (650,842 samples, 0.07%)
ns3::Ptr<ns3::Packet>::operator= (230,262 samples, 0.02%)
std::__cxx11::_List_base<ns3::Ptr<ns3::Packet>, std::allocator<ns3::Ptr<ns3::Packet> > >::_List_base (159,271 samples, 0.02%)
void std::_Destroy_aux<true>::__destroy<ns3::RlcPduListElement_s*> (151,388 samples, 0.02%)
std::map<unsigned short, std::vector<double, std::allocator<double> >, std::less<unsigned short>, std::allocator<std::pair<unsigned short const, std::vector<double, std::allocator<double> > > > >::find (1,290,271 samples, 0.13%)
std::vector<unsigned short, std::allocator<unsigned short> >::_M_fill_insert (343,043 samples, 0.04%)
std::_Vector_base<double, std::allocator<double> >::_Vector_base (242,221 samples, 0.02%)
ns3::Ptr<ns3::PacketBurst>::operator= (2,555,713 samples, 0.26%)
ns3::UlInfoListElement_s::UlInfoListElement_s (526,168 samples, 0.05%)
std::vector<ns3::RlcPduListElement_s, std::allocator<ns3::RlcPduListElement_s> >::vector (1,840,875 samples, 0.19%)
std::__cxx11::list<ns3::Ptr<ns3::LteControlMessage>, std::allocator<ns3::Ptr<ns3::LteControlMessage> > >::back (305,905 samples, 0.03%)
std::allocator<double>::allocate (429,586 samples, 0.04%)
std::_Rb_tree<unsigned short, std::pair<unsigned short const, unsigned int>, std::_Select1st<std::pair<unsigned short const, unsigned int> >, std::less<unsigned short>, std::allocator<std::pair<unsigned short const, unsigned int> > >::find (1,164,278 samples, 0.12%)
std::vector<double, std::allocator<double> >::vector (242,130 samples, 0.02%)
std::enable_if<std::is_constructible<std::pair<ns3::TbId_t const, ns3::tbInfo_t>, std::pair<ns3::TbId_t, ns3::tbInfo_t> >::value, std::pair<std::_Rb_tree_iterator<std::pair<ns3::TbId_t const, ns3::tbInfo_t> >, bool> >::type std::map<ns3::TbId_t, ns3::tbInfo_t, std::less<ns3::TbId_t>, std::allocator<std::pair<ns3::TbId_t const, ns3::tbInfo_t> > >::insert<std::pair<ns3::TbId_t, ns3::tbInfo_t> > (181,887 samples, 0.02%)
std::_Rb_tree_iterator<std::pair<unsigned short const, std::vector<unsigned short, std::allocator<unsigned short> > > >::operator* (341,636 samples, 0.04%)
ns3::Ptr<ns3::LteControlMessage>::~Ptr (156,455 samples, 0.02%)
std::operator== (191,748 samples, 0.02%)
std::vector<ns3::UlInfoListElement_s, std::allocator<ns3::UlInfoListElement_s> >::operator= (1,296,028 samples, 0.13%)
std::function<void (235,820 samples, 0.02%)
operator new (159,293 samples, 0.02%)
ns3::Ptr<ns3::MobilityModel>::Ptr (283,469 samples, 0.03%)
unsigned char* std::__uninitialized_copy<true>::__uninit_copy<__gnu_cxx::__normal_iterator<unsigned char const*, std::vector<unsigned char, std::allocator<unsigned char> > >, unsigned char*> (356,896 samples, 0.04%)
std::vector<ns3::Buffer::Data*, std::allocator<ns3::Buffer::Data*> >::back (542,975 samples, 0.06%)
std::_Rb_tree<int, std::pair<int const, double>, std::_Select1st<std::pair<int const, double> >, std::less<int>, std::allocator<std::pair<int const, double> > >::_M_mbegin (125,248 samples, 0.01%)
std::_Tuple_impl<2ul, double, ns3::Ptr<ns3::SpectrumSignalParameters>, ns3::Ptr<ns3::SpectrumPhy>, std::map<unsigned int, ns3::Ptr<ns3::SpectrumValue>, std::less<unsigned int>, std::allocator<std::pair<unsigned int const, ns3::Ptr<ns3::SpectrumValue> > > > >::_Tuple_impl<double&, ns3::Ptr<ns3::SpectrumSignalParameters>&, ns3::Ptr<ns3::SpectrumPhy>&, std::map<unsigned int, ns3::Ptr<ns3::SpectrumValue>, std::less<unsigned int>, std::allocator<std::pair<unsigned int const, ns3::Ptr<ns3::SpectrumValue> > > >&, void> (317,763 samples, 0.03%)
decltype (389,168 samples, 0.04%)
unsigned int* std::uninitialized_fill_n<unsigned int*, unsigned long, unsigned int> (1,094,828 samples, 0.11%)
void std::allocator_traits<std::allocator<ns3::HigherLayerSelected_s> >::construct<ns3::HigherLayerSelected_s, ns3::HigherLayerSelected_s> (545,065 samples, 0.06%)
ns3::DlInfoListElement_s::HarqStatus_e* std::__copy_move<false, true, std::random_access_iterator_tag>::__copy_m<ns3::DlInfoListElement_s::HarqStatus_e const, ns3::DlInfoListElement_s::HarqStatus_e> (158,174 samples, 0.02%)
std::_Rb_tree<unsigned int, std::pair<unsigned int const, ns3::Ptr<ns3::SpectrumValue> >, std::_Select1st<std::pair<unsigned int const, ns3::Ptr<ns3::SpectrumValue> > >, std::less<unsigned int>, std::allocator<std::pair<unsigned int const, ns3::Ptr<ns3::SpectrumValue> > > >::_Auto_node::_M_insert (162,012 samples, 0.02%)
decltype (353,605 samples, 0.04%)
std::map<unsigned int, ns3::TxSpectrumModelInfo, std::less<unsigned int>, std::allocator<std::pair<unsigned int const, ns3::TxSpectrumModelInfo> > >::find (2,900,479 samples, 0.30%)
std::vector<unsigned short, std::allocator<unsigned short> >::at (200,222 samples, 0.02%)
std::allocator<std::_List_node<ns3::Ptr<ns3::LteControlMessage> > >::deallocate (124,394 samples, 0.01%)
std::enable_if<is_invocable_r_v<void, void (2,940,550 samples, 0.30%)
[libm.so.6] (153,007 samples, 0.02%)
ns3::SpectrumValue::SpectrumValue (742,462 samples, 0.08%)
std::less<unsigned short>::operator (263,666 samples, 0.03%)
ns3::CqiListElement_s::~CqiListElement_s (293,386 samples, 0.03%)
std::__cxx11::_List_base<ns3::Ptr<ns3::LteControlMessage>, std::allocator<ns3::Ptr<ns3::LteControlMessage> > >::_List_base (293,130 samples, 0.03%)
__gnu_cxx::__normal_iterator<ns3::VendorSpecificListElement_s*, std::vector<ns3::VendorSpecificListElement_s, std::allocator<ns3::VendorSpecificListElement_s> > > std::copy<__gnu_cxx::__normal_iterator<ns3::VendorSpecificListElement_s const*, std::vector<ns3::VendorSpecificListElement_s, std::allocator<ns3::VendorSpecificListElement_s> > >, __gnu_cxx::__normal_iterator<ns3::VendorSpecificListElement_s*, std::vector<ns3::VendorSpecificListElement_s, std::allocator<ns3::VendorSpecificListElement_s> > > > (183,538 samples, 0.02%)
ns3::Ptr<ns3::Packet>::Ptr (567,669 samples, 0.06%)
std::vector<ns3::UlInfoListElement_s, std::allocator<ns3::UlInfoListElement_s> >::empty (391,139 samples, 0.04%)
ns3::DefaultSimulatorImpl::ProcessOneEvent (5,321,712 samples, 0.55%)
std::vector<int, std::allocator<int> >::~vector (448,730 samples, 0.05%)
std::allocator<std::_List_node<ns3::Ptr<ns3::PacketBurst> > >* std::__addressof<std::allocator<std::_List_node<ns3::Ptr<ns3::PacketBurst> > > > (320,226 samples, 0.03%)
std::_Function_base::_Base_manager<std::_Bind<void (6,819,282 samples, 0.70%)
ns3::DlInfoListElement_s::HarqStatus_e* std::__uninitialized_copy_a<__gnu_cxx::__normal_iterator<ns3::DlInfoListElement_s::HarqStatus_e const*, std::vector<ns3::DlInfoListElement_s::HarqStatus_e, std::allocator<ns3::DlInfoListElement_s::HarqStatus_e> > >, ns3::DlInfoListElement_s::HarqStatus_e*, ns3::DlInfoListElement_s::HarqStatus_e> (147,743 samples, 0.02%)
int* std::__copy_move_a<false, __gnu_cxx::__normal_iterator<int const*, std::vector<int, std::allocator<int> > >, int*> (232,547 samples, 0.02%)
std::pair<std::_Rb_tree_iterator<std::pair<ns3::Scheduler::EventKey const, ns3::EventImpl*> >, bool>::pair (150,672 samples, 0.02%)
ns3::Ptr<ns3::SpectrumModel const>::Ptr (194,816 samples, 0.02%)
ns3::tbInfo_t::~tbInfo_t (271,160 samples, 0.03%)
std::_List_node<ns3::Ptr<ns3::LteControlMessage> >* std::__cxx11::list<ns3::Ptr<ns3::LteControlMessage>, std::allocator<ns3::Ptr<ns3::LteControlMessage> > >::_M_create_node<ns3::Ptr<ns3::LteControlMessage> const&> (447,972 samples, 0.05%)
std::operator== (294,846 samples, 0.03%)
void std::vector<ns3::CqiListElement_s, std::allocator<ns3::CqiListElement_s> >::_M_range_insert<__gnu_cxx::__normal_iterator<ns3::CqiListElement_s*, std::vector<ns3::CqiListElement_s, std::allocator<ns3::CqiListElement_s> > > > (4,898,473 samples, 0.51%)
std::vector<unsigned short, std::allocator<unsigned short> >::push_back (2,561,414 samples, 0.26%)
void std::_Rb_tree<ns3::Scheduler::EventKey, std::pair<ns3::Scheduler::EventKey const, ns3::EventImpl*>, std::_Select1st<std::pair<ns3::Scheduler::EventKey const, ns3::EventImpl*> >, std::less<ns3::Scheduler::EventKey>, std::allocator<std::pair<ns3::Scheduler::EventKey const, ns3::EventImpl*> > >::_M_construct_node<std::pair<ns3::Scheduler::EventKey, ns3::EventImpl*> > (522,481 samples, 0.05%)
std::_Rb_tree<ns3::Scheduler::EventKey, std::pair<ns3::Scheduler::EventKey const, ns3::EventImpl*>, std::_Select1st<std::pair<ns3::Scheduler::EventKey const, ns3::EventImpl*> >, std::less<ns3::Scheduler::EventKey>, std::allocator<std::pair<ns3::Scheduler::EventKey const, ns3::EventImpl*> > >::empty (283,670 samples, 0.03%)
void std::_Rb_tree<ns3::Scheduler::EventKey, std::pair<ns3::Scheduler::EventKey const, ns3::EventImpl*>, std::_Select1st<std::pair<ns3::Scheduler::EventKey const, ns3::EventImpl*> >, std::less<ns3::Scheduler::EventKey>, std::allocator<std::pair<ns3::Scheduler::EventKey const, ns3::EventImpl*> > >::_M_construct_node<std::pair<ns3::Scheduler::EventKey, ns3::EventImpl*> > (861,873 samples, 0.09%)
ns3::Object::Object (977,100 samples, 0.10%)
std::_Select1st<std::pair<unsigned int const, ns3::SpectrumConverter> >::operator (208,208 samples, 0.02%)
std::_Rb_tree_node<std::pair<unsigned int const, ns3::Ptr<ns3::SpectrumValue> > >* std::_Rb_tree<unsigned int, std::pair<unsigned int const, ns3::Ptr<ns3::SpectrumValue> >, std::_Select1st<std::pair<unsigned int const, ns3::Ptr<ns3::SpectrumValue> > >, std::less<unsigned int>, std::allocator<std::pair<unsigned int const, ns3::Ptr<ns3::SpectrumValue> > > >::_M_clone_node<false, std::_Rb_tree<unsigned int, std::pair<unsigned int const, ns3::Ptr<ns3::SpectrumValue> >, std::_Select1st<std::pair<unsigned int const, ns3::Ptr<ns3::SpectrumValue> > >, std::less<unsigned int>, std::allocator<std::pair<unsigned int const, ns3::Ptr<ns3::SpectrumValue> > > >::_Alloc_node> (158,119 samples, 0.02%)
__gnu_cxx::__normal_iterator<ns3::HigherLayerSelected_s*, std::vector<ns3::HigherLayerSelected_s, std::allocator<ns3::HigherLayerSelected_s> > > std::__copy_move_a<false, __gnu_cxx::__normal_iterator<ns3::HigherLayerSelected_s const*, std::vector<ns3::HigherLayerSelected_s, std::allocator<ns3::HigherLayerSelected_s> > >, __gnu_cxx::__normal_iterator<ns3::HigherLayerSelected_s*, std::vector<ns3::HigherLayerSelected_s, std::allocator<ns3::HigherLayerSelected_s> > > > (231,948 samples, 0.02%)
ns3::PfFfMacScheduler::DoSchedDlTriggerReq (314,249 samples, 0.03%)
ns3::Time::operator= (268,567 samples, 0.03%)
std::__cxx11::_List_base<ns3::UlDciLteControlMessage, std::allocator<ns3::UlDciLteControlMessage> >::_List_base (945,418 samples, 0.10%)
ns3::SimpleRefCount<ns3::EventImpl, ns3::Empty, ns3::DefaultDeleter<ns3::EventImpl> >::Unref (152,343 samples, 0.02%)
ns3::DlInfoListElement_s::DlInfoListElement_s (4,041,567 samples, 0.42%)
void std::__fill_a<std::_Bit_iterator, bool> (391,811 samples, 0.04%)
ns3::CallbackImpl<void, ns3::SpectrumValue const&>::operator (324,769 samples, 0.03%)
ns3::LogComponent::IsEnabled (155,530 samples, 0.02%)
std::allocator_traits<std::allocator<double> >::deallocate (154,926 samples, 0.02%)
unsigned long const& std::max<unsigned long> (149,635 samples, 0.02%)
ns3::FfMacSchedSapProvider::SchedUlCqiInfoReqParameters::SchedUlCqiInfoReqParameters (569,767 samples, 0.06%)
std::_Head_base<1ul, unsigned int, false>::_Head_base<unsigned int&> (390,794 samples, 0.04%)
int* std::__uninitialized_copy_a<__gnu_cxx::__normal_iterator<int const*, std::vector<int, std::allocator<int> > >, int*, int> (973,754 samples, 0.10%)
ns3::Seconds (258,846 samples, 0.03%)
double const* std::__niter_base<double const*, std::vector<double, std::allocator<double> > > (181,230 samples, 0.02%)
std::_Vector_base<ns3::HarqProcessInfoElement_t, std::allocator<ns3::HarqProcessInfoElement_t> >::_M_get_Tp_allocator (236,458 samples, 0.02%)
void std::_Function_base::_Base_manager<std::_Bind<void (819,716 samples, 0.08%)
std::vector<unsigned char, std::allocator<unsigned char> >::_M_default_append (1,930,472 samples, 0.20%)
void std::_Destroy<ns3::HarqProcessInfoElement_t*> (288,179 samples, 0.03%)
std::map<unsigned int, ns3::Ptr<ns3::SpectrumValue>, std::less<unsigned int>, std::allocator<std::pair<unsigned int const, ns3::Ptr<ns3::SpectrumValue> > > >::map (158,119 samples, 0.02%)
ns3::Ptr<ns3::PacketBurst>::~Ptr (3,158,900 samples, 0.33%)
std::vector<ns3::Buffer::Data*, std::allocator<ns3::Buffer::Data*> >::empty (1,091,313 samples, 0.11%)
ns3::LteMiErrorModel::Mib (946,675 samples, 0.10%)
ns3::LteRadioBearerTag::LteRadioBearerTag (416,698 samples, 0.04%)
std::_Function_base::_M_empty (149,519 samples, 0.02%)
std::allocator_traits<std::allocator<double> >::allocate (429,586 samples, 0.04%)
std::vector<ns3::MacCeListElement_s, std::allocator<ns3::MacCeListElement_s> >::begin (152,476 samples, 0.02%)
std::vector<unsigned char, std::allocator<unsigned char> >::vector (578,299 samples, 0.06%)
std::__cxx11::list<ns3::Ptr<ns3::Packet>, std::allocator<ns3::Ptr<ns3::Packet> > >::begin (290,983 samples, 0.03%)
std::_Function_handler<void (7,010,506 samples, 0.72%)
ns3::operator/ (752,804 samples, 0.08%)
void std::_Rb_tree<unsigned short, std::pair<unsigned short const, std::vector<unsigned short, std::allocator<unsigned short> > >, std::_Select1st<std::pair<unsigned short const, std::vector<unsigned short, std::allocator<unsigned short> > > >, std::less<unsigned short>, std::allocator<std::pair<unsigned short const, std::vector<unsigned short, std::allocator<unsigned short> > > > >::_M_construct_node<std::piecewise_construct_t const&, std::tuple<unsigned short const&>, std::tuple<> > (190,282 samples, 0.02%)
std::operator== (198,006 samples, 0.02%)
void std::allocator_traits<std::allocator<ns3::UlInfoListElement_s> >::construct<ns3::UlInfoListElement_s, ns3::UlInfoListElement_s const&> (331,199 samples, 0.03%)
[libc.so.6] (125,474 samples, 0.01%)
ns3::EnbMacMemberFfMacSchedSapUser::SchedDlConfigInd (314,249 samples, 0.03%)
ns3::int64x64_t::Mul (269,603 samples, 0.03%)
ns3::MemberLteFfrSapProvider<ns3::LteFrNoOpAlgorithm>::ReportUlCqiInfo (378,546 samples, 0.04%)
std::__invoke_result<void (5,321,712 samples, 0.55%)
ns3::Ptr<ns3::SpectrumValue>::~Ptr (165,191 samples, 0.02%)
[ld-linux-x86-64.so.2] (280,175 samples, 0.03%)
std::_Rb_tree_iterator<std::pair<ns3::Scheduler::EventKey const, ns3::EventImpl*> > std::map<ns3::Scheduler::EventKey, ns3::EventImpl*, std::less<ns3::Scheduler::EventKey>, std::allocator<std::pair<ns3::Scheduler::EventKey const, ns3::EventImpl*> > >::emplace_hint<std::pair<ns3::Scheduler::EventKey, ns3::EventImpl*> > (538,288 samples, 0.06%)
std::vector<unsigned short, std::allocator<unsigned short> >::operator= (156,275 samples, 0.02%)
ns3::TypeId::TypeId (163,126 samples, 0.02%)
ns3::HarqProcessInfoElement_t* std::__copy_move_a2<false, ns3::HarqProcessInfoElement_t const*, ns3::HarqProcessInfoElement_t*> (363,923 samples, 0.04%)
int* std::__copy_move_a1<false, int*, int*> (153,996 samples, 0.02%)
std::_Rb_tree_node<std::pair<unsigned short const, std::vector<double, std::allocator<double> > > >* std::_Rb_tree<unsigned short, std::pair<unsigned short const, std::vector<double, std::allocator<double> > >, std::_Select1st<std::pair<unsigned short const, std::vector<double, std::allocator<double> > > >, std::less<unsigned short>, std::allocator<std::pair<unsigned short const, std::vector<double, std::allocator<double> > > > >::_Alloc_node::operator (3,608,007 samples, 0.37%)
[libm.so.6] (271,870 samples, 0.03%)
std::less<unsigned short>::operator (156,875 samples, 0.02%)
std::_Head_base<4ul, ns3::Ptr<ns3::SpectrumPhy>, false>::_M_head (197,720 samples, 0.02%)
std::vector<double, std::allocator<double> >::operator= (165,413 samples, 0.02%)
std::_Tuple_impl<0ul, ns3::MultiModelSpectrumChannel*, ns3::Ptr<ns3::SpectrumValue>, double, ns3::Ptr<ns3::SpectrumSignalParameters>, ns3::Ptr<ns3::SpectrumPhy>, std::map<unsigned int, ns3::Ptr<ns3::SpectrumValue>, std::less<unsigned int>, std::allocator<std::pair<unsigned int const, ns3::Ptr<ns3::SpectrumValue> > > > >::_Tuple_impl<ns3::MultiModelSpectrumChannel*&, ns3::Ptr<ns3::SpectrumValue>&, double&, ns3::Ptr<ns3::SpectrumSignalParameters>&, ns3::Ptr<ns3::SpectrumPhy>&, std::map<unsigned int, ns3::Ptr<ns3::SpectrumValue>, std::less<unsigned int>, std::allocator<std::pair<unsigned int const, ns3::Ptr<ns3::SpectrumValue> > > >&, void> (714,235 samples, 0.07%)
ns3::Simulator::Run (2,105,662 samples, 0.22%)
std::allocator_traits<std::allocator<std::_List_node<ns3::Ptr<ns3::PacketBurst> > > >::allocate (428,661 samples, 0.04%)
std::_Rb_tree<unsigned short, std::pair<unsigned short const, std::vector<unsigned char, std::allocator<unsigned char> > >, std::_Select1st<std::pair<unsigned short const, std::vector<unsigned char, std::allocator<unsigned char> > > >, std::less<unsigned short>, std::allocator<std::pair<unsigned short const, std::vector<unsigned char, std::allocator<unsigned char> > > > >::find (277,435 samples, 0.03%)
ns3::DlInfoListElement_s::HarqStatus_e* std::__uninitialized_copy<true>::__uninit_copy<__gnu_cxx::__normal_iterator<ns3::DlInfoListElement_s::HarqStatus_e const*, std::vector<ns3::DlInfoListElement_s::HarqStatus_e, std::allocator<ns3::DlInfoListElement_s::HarqStatus_e> > >, ns3::DlInfoListElement_s::HarqStatus_e*> (147,743 samples, 0.02%)
ns3::ObjectBase::ObjectBase (222,732 samples, 0.02%)
std::enable_if<is_invocable_r_v<void, ns3::Callback<void, ns3::SpectrumValue const&>::Callback<void (324,769 samples, 0.03%)
std::vector<int, std::allocator<int> >::_S_relocate (230,884 samples, 0.02%)
ns3::LteEnbPhy::StartFrame (415,834 samples, 0.04%)
std::vector<bool, std::allocator<bool> >::insert (572,036 samples, 0.06%)
ns3::Time::GetSeconds (495,841 samples, 0.05%)
std::_Vector_base<ns3::VendorSpecificListElement_s, std::allocator<ns3::VendorSpecificListElement_s> >::_Vector_impl::_Vector_impl (272,688 samples, 0.03%)
ns3::DlInfoListElement_s::HarqStatus_e* std::__copy_move<false, true, std::random_access_iterator_tag>::__copy_m<ns3::DlInfoListElement_s::HarqStatus_e const, ns3::DlInfoListElement_s::HarqStatus_e> (593,050 samples, 0.06%)
unsigned short* std::__copy_move_a<false, __gnu_cxx::__normal_iterator<unsigned short const*, std::vector<unsigned short, std::allocator<unsigned short> > >, unsigned short*> (485,137 samples, 0.05%)
std::map<unsigned char, ns3::LteUeMac::LcInfo, std::less<unsigned char>, std::allocator<std::pair<unsigned char const, ns3::LteUeMac::LcInfo> > >::find (1,135,998 samples, 0.12%)
std::_Vector_base<ns3::HarqProcessInfoElement_t, std::allocator<ns3::HarqProcessInfoElement_t> >::_Vector_base (198,899 samples, 0.02%)
ns3::SpectrumValue::operator[] (316,514 samples, 0.03%)
ns3::Ptr<ns3::SpectrumValue> ns3::Create<ns3::SpectrumValue, ns3::SpectrumValue const&> (186,604 samples, 0.02%)
std::vector<double, std::allocator<double> >::operator= (345,577 samples, 0.04%)
ns3::SpectrumValue::Subtract (2,558,547 samples, 0.26%)
ns3::PacketBurst::~PacketBurst (1,132,572 samples, 0.12%)
ns3::SimpleRefCount<ns3::Packet, ns3::Empty, ns3::DefaultDeleter<ns3::Packet> >::SimpleRefCount (246,179 samples, 0.03%)
ns3::HigherLayerSelected_s* std::uninitialized_copy<__gnu_cxx::__normal_iterator<ns3::HigherLayerSelected_s const*, std::vector<ns3::HigherLayerSelected_s, std::allocator<ns3::HigherLayerSelected_s> > >, ns3::HigherLayerSelected_s*> (356,634 samples, 0.04%)
ns3::ObjectBase::ObjectBase (229,496 samples, 0.02%)
void std::allocator_traits<std::allocator<std::_List_node<ns3::Ptr<ns3::LteControlMessage> > > >::construct<ns3::Ptr<ns3::LteControlMessage>, ns3::Ptr<ns3::LteControlMessage> const&> (353,605 samples, 0.04%)
std::pair<unsigned short, ns3::DlInfoListElement_s>::pair<unsigned short&, ns3::DlInfoListElement_s&> (647,715 samples, 0.07%)
std::_Vector_base<unsigned char, std::allocator<unsigned char> >::_Vector_impl::_Vector_impl (200,380 samples, 0.02%)
ns3::PacketBurst::DoDispose (3,367,904 samples, 0.35%)
__gnu_cxx::__aligned_membuf<std::pair<unsigned short const, ns3::LteEnbComponentCarrierManager::UeInfo> >::_M_ptr (208,839 samples, 0.02%)
ns3::Ptr<ns3::Object>::~Ptr (152,955 samples, 0.02%)
void std::_Destroy<__gnu_cxx::__normal_iterator<ns3::VendorSpecificListElement_s*, std::vector<ns3::VendorSpecificListElement_s, std::allocator<ns3::VendorSpecificListElement_s> > >, ns3::VendorSpecificListElement_s> (317,071 samples, 0.03%)
std::vector<int, std::allocator<int> >::~vector (782,981 samples, 0.08%)
ns3::Ptr<ns3::DlCqiLteControlMessage> ns3::Create<ns3::DlCqiLteControlMessage> (1,129,510 samples, 0.12%)
std::_Vector_base<ns3::BuildDataListElement_s, std::allocator<ns3::BuildDataListElement_s> >::_Vector_impl::_Vector_impl (271,168 samples, 0.03%)
std::_Rb_tree<unsigned char, std::pair<unsigned char const, ns3::LteMacSapProvider*>, std::_Select1st<std::pair<unsigned char const, ns3::LteMacSapProvider*> >, std::less<unsigned char>, std::allocator<std::pair<unsigned char const, ns3::LteMacSapProvider*> > >::find (393,630 samples, 0.04%)
std::__cxx11::list<ns3::AttributeConstructionList::Item, std::allocator<ns3::AttributeConstructionList::Item> >::list (1,123,852 samples, 0.12%)
std::vector<ns3::ByteTagListData*, std::allocator<ns3::ByteTagListData*> >::back (511,487 samples, 0.05%)
void std::destroy_at<ns3::Ptr<ns3::Packet> > (392,648 samples, 0.04%)
std::_Rb_tree<unsigned int, std::pair<unsigned int const, ns3::Ptr<ns3::SpectrumValue> >, std::_Select1st<std::pair<unsigned int const, ns3::Ptr<ns3::SpectrumValue> > >, std::less<unsigned int>, std::allocator<std::pair<unsigned int const, ns3::Ptr<ns3::SpectrumValue> > > >::_Auto_node::_Auto_node<unsigned int const&, ns3::Ptr<ns3::SpectrumValue>&> (925,680 samples, 0.10%)
std::function<void (856,730 samples, 0.09%)
std::__allocated_ptr<std::allocator<std::_List_node<ns3::Ptr<ns3::PacketBurst> > > >::__allocated_ptr (363,344 samples, 0.04%)
std::vector<unsigned char, std::allocator<unsigned char> >::operator= (946,469 samples, 0.10%)
ns3::LteRadioBearerTag::LteRadioBearerTag (235,722 samples, 0.02%)
std::pair<unsigned short const, std::vector<double, std::allocator<double> > >::pair (194,069 samples, 0.02%)
std::_Rb_tree_node<std::pair<ns3::TbId_t const, ns3::tbInfo_t> >::_M_valptr (245,098 samples, 0.03%)
ns3::RlcTag::GetInstanceTypeId (165,086 samples, 0.02%)
ns3::Object::DoDelete (1,796,083 samples, 0.19%)
std::allocator<std::_Rb_tree_node<std::pair<ns3::Scheduler::EventKey const, ns3::EventImpl*> > >::allocate (195,540 samples, 0.02%)
ns3::Ptr<ns3::PacketBurst> ns3::CreateObject<ns3::PacketBurst> (5,924,813 samples, 0.61%)
void std::vector<int, std::allocator<int> >::_M_realloc_insert<int> (917,956 samples, 0.09%)
std::__cxx11::_List_base<ns3::Ptr<ns3::LteControlMessage>, std::allocator<ns3::Ptr<ns3::LteControlMessage> > >::_M_clear (271,061 samples, 0.03%)
decltype (338,177 samples, 0.03%)
std::_Rb_tree_const_iterator<std::pair<unsigned int const, ns3::Ptr<ns3::SpectrumValue> > >::_Rb_tree_const_iterator (163,290 samples, 0.02%)
std::_Tuple_impl<1ul, ns3::Ptr<ns3::SpectrumValue>, double, ns3::Ptr<ns3::SpectrumSignalParameters>, ns3::Ptr<ns3::SpectrumPhy>, std::map<unsigned int, ns3::Ptr<ns3::SpectrumValue>, std::less<unsigned int>, std::allocator<std::pair<unsigned int const, ns3::Ptr<ns3::SpectrumValue> > > > >::_Tuple_impl (589,946 samples, 0.06%)
std::_Rb_tree_node<std::pair<unsigned int const, ns3::Ptr<ns3::SpectrumValue> > >* std::_Rb_tree<unsigned int, std::pair<unsigned int const, ns3::Ptr<ns3::SpectrumValue> >, std::_Select1st<std::pair<unsigned int const, ns3::Ptr<ns3::SpectrumValue> > >, std::less<unsigned int>, std::allocator<std::pair<unsigned int const, ns3::Ptr<ns3::SpectrumValue> > > >::_M_copy<false, std::_Rb_tree<unsigned int, std::pair<unsigned int const, ns3::Ptr<ns3::SpectrumValue> >, std::_Select1st<std::pair<unsigned int const, ns3::Ptr<ns3::SpectrumValue> > >, std::less<unsigned int>, std::allocator<std::pair<unsigned int const, ns3::Ptr<ns3::SpectrumValue> > > >::_Alloc_node> (326,142 samples, 0.03%)
ns3::HigherLayerSelected_s* std::__copy_move_a1<false, ns3::HigherLayerSelected_s const*, ns3::HigherLayerSelected_s*> (231,948 samples, 0.02%)
std::vector<double, std::allocator<double> >::end (316,703 samples, 0.03%)
(233,577 samples, 0.02%)
ns3::Scheduler::EventKey&& std::forward<ns3::Scheduler::EventKey> (159,059 samples, 0.02%)
std::_Vector_base<ns3::BuildBroadcastListElement_s, std::allocator<ns3::BuildBroadcastListElement_s> >::_M_create_storage (276,341 samples, 0.03%)
ns3::DlInfoListElement_s::DlInfoListElement_s (1,840,989 samples, 0.19%)
ns3::FfMacSchedSapProvider::SchedUlMacCtrlInfoReqParameters::~SchedUlMacCtrlInfoReqParameters (274,453 samples, 0.03%)
std::_Tuple_impl<0ul, ns3::MultiModelSpectrumChannel*, ns3::Ptr<ns3::SpectrumValue>, double, ns3::Ptr<ns3::SpectrumSignalParameters>, ns3::Ptr<ns3::SpectrumPhy>, std::map<unsigned int, ns3::Ptr<ns3::SpectrumValue>, std::less<unsigned int>, std::allocator<std::pair<unsigned int const, ns3::Ptr<ns3::SpectrumValue> > > > >::_Tuple_impl (411,266 samples, 0.04%)
ns3::LteFrNoOpAlgorithm::DoReportUlCqiInfo (261,636 samples, 0.03%)
std::_Tuple_impl<3ul, ns3::Ptr<ns3::SpectrumSignalParameters>, ns3::Ptr<ns3::SpectrumPhy>, std::map<unsigned int, ns3::Ptr<ns3::SpectrumValue>, std::less<unsigned int>, std::allocator<std::pair<unsigned int const, ns3::Ptr<ns3::SpectrumValue> > > > >::_Tuple_impl (326,828 samples, 0.03%)
ns3::SimpleRefCount<ns3::SpectrumValue, ns3::Empty, ns3::DefaultDeleter<ns3::SpectrumValue> >::Unref (235,829 samples, 0.02%)
std::__cxx11::list<ns3::UlDciLteControlMessage, std::allocator<ns3::UlDciLteControlMessage> >::list (480,104 samples, 0.05%)
std::_Rb_tree_node_base*& std::forward<std::_Rb_tree_node_base*&> (209,016 samples, 0.02%)
ns3::LteSpectrumPhy::GetRxSpectrumModel (176,892 samples, 0.02%)
ns3::Packet::GetByteTagIterator (1,295,465 samples, 0.13%)
ns3::MacCeListElement_s::MacCeListElement_s (339,065 samples, 0.03%)
std::operator== (124,937 samples, 0.01%)
pow (310,695 samples, 0.03%)
std::vector<int, std::allocator<int> >::push_back (148,897 samples, 0.02%)
ns3::Ptr<ns3::PacketBurst> ns3::CompleteConstruct<ns3::PacketBurst> (5,277,768 samples, 0.54%)
std::less<ns3::Scheduler::EventKey>::operator (414,791 samples, 0.04%)
cfree (124,845 samples, 0.01%)
ns3::Ptr<ns3::PacketBurst>::~Ptr (1,777,558 samples, 0.18%)
std::_Bind<void (1,437,343 samples, 0.15%)
ns3::Callback<void, std::__cxx11::list<ns3::Ptr<ns3::LteControlMessage>, std::allocator<ns3::Ptr<ns3::LteControlMessage> > > >::operator (75,636,826 samples, 7.80%) ns3::C..
ns3::LteFrNoOpAlgorithm::DoGetAvailableDlRbg (848,072 samples, 0.09%)
ns3::LteRlcSpecificLteMacSapUser::ReceivePdu (1,587,883 samples, 0.16%)
ns3::SpectrumValue::~SpectrumValue (390,089 samples, 0.04%)
std::vector<double, std::allocator<double> >::operator[] (186,851 samples, 0.02%)
std::_Rb_tree_iterator<std::pair<unsigned short const, std::vector<std::vector<ns3::HarqProcessInfoElement_t, std::allocator<ns3::HarqProcessInfoElement_t> >, std::allocator<std::vector<ns3::HarqProcessInfoElement_t, std::allocator<ns3::HarqProcessInfoElement_t> > > > > >::_Rb_tree_iterator (160,302 samples, 0.02%)
ns3::PacketTagList::PacketTagList (222,450 samples, 0.02%)
ns3::ObjectDeleter::Delete (238,924 samples, 0.02%)
std::vector<unsigned char, std::allocator<unsigned char> >::at (196,396 samples, 0.02%)
std::_Rb_tree_iterator<std::pair<unsigned int const, ns3::Ptr<ns3::SpectrumValue> > > std::map<unsigned int, ns3::Ptr<ns3::SpectrumValue>, std::less<unsigned int>, std::allocator<std::pair<unsigned int const, ns3::Ptr<ns3::SpectrumValue> > > >::emplace_hint<unsigned int const&, ns3::Ptr<ns3::SpectrumValue>&> (1,489,049 samples, 0.15%)
std::_Vector_base<unsigned char, std::allocator<unsigned char> >::_Vector_impl::~_Vector_impl (125,125 samples, 0.01%)
ns3::Ptr<ns3::SpectrumPhy>::~Ptr (200,126 samples, 0.02%)
std::__cxx11::list<ns3::Ptr<ns3::LteControlMessage>, std::allocator<ns3::Ptr<ns3::LteControlMessage> > >::~list (578,265 samples, 0.06%)
std::enable_if<std::is_constructible<std::pair<ns3::Scheduler::EventKey const, ns3::EventImpl*>, std::pair<ns3::Scheduler::EventKey, ns3::EventImpl*> >::value, std::pair<std::_Rb_tree_iterator<std::pair<ns3::Scheduler::EventKey const, ns3::EventImpl*> >, bool> >::type std::map<ns3::Scheduler::EventKey, ns3::EventImpl*, std::less<ns3::Scheduler::EventKey>, std::allocator<std::pair<ns3::Scheduler::EventKey const, ns3::EventImpl*> > >::insert<std::pair<ns3::Scheduler::EventKey, ns3::EventImpl*> > (932,942 samples, 0.10%)
std::map<unsigned short, ns3::LteUePhy::UeMeasurementsElement, std::less<unsigned short>, std::allocator<std::pair<unsigned short const, ns3::LteUePhy::UeMeasurementsElement> > >::find (242,538 samples, 0.03%)
ns3::DefaultSimulatorImpl::Run (22,443,594 samples, 2.31%)
operator new (201,409 samples, 0.02%)
ns3::LteUePhy*& std::_Mu<ns3::LteUePhy*, false, false>::operator (226,205 samples, 0.02%)
std::__cxx11::list<ns3::Ptr<ns3::LteControlMessage>, std::allocator<ns3::Ptr<ns3::LteControlMessage> > >* std::__copy_move_a2<true, std::__cxx11::list<ns3::Ptr<ns3::LteControlMessage>, std::allocator<ns3::Ptr<ns3::LteControlMessage> > >*, std::__cxx11::list<ns3::Ptr<ns3::LteControlMessage>, std::allocator<ns3::Ptr<ns3::LteControlMessage> > >*> (154,567 samples, 0.02%)
std::_Rb_tree<ns3::Scheduler::EventKey, std::pair<ns3::Scheduler::EventKey const, ns3::EventImpl*>, std::_Select1st<std::pair<ns3::Scheduler::EventKey const, ns3::EventImpl*> >, std::less<ns3::Scheduler::EventKey>, std::allocator<std::pair<ns3::Scheduler::EventKey const, ns3::EventImpl*> > >::key_comp (125,297 samples, 0.01%)
std::vector<ns3::Ptr<ns3::PacketBurst>, std::allocator<ns3::Ptr<ns3::PacketBurst> > >::_M_erase (2,288,506 samples, 0.24%)
ns3::Ptr<ns3::LteControlMessage>& std::__cxx11::list<ns3::Ptr<ns3::LteControlMessage>, std::allocator<ns3::Ptr<ns3::LteControlMessage> > >::emplace_back<ns3::Ptr<ns3::LteControlMessage> const&> (919,396 samples, 0.09%)
operator new (156,584 samples, 0.02%)
ns3::Ptr<ns3::LteSpectrumSignalParametersDlCtrlFrame>::operator (168,179 samples, 0.02%)
std::vector<unsigned char, std::allocator<unsigned char> > const* std::__addressof<std::vector<unsigned char, std::allocator<unsigned char> > const> (186,584 samples, 0.02%)
void std::destroy_at<ns3::DlInfoListElement_s> (652,447 samples, 0.07%)
std::_Rb_tree<unsigned int, std::pair<unsigned int const, ns3::Ptr<ns3::SpectrumValue> >, std::_Select1st<std::pair<unsigned int const, ns3::Ptr<ns3::SpectrumValue> > >, std::less<unsigned int>, std::allocator<std::pair<unsigned int const, ns3::Ptr<ns3::SpectrumValue> > > >::_Rb_tree_impl<std::less<unsigned int>, true>::_Rb_tree_impl (236,125 samples, 0.02%)
(160,485 samples, 0.02%)
ns3::MacCeListElement_s::~MacCeListElement_s (599,086 samples, 0.06%)
ns3::DefaultDeleter<ns3::SpectrumSignalParameters>::Delete (2,421,676 samples, 0.25%)
ns3::LteUePhy::PhyPduReceived (4,557,849 samples, 0.47%)
void (200,340 samples, 0.02%)
std::__new_allocator<double>::allocate (490,258 samples, 0.05%)
std::__detail::_List_node_header::_M_init (156,589 samples, 0.02%)
ns3::Ptr<ns3::PacketBurst>::operator= (5,201,507 samples, 0.54%)
std::_Rb_tree<ns3::TbId_t, std::pair<ns3::TbId_t const, ns3::tbInfo_t>, std::_Select1st<std::pair<ns3::TbId_t const, ns3::tbInfo_t> >, std::less<ns3::TbId_t>, std::allocator<std::pair<ns3::TbId_t const, ns3::tbInfo_t> > >::_M_erase (270,189 samples, 0.03%)
ns3::SimpleUeCcmMacSapUser::ReceivePdu (2,333,945 samples, 0.24%)
std::_Rb_tree<unsigned short, std::pair<unsigned short const, unsigned char>, std::_Select1st<std::pair<unsigned short const, unsigned char> >, std::less<unsigned short>, std::allocator<std::pair<unsigned short const, unsigned char> > >::_S_key (312,442 samples, 0.03%)
void std::_Bind<void (884,239,690 samples, 91.18%) void std::_Bind<void
std::__cxx11::list<ns3::Ptr<ns3::LteControlMessage>, std::allocator<ns3::Ptr<ns3::LteControlMessage> > >* std::__copy_move<true, false, std::random_access_iterator_tag>::__copy_m<std::__cxx11::list<ns3::Ptr<ns3::LteControlMessage>, std::allocator<ns3::Ptr<ns3::LteControlMessage> > >*, std::__cxx11::list<ns3::Ptr<ns3::LteControlMessage>, std::allocator<ns3::Ptr<ns3::LteControlMessage> > >*> (1,074,226 samples, 0.11%)
std::_Vector_base<ns3::DlInfoListElement_s, std::allocator<ns3::DlInfoListElement_s> >::_Vector_base (431,145 samples, 0.04%)
std::__new_allocator<std::_List_node<ns3::Ptr<ns3::LteControlMessage> > >::allocate (143,335 samples, 0.01%)
ns3::EventImpl::EventImpl (158,256 samples, 0.02%)
ns3::LteControlMessage::LteControlMessage (271,693 samples, 0.03%)
std::vector<ns3::RlcPduListElement_s, std::allocator<ns3::RlcPduListElement_s> >::push_back (148,059 samples, 0.02%)
__gnu_cxx::__normal_iterator<double*, std::vector<double, std::allocator<double> > >::operator* (233,448 samples, 0.02%)
std::tuple<unsigned short const&>::tuple (200,653 samples, 0.02%)
std::vector<std::vector<ns3::RlcPduListElement_s, std::allocator<ns3::RlcPduListElement_s> >, std::allocator<std::vector<ns3::RlcPduListElement_s, std::allocator<ns3::RlcPduListElement_s> > > >::~vector (399,447 samples, 0.04%)
std::_Vector_base<unsigned char, std::allocator<unsigned char> >::_Vector_base (125,411 samples, 0.01%)
ns3::DefaultDeleter<ns3::SpectrumSignalParameters>::Delete (233,861 samples, 0.02%)
std::_Tuple_impl<1ul, ns3::Ptr<ns3::SpectrumValue>, double, ns3::Ptr<ns3::SpectrumSignalParameters>, ns3::Ptr<ns3::SpectrumPhy>, std::map<unsigned int, ns3::Ptr<ns3::SpectrumValue>, std::less<unsigned int>, std::allocator<std::pair<unsigned int const, ns3::Ptr<ns3::SpectrumValue> > > > >::_Tuple_impl (368,770 samples, 0.04%)
std::__detail::_List_node_header::_List_node_header (309,432 samples, 0.03%)
std::_Rb_tree<int, std::pair<int const, double>, std::_Select1st<std::pair<int const, double> >, std::less<int>, std::allocator<std::pair<int const, double> > >::_Auto_node::_M_insert (233,734 samples, 0.02%)
ns3::LteSpectrumPhy::GetAntenna (524,985 samples, 0.05%)
std::operator== (467,378 samples, 0.05%)
std::vector<ns3::CqiListElement_s, std::allocator<ns3::CqiListElement_s> >::_M_erase (1,008,706 samples, 0.10%)
ns3::BuildRarListElement_s* std::__uninitialized_copy<false>::__uninit_copy<__gnu_cxx::__normal_iterator<ns3::BuildRarListElement_s const*, std::vector<ns3::BuildRarListElement_s, std::allocator<ns3::BuildRarListElement_s> > >, ns3::BuildRarListElement_s*> (198,569 samples, 0.02%)
std::__cxx11::list<ns3::Ptr<ns3::LteControlMessage>, std::allocator<ns3::Ptr<ns3::LteControlMessage> > >* std::__copy_move_a2<true, std::__cxx11::list<ns3::Ptr<ns3::LteControlMessage>, std::allocator<ns3::Ptr<ns3::LteControlMessage> > >*, std::__cxx11::list<ns3::Ptr<ns3::LteControlMessage>, std::allocator<ns3::Ptr<ns3::LteControlMessage> > >*> (1,149,860 samples, 0.12%)
unsigned short* std::__copy_move_a<true, unsigned short*, unsigned short*> (251,127 samples, 0.03%)
ns3::GetImpl (158,305 samples, 0.02%)
std::__new_allocator<ns3::DlInfoListElement_s::HarqStatus_e>::deallocate (152,095 samples, 0.02%)
std::_Vector_base<ns3::Ptr<ns3::Object>, std::allocator<ns3::Ptr<ns3::Object> > >::_Vector_impl::_Vector_impl (391,527 samples, 0.04%)
ns3::TracedCallback<unsigned short, ns3::Ptr<ns3::SpectrumValue> >::operator (569,042 samples, 0.06%)
ns3::MacCeListElement_s::MacCeListElement_s (153,635 samples, 0.02%)
std::vector<ns3::Ptr<ns3::PacketBurst>, std::allocator<ns3::Ptr<ns3::PacketBurst> > >::back (388,694 samples, 0.04%)
ns3::HarqProcessInfoElement_t* std::copy<__gnu_cxx::__normal_iterator<ns3::HarqProcessInfoElement_t const*, std::vector<ns3::HarqProcessInfoElement_t, std::allocator<ns3::HarqProcessInfoElement_t> > >, ns3::HarqProcessInfoElement_t*> (334,764 samples, 0.03%)
ns3::Ptr<ns3::SpectrumValue> ns3::Create<ns3::SpectrumValue, ns3::Ptr<ns3::SpectrumModel>&> (650,459 samples, 0.07%)
ns3::Ptr<ns3::PacketBurst>& std::vector<ns3::Ptr<ns3::PacketBurst>, std::allocator<ns3::Ptr<ns3::PacketBurst> > >::emplace_back<ns3::Ptr<ns3::PacketBurst> > (551,584 samples, 0.06%)
std::vector<ns3::Ptr<ns3::Object>, std::allocator<ns3::Ptr<ns3::Object> > >::_M_erase_at_end (127,447 samples, 0.01%)
ns3::MemberLteCcmMacSapUser<ns3::NoOpComponentCarrierManager>::ReceivePdu (7,833,319 samples, 0.81%)
ns3::VendorSpecificListElement_s const* std::__niter_base<ns3::VendorSpecificListElement_s const*, std::vector<ns3::VendorSpecificListElement_s, std::allocator<ns3::VendorSpecificListElement_s> > > (192,328 samples, 0.02%)
ns3::Ptr<ns3::PacketBurst>::Ptr (156,542 samples, 0.02%)
void std::allocator_traits<std::allocator<std::_List_node<ns3::Ptr<ns3::Packet> > > >::destroy<ns3::Ptr<ns3::Packet> > (142,224 samples, 0.01%)
ns3::Ptr<ns3::Object>::Acquire (269,784 samples, 0.03%)
std::_Vector_base<double, std::allocator<double> >::~_Vector_base (357,028 samples, 0.04%)
std::vector<unsigned char, std::allocator<unsigned char> >::operator= (1,336,444 samples, 0.14%)
ns3::Ptr<ns3::AntennaModel>::Ptr (201,269 samples, 0.02%)
__gnu_cxx::__normal_iterator<ns3::Ptr<ns3::PacketBurst> const*, std::vector<ns3::Ptr<ns3::PacketBurst>, std::allocator<ns3::Ptr<ns3::PacketBurst> > > >::difference_type __gnu_cxx::operator-<ns3::Ptr<ns3::PacketBurst> const*, std::vector<ns3::Ptr<ns3::PacketBurst>, std::allocator<ns3::Ptr<ns3::PacketBurst> > > > (278,789 samples, 0.03%)
std::map<unsigned char, ns3::LteMacSapProvider::ReportBufferStatusParameters, std::less<unsigned char>, std::allocator<std::pair<unsigned char const, ns3::LteMacSapProvider::ReportBufferStatusParameters> > >::find (1,503,084 samples, 0.15%)
std::tuple_element<1ul, std::tuple<double const&, double const&, double const&> >::type const& std::get<1ul, double const&, double const&, double const&> (407,082 samples, 0.04%)
std::_Rb_tree<unsigned char, std::pair<unsigned char const, ns3::LteMacSapUser*>, std::_Select1st<std::pair<unsigned char const, ns3::LteMacSapUser*> >, std::less<unsigned char>, std::allocator<std::pair<unsigned char const, ns3::LteMacSapUser*> > >::find (1,766,493 samples, 0.18%)
ns3::Ptr<ns3::Packet>::Acquire (154,647 samples, 0.02%)
void (614,254 samples, 0.06%)
std::modf (232,865 samples, 0.02%)
ns3::int64x64_t::MulByInvert (163,855 samples, 0.02%)
[ld-linux-x86-64.so.2] (1,432,110 samples, 0.15%)
std::vector<ns3::CqiListElement_s, std::allocator<ns3::CqiListElement_s> >::erase (456,537 samples, 0.05%)
void std::_Destroy<ns3::FfMacSchedSapProvider::SchedUlCqiInfoReqParameters*> (1,058,935 samples, 0.11%)
exit (155,299 samples, 0.02%)
ns3::Buffer::~Buffer (206,160 samples, 0.02%)
std::__allocated_ptr<std::allocator<std::_List_node<ns3::Ptr<ns3::Packet> > > >::operator= (147,762 samples, 0.02%)
std::_Vector_base<unsigned int, std::allocator<unsigned int> >::_M_allocate (191,041 samples, 0.02%)
ns3::ObjectDeleter::Delete (3,074,446 samples, 0.32%)
ns3::Time::ToDouble (1,825,393 samples, 0.19%)
__gnu_cxx::__aligned_membuf<std::pair<unsigned char const, ns3::LteCcmMacSapProvider*> >::_M_ptr (243,580 samples, 0.03%)
std::vector<double, std::allocator<double> >::operator= (1,599,149 samples, 0.16%)
std::_Rb_tree<unsigned int, std::pair<unsigned int const, ns3::TxSpectrumModelInfo>, std::_Select1st<std::pair<unsigned int const, ns3::TxSpectrumModelInfo> >, std::less<unsigned int>, std::allocator<std::pair<unsigned int const, ns3::TxSpectrumModelInfo> > >::find (1,126,228 samples, 0.12%)
ns3::PacketTagList::PacketTagList (159,488 samples, 0.02%)
std::_Rb_tree<unsigned short, std::pair<unsigned short const, std::vector<ns3::UlDciListElement_s, std::allocator<ns3::UlDciListElement_s> > >, std::_Select1st<std::pair<unsigned short const, std::vector<ns3::UlDciListElement_s, std::allocator<ns3::UlDciListElement_s> > > >, std::less<unsigned short>, std::allocator<std::pair<unsigned short const, std::vector<ns3::UlDciListElement_s, std::allocator<ns3::UlDciListElement_s> > > > >::_M_mbegin (155,860 samples, 0.02%)
std::_Rb_tree_node<std::pair<ns3::TbId_t const, ns3::tbInfo_t> >* std::_Rb_tree<ns3::TbId_t, std::pair<ns3::TbId_t const, ns3::tbInfo_t>, std::_Select1st<std::pair<ns3::TbId_t const, ns3::tbInfo_t> >, std::less<ns3::TbId_t>, std::allocator<std::pair<ns3::TbId_t const, ns3::tbInfo_t> > >::_M_create_node<std::pair<ns3::TbId_t, ns3::tbInfo_t> > (1,386,943 samples, 0.14%)
ns3::PfFfMacScheduler::DoSchedUlCqiInfoReq (821,265 samples, 0.08%)
std::vector<unsigned char, std::allocator<unsigned char> >::~vector (199,813 samples, 0.02%)
void std::_Construct<ns3::DlInfoListElement_s, ns3::DlInfoListElement_s const&> (4,273,011 samples, 0.44%)
void std::__invoke_impl<void, std::_Bind<void (5,321,712 samples, 0.55%)
std::_Rb_tree<unsigned short, std::pair<unsigned short const, ns3::SbMeasResult_s>, std::_Select1st<std::pair<unsigned short const, ns3::SbMeasResult_s> >, std::less<unsigned short>, std::allocator<std::pair<unsigned short const, ns3::SbMeasResult_s> > >::_M_lower_bound (228,291 samples, 0.02%)
void std::vector<unsigned char, std::allocator<unsigned char> >::_M_realloc_insert<unsigned char> (1,385,167 samples, 0.14%)
ns3::Time::Time (156,551 samples, 0.02%)
std::_Vector_base<int, std::allocator<int> >::_Vector_base (427,278 samples, 0.04%)
void std::allocator_traits<std::allocator<std::vector<ns3::RlcPduListElement_s, std::allocator<ns3::RlcPduListElement_s> > > >::construct<std::vector<ns3::RlcPduListElement_s, std::allocator<ns3::RlcPduListElement_s> >, std::vector<ns3::RlcPduListElement_s, std::allocator<ns3::RlcPduListElement_s> > const&> (252,039 samples, 0.03%)
ns3::SimpleRefCount<ns3::LteControlMessage, ns3::Empty, ns3::DefaultDeleter<ns3::LteControlMessage> >::Ref (330,055 samples, 0.03%)
std::vector<ns3::Buffer::Data*, std::allocator<ns3::Buffer::Data*> >::pop_back (158,310 samples, 0.02%)
std::__cxx11::_List_base<ns3::AttributeConstructionList::Item, std::allocator<ns3::AttributeConstructionList::Item> >::_M_clear (124,335 samples, 0.01%)
void std::allocator_traits<std::allocator<signed char> >::construct<signed char, signed char> (169,019 samples, 0.02%)
_start (923,730,017 samples, 95.25%) _start
std::vector<double, std::allocator<double> >::operator[] (196,931 samples, 0.02%)
std::_Function_base::_M_empty (150,383 samples, 0.02%)
std::__cxx11::list<ns3::Callback<void, unsigned short, ns3::Ptr<ns3::SpectrumValue> >, std::allocator<ns3::Callback<void, unsigned short, ns3::Ptr<ns3::SpectrumValue> > > >::begin (240,498 samples, 0.02%)
void std::__invoke_impl<void, void (833,626 samples, 0.09%)
std::map<unsigned char, ns3::LteMacSapProvider*, std::less<unsigned char>, std::allocator<std::pair<unsigned char const, ns3::LteMacSapProvider*> > >::find (306,410 samples, 0.03%)
std::vector<ns3::RlcPduListElement_s, std::allocator<ns3::RlcPduListElement_s> >::push_back (1,103,607 samples, 0.11%)
ns3::Ptr<ns3::Packet> ns3::Create<ns3::Packet, unsigned int&> (5,253,542 samples, 0.54%)
__gnu_cxx::__aligned_membuf<std::pair<ns3::LteSpectrumModelId const, ns3::Ptr<ns3::SpectrumModel> > >::_M_ptr (158,837 samples, 0.02%)
std::vector<ns3::UlDciListElement_s, std::allocator<ns3::UlDciListElement_s> >::max_size (276,398 samples, 0.03%)
std::_Vector_base<ns3::HarqProcessInfoElement_t, std::allocator<ns3::HarqProcessInfoElement_t> >::_M_get_Tp_allocator (314,467 samples, 0.03%)
ns3::LteEnbRrc::AddUe (285,958 samples, 0.03%)
std::_Bvector_base<std::allocator<bool> >::_Bvector_impl_data::_M_reset (156,996 samples, 0.02%)
ns3::HarqProcessInfoElement_t* std::__niter_wrap<ns3::HarqProcessInfoElement_t*> (274,590 samples, 0.03%)
ns3::DlInfoListElement_s::HarqStatus_e* std::__copy_move_a2<false, ns3::DlInfoListElement_s::HarqStatus_e const*, ns3::DlInfoListElement_s::HarqStatus_e*> (158,174 samples, 0.02%)
std::vector<bool, std::allocator<bool> >::_M_copy_aligned (653,505 samples, 0.07%)
__gnu_cxx::__normal_iterator<double const*, std::vector<double, std::allocator<double> > >::__normal_iterator (126,951 samples, 0.01%)
ns3::Ptr<ns3::Packet>::operator bool (157,451 samples, 0.02%)
ns3::DefaultDeleter<ns3::SpectrumValue>::Delete (362,265 samples, 0.04%)
ns3::UlDciListElement_s* std::__uninitialized_copy_a<__gnu_cxx::__normal_iterator<ns3::UlDciListElement_s const*, std::vector<ns3::UlDciListElement_s, std::allocator<ns3::UlDciListElement_s> > >, ns3::UlDciListElement_s*, ns3::UlDciListElement_s> (196,365 samples, 0.02%)
void std::_Rb_tree<unsigned int, std::pair<unsigned int const, ns3::Ptr<ns3::SpectrumValue> >, std::_Select1st<std::pair<unsigned int const, ns3::Ptr<ns3::SpectrumValue> > >, std::less<unsigned int>, std::allocator<std::pair<unsigned int const, ns3::Ptr<ns3::SpectrumValue> > > >::_M_construct_node<std::pair<unsigned int const, ns3::Ptr<ns3::SpectrumValue> > const&> (127,066 samples, 0.01%)
std::vector<std::vector<ns3::RlcPduListElement_s, std::allocator<ns3::RlcPduListElement_s> >, std::allocator<std::vector<ns3::RlcPduListElement_s, std::allocator<ns3::RlcPduListElement_s> > > >::begin (157,097 samples, 0.02%)
ns3::EnbMacMemberLteEnbPhySapUser::SubframeIndication (19,358,790 samples, 2.00%)
std::__cxx11::list<ns3::Ptr<ns3::LteControlMessage>, std::allocator<ns3::Ptr<ns3::LteControlMessage> > >::list (205,185 samples, 0.02%)
std::_Vector_base<ns3::BuildDataListElement_s, std::allocator<ns3::BuildDataListElement_s> >::_M_allocate (198,391 samples, 0.02%)
std::map<unsigned char, ns3::LteMacSapProvider*, std::less<unsigned char>, std::allocator<std::pair<unsigned char const, ns3::LteMacSapProvider*> > >::find (270,008 samples, 0.03%)
ns3::operator+ (149,473 samples, 0.02%)
std::_Rb_tree<unsigned short, std::pair<unsigned short const, std::vector<unsigned short, std::allocator<unsigned short> > >, std::_Select1st<std::pair<unsigned short const, std::vector<unsigned short, std::allocator<unsigned short> > > >, std::less<unsigned short>, std::allocator<std::pair<unsigned short const, std::vector<unsigned short, std::allocator<unsigned short> > > > >::_Auto_node::_Auto_node<std::piecewise_construct_t const&, std::tuple<unsigned short const&>, std::tuple<> > (1,505,468 samples, 0.16%)
ns3::PacketMetadata::Create (796,815 samples, 0.08%)
ns3::Ptr<ns3::LteSpectrumSignalParametersDataFrame> ns3::Create<ns3::LteSpectrumSignalParametersDataFrame, ns3::LteSpectrumSignalParametersDataFrame const&> (6,974,208 samples, 0.72%)
ns3::Ptr<ns3::NetDevice>::Ptr (158,827 samples, 0.02%)
ns3::UniformRandomVariable::GetValue (910,934 samples, 0.09%)
__gnu_cxx::__aligned_membuf<std::pair<ns3::LteSpectrumModelId const, ns3::Ptr<ns3::SpectrumModel> > >::_M_ptr (165,849 samples, 0.02%)
std::_Vector_base<ns3::DlInfoListElement_s::HarqStatus_e, std::allocator<ns3::DlInfoListElement_s::HarqStatus_e> >::_M_allocate (364,814 samples, 0.04%)
ns3::LteHarqPhy::SubframeIndication (778,194 samples, 0.08%)
ns3::EnbMacMemberFfMacSchedSapUser::SchedDlConfigInd (415,834 samples, 0.04%)
double const* std::__niter_base<double const*, std::vector<double, std::allocator<double> > > (157,559 samples, 0.02%)
ns3::tbInfo_t::tbInfo_t (653,622 samples, 0.07%)
std::__cxx11::list<ns3::Ptr<ns3::Packet>, std::allocator<ns3::Ptr<ns3::Packet> > >::end (261,288 samples, 0.03%)
std::vector<unsigned short, std::allocator<unsigned short> >::vector (487,568 samples, 0.05%)
ns3::PfFfMacScheduler::RefreshDlCqiMaps (1,254,491 samples, 0.13%)
std::_Rb_tree_node<std::pair<unsigned int const, ns3::RxSpectrumModelInfo> >::_M_valptr (258,528 samples, 0.03%)
std::tuple_element<2ul, std::tuple<ns3::LteInterference*, ns3::Ptr<ns3::SpectrumValue const>, unsigned int> >::type& std::get<2ul, ns3::LteInterference*, ns3::Ptr<ns3::SpectrumValue const>, unsigned int> (960,298 samples, 0.10%)
ns3::LteUeRrc::DoRecvMasterInformationBlock (193,516 samples, 0.02%)
void std::destroy_at<std::pair<unsigned short const, std::vector<double, std::allocator<double> > > > (193,911 samples, 0.02%)
ns3::TagBuffer::WriteU8 (197,148 samples, 0.02%)
double* std::__uninitialized_copy_a<__gnu_cxx::__normal_iterator<double const*, std::vector<double, std::allocator<double> > >, double*, double> (418,403 samples, 0.04%)
std::vector<unsigned char, std::allocator<unsigned char> >::at (276,726 samples, 0.03%)
std::_Rb_tree<int, std::pair<int const, double>, std::_Select1st<std::pair<int const, double> >, std::less<int>, std::allocator<std::pair<int const, double> > >::_M_erase (818,048 samples, 0.08%)
ns3::MemberSchedSapProvider<ns3::PfFfMacScheduler>::SchedDlRlcBufferReq (605,673 samples, 0.06%)
std::vector<ns3::HigherLayerSelected_s, std::allocator<ns3::HigherLayerSelected_s> >::end (201,886 samples, 0.02%)
ns3::HigherLayerSelected_s::HigherLayerSelected_s (202,804 samples, 0.02%)
std::_Rb_tree<unsigned int, std::pair<unsigned int const, ns3::Ptr<ns3::SpectrumValue> >, std::_Select1st<std::pair<unsigned int const, ns3::Ptr<ns3::SpectrumValue> > >, std::less<unsigned int>, std::allocator<std::pair<unsigned int const, ns3::Ptr<ns3::SpectrumValue> > > >::~_Rb_tree (895,963 samples, 0.09%)
std::__new_allocator<double>::deallocate (154,926 samples, 0.02%)
int* std::__copy_move_a2<false, int const*, int*> (162,673 samples, 0.02%)
std::_Rb_tree_insert_and_rebalance (195,862 samples, 0.02%)
std::map<unsigned char, ns3::LteCcmMacSapProvider*, std::less<unsigned char>, std::allocator<std::pair<unsigned char const, ns3::LteCcmMacSapProvider*> > >::find (1,417,571 samples, 0.15%)
std::_Tuple_impl<1ul, ns3::Ptr<ns3::SpectrumValue const>, unsigned int>::_Tuple_impl (853,910 samples, 0.09%)
ns3::PacketBurst::~PacketBurst (383,002 samples, 0.04%)
ns3::SimpleRefCount<ns3::SpectrumSignalParameters, ns3::Empty, ns3::DefaultDeleter<ns3::SpectrumSignalParameters> >::Ref (272,369 samples, 0.03%)
ns3::LogComponent::IsEnabled (155,440 samples, 0.02%)
operator delete (153,527 samples, 0.02%)
void std::allocator_traits<std::allocator<std::_List_node<ns3::Ptr<ns3::LteControlMessage> > > >::construct<ns3::Ptr<ns3::LteControlMessage>, ns3::Ptr<ns3::MibLteControlMessage>&> (151,782 samples, 0.02%)
(240,645 samples, 0.02%)
void std::_Destroy<ns3::VendorSpecificListElement_s*, ns3::VendorSpecificListElement_s> (234,807 samples, 0.02%)
std::_Rb_tree<unsigned char, std::pair<unsigned char const, ns3::LteMacSapUser*>, std::_Select1st<std::pair<unsigned char const, ns3::LteMacSapUser*> >, std::less<unsigned char>, std::allocator<std::pair<unsigned char const, ns3::LteMacSapUser*> > >::_M_lower_bound (500,820 samples, 0.05%)
ns3::DefaultSimulatorImpl::Schedule (888,679 samples, 0.09%)
ns3::LteSpectrumPhy::EndRxData (121,921,584 samples, 12.57%) ns3::LteSpe..
modff64x (241,188 samples, 0.02%)
std::vector<std::vector<ns3::RlcPduListElement_s, std::allocator<ns3::RlcPduListElement_s> >, std::allocator<std::vector<ns3::RlcPduListElement_s, std::allocator<ns3::RlcPduListElement_s> > > >::max_size (465,751 samples, 0.05%)
ns3::LteEnbMac::DoSchedUlConfigInd (1,937,481 samples, 0.20%)
ns3::WrapToPi (196,497 samples, 0.02%)
std::_Rb_tree<unsigned short, std::pair<unsigned short const, unsigned char>, std::_Select1st<std::pair<unsigned short const, unsigned char> >, std::less<unsigned short>, std::allocator<std::pair<unsigned short const, unsigned char> > >::_M_begin (182,609 samples, 0.02%)
ns3::LteFfrAlgorithm::GetRbgSize (314,835 samples, 0.03%)
std::vector<double, std::allocator<double> >::_M_default_initialize (647,164 samples, 0.07%)
std::_Rb_tree<unsigned short, std::pair<unsigned short const, std::vector<std::vector<ns3::HarqProcessInfoElement_t, std::allocator<ns3::HarqProcessInfoElement_t> >, std::allocator<std::vector<ns3::HarqProcessInfoElement_t, std::allocator<ns3::HarqProcessInfoElement_t> > > > >, std::_Select1st<std::pair<unsigned short const, std::vector<std::vector<ns3::HarqProcessInfoElement_t, std::allocator<ns3::HarqProcessInfoElement_t> >, std::allocator<std::vector<ns3::HarqProcessInfoElement_t, std::allocator<ns3::HarqProcessInfoElement_t> > > > > >, std::less<unsigned short>, std::allocator<std::pair<unsigned short const, std::vector<std::vector<ns3::HarqProcessInfoElement_t, std::allocator<ns3::HarqProcessInfoElement_t> >, std::allocator<std::vector<ns3::HarqProcessInfoElement_t, std::allocator<ns3::HarqProcessInfoElement_t> > > > > > >::find (2,749,650 samples, 0.28%)
std::__cxx11::list<ns3::UlDciLteControlMessage, std::allocator<ns3::UlDciLteControlMessage> >* std::__copy_move<true, false, std::random_access_iterator_tag>::__copy_m<std::__cxx11::list<ns3::UlDciLteControlMessage, std::allocator<ns3::UlDciLteControlMessage> >*, std::__cxx11::list<ns3::UlDciLteControlMessage, std::allocator<ns3::UlDciLteControlMessage> >*> (145,758 samples, 0.02%)
std::vector<ns3::BuildDataListElement_s, std::allocator<ns3::BuildDataListElement_s> >::operator[] (152,525 samples, 0.02%)
int& std::vector<int, std::allocator<int> >::emplace_back<int> (931,649 samples, 0.10%)
ns3::Ptr<ns3::PacketBurst>::~Ptr (279,109 samples, 0.03%)
std::__new_allocator<std::_List_node<ns3::Ptr<ns3::Packet> > >::allocate (313,319 samples, 0.03%)
unsigned char* std::copy<__gnu_cxx::__normal_iterator<unsigned char const*, std::vector<unsigned char, std::allocator<unsigned char> > >, unsigned char*> (280,915 samples, 0.03%)
ns3::Ptr<ns3::Packet>::Ptr (218,155 samples, 0.02%)
std::_Rb_tree_node<std::pair<unsigned int const, ns3::Ptr<ns3::SpectrumValue> > >* std::_Rb_tree<unsigned int, std::pair<unsigned int const, ns3::Ptr<ns3::SpectrumValue> >, std::_Select1st<std::pair<unsigned int const, ns3::Ptr<ns3::SpectrumValue> > >, std::less<unsigned int>, std::allocator<std::pair<unsigned int const, ns3::Ptr<ns3::SpectrumValue> > > >::_M_clone_node<false, std::_Rb_tree<unsigned int, std::pair<unsigned int const, ns3::Ptr<ns3::SpectrumValue> >, std::_Select1st<std::pair<unsigned int const, ns3::Ptr<ns3::SpectrumValue> > >, std::less<unsigned int>, std::allocator<std::pair<unsigned int const, ns3::Ptr<ns3::SpectrumValue> > > >::_Alloc_node> (155,456 samples, 0.02%)
ns3::SimpleRefCount<ns3::LteControlMessage, ns3::Empty, ns3::DefaultDeleter<ns3::LteControlMessage> >::Unref (127,064 samples, 0.01%)
ns3::SimpleRefCount<ns3::Packet, ns3::Empty, ns3::DefaultDeleter<ns3::Packet> >::Unref (943,939 samples, 0.10%)
ns3::DefaultDeleter<ns3::Packet>::Delete (359,163 samples, 0.04%)
ns3::HigherLayerSelected_s* std::vector<ns3::HigherLayerSelected_s, std::allocator<ns3::HigherLayerSelected_s> >::_M_allocate_and_copy<__gnu_cxx::__normal_iterator<ns3::HigherLayerSelected_s const*, std::vector<ns3::HigherLayerSelected_s, std::allocator<ns3::HigherLayerSelected_s> > > > (324,739 samples, 0.03%)
std::__cxx11::_List_base<ns3::Ptr<ns3::Packet>, std::allocator<ns3::Ptr<ns3::Packet> > >::_M_clear (891,714 samples, 0.09%)
void std::_Destroy<ns3::CqiListElement_s> (154,796 samples, 0.02%)
operator new (190,161 samples, 0.02%)
ns3::Ptr<ns3::EventImpl>::~Ptr (281,749 samples, 0.03%)
ns3::Simulator::DoSchedule (888,679 samples, 0.09%)
std::_Tuple_impl<5ul, std::map<unsigned int, ns3::Ptr<ns3::SpectrumValue>, std::less<unsigned int>, std::allocator<std::pair<unsigned int const, ns3::Ptr<ns3::SpectrumValue> > > > >::~_Tuple_impl (934,712 samples, 0.10%)
std::_Rb_tree_iterator<std::pair<unsigned short const, std::vector<unsigned char, std::allocator<unsigned char> > > >::_Rb_tree_iterator (163,346 samples, 0.02%)
void std::_Destroy<ns3::BuildDataListElement_s*, ns3::BuildDataListElement_s> (793,632 samples, 0.08%)
__gnu_cxx::__enable_if<std::__is_scalar<unsigned int>::__value, void>::__type std::__fill_a1<unsigned int*, unsigned int> (467,368 samples, 0.05%)
ns3::MacCeValue_u::MacCeValue_u (153,635 samples, 0.02%)
decltype (232,855 samples, 0.02%)
std::__cxx11::list<ns3::Ptr<ns3::LteControlMessage>, std::allocator<ns3::Ptr<ns3::LteControlMessage> > >::operator= (3,155,006 samples, 0.33%)
ns3::ByteTagList::Begin (1,259,994 samples, 0.13%)
ns3::SbMeasResult_s::~SbMeasResult_s (154,796 samples, 0.02%)
ns3::MemberSchedSapProvider<ns3::PfFfMacScheduler>::SchedDlTriggerReq (102,277,174 samples, 10.55%) ns3::Memb..
ns3::HigherLayerSelected_s* std::__copy_move_a1<false, ns3::HigherLayerSelected_s const*, ns3::HigherLayerSelected_s*> (126,567 samples, 0.01%)
ns3::FfMacSchedSapProvider::SchedUlCqiInfoReqParameters* std::__addressof<ns3::FfMacSchedSapProvider::SchedUlCqiInfoReqParameters> (156,394 samples, 0.02%)
std::__allocated_ptr<std::allocator<std::_List_node<ns3::Ptr<ns3::LteControlMessage> > > >::operator= (125,732 samples, 0.01%)
ns3::RlcTag::Serialize (356,272 samples, 0.04%)
ns3::Object::Construct (2,451,198 samples, 0.25%)
std::_Rb_tree<ns3::Scheduler::EventKey, std::pair<ns3::Scheduler::EventKey const, ns3::EventImpl*>, std::_Select1st<std::pair<ns3::Scheduler::EventKey const, ns3::EventImpl*> >, std::less<ns3::Scheduler::EventKey>, std::allocator<std::pair<ns3::Scheduler::EventKey const, ns3::EventImpl*> > >::_M_get_node (768,882 samples, 0.08%)
int* std::__copy_move_a1<false, int const*, int*> (214,092 samples, 0.02%)
std::_Rb_tree<unsigned short, unsigned short, std::_Identity<unsigned short>, std::less<unsigned short>, std::allocator<unsigned short> >::find (955,568 samples, 0.10%)
ns3::Ptr<ns3::SpectrumValue const>::Ptr<ns3::SpectrumValue> (191,031 samples, 0.02%)
std::_Vector_base<double, std::allocator<double> >::~_Vector_base (146,912 samples, 0.02%)
ns3::GetImpl (242,375 samples, 0.02%)
std::_Head_base<5ul, std::map<unsigned int, ns3::Ptr<ns3::SpectrumValue>, std::less<unsigned int>, std::allocator<std::pair<unsigned int const, ns3::Ptr<ns3::SpectrumValue> > > >, false>::~_Head_base (934,712 samples, 0.10%)
int* std::__copy_move<false, true, std::random_access_iterator_tag>::__copy_m<int const, int> (162,673 samples, 0.02%)
[libm.so.6] (276,808 samples, 0.03%)
std::enable_if<is_invocable_r_v<void, std::_Bind<void (888,830,008 samples, 91.65%) std::enable_if<is_invocable_r_v<void, std::_Bind<void
ns3::Ptr<ns3::SpectrumValue> ns3::Create<ns3::SpectrumValue, ns3::Ptr<ns3::SpectrumModel const> const&> (1,116,674 samples, 0.12%)
ns3::LteSpectrumValueHelper::GetSpectrumModel (1,991,247 samples, 0.21%)
std::map<unsigned short, unsigned char, std::less<unsigned short>, std::allocator<std::pair<unsigned short const, unsigned char> > >::begin (434,661 samples, 0.04%)
std::vector<ns3::BuildDataListElement_s, std::allocator<ns3::BuildDataListElement_s> >::_S_relocate (371,811 samples, 0.04%)
ns3::Ptr<ns3::NixVector>::Ptr (292,715 samples, 0.03%)
ns3::SbMeasResult_s::SbMeasResult_s (154,721 samples, 0.02%)
ns3::DlInfoListElement_s* std::vector<ns3::DlInfoListElement_s, std::allocator<ns3::DlInfoListElement_s> >::_M_allocate_and_copy<__gnu_cxx::__normal_iterator<ns3::DlInfoListElement_s const*, std::vector<ns3::DlInfoListElement_s, std::allocator<ns3::DlInfoListElement_s> > > > (5,646,301 samples, 0.58%)
ns3::TagBuffer::TagBuffer (206,219 samples, 0.02%)
ns3::SimpleRefCount<ns3::LteControlMessage, ns3::Empty, ns3::DefaultDeleter<ns3::LteControlMessage> >::SimpleRefCount (141,410 samples, 0.01%)
ns3::PfFfMacScheduler::DoSchedDlTriggerReq (415,834 samples, 0.04%)
void std::allocator_traits<std::allocator<std::_List_node<ns3::Ptr<ns3::Packet> > > >::construct<ns3::Ptr<ns3::Packet>, ns3::Ptr<ns3::Packet> const&> (247,590 samples, 0.03%)
ns3::LteSpectrumPhy::EndRxUlSrs (363,240 samples, 0.04%)
std::vector<bool, std::allocator<bool> >::size (156,263 samples, 0.02%)
ns3::PacketBurst::~PacketBurst (1,016,178 samples, 0.10%)
std::enable_if<std::__is_bitwise_relocatable<unsigned short, void>::value, unsigned short*>::type std::__relocate_a_1<unsigned short, unsigned short> (126,646 samples, 0.01%)
std::vector<ns3::RlcPduListElement_s, std::allocator<ns3::RlcPduListElement_s> >::_S_relocate (319,205 samples, 0.03%)
double* std::uninitialized_copy<__gnu_cxx::__normal_iterator<double const*, std::vector<double, std::allocator<double> > >, double*> (210,427 samples, 0.02%)
ns3::ObjectBase::ObjectBase (178,001 samples, 0.02%)
std::_Rb_tree_iterator<std::pair<ns3::Scheduler::EventKey const, ns3::EventImpl*> > std::_Rb_tree<ns3::Scheduler::EventKey, std::pair<ns3::Scheduler::EventKey const, ns3::EventImpl*>, std::_Select1st<std::pair<ns3::Scheduler::EventKey const, ns3::EventImpl*> >, std::less<ns3::Scheduler::EventKey>, std::allocator<std::pair<ns3::Scheduler::EventKey const, ns3::EventImpl*> > >::_M_emplace_hint_unique<std::pair<ns3::Scheduler::EventKey, ns3::EventImpl*> > (917,334 samples, 0.09%)
std::vector<bool, std::allocator<bool> >::_M_fill_insert (4,584,091 samples, 0.47%)
[ld-linux-x86-64.so.2] (1,432,154 samples, 0.15%)
std::__cxx11::list<ns3::Ptr<ns3::Packet>, std::allocator<ns3::Ptr<ns3::Packet> > >::clear (1,296,666 samples, 0.13%)
ns3::ObjectBase::ConstructSelf (2,205,090 samples, 0.23%)
std::_Rb_tree_iterator<std::pair<ns3::Scheduler::EventKey const, ns3::EventImpl*> >::operator-- (189,133 samples, 0.02%)
ns3::LtePhy::SetMacPdu (539,148 samples, 0.06%)
std::vector<std::__cxx11::list<ns3::Ptr<ns3::LteControlMessage>, std::allocator<ns3::Ptr<ns3::LteControlMessage> > >, std::allocator<std::__cxx11::list<ns3::Ptr<ns3::LteControlMessage>, std::allocator<ns3::Ptr<ns3::LteControlMessage> > > > >::at (165,094 samples, 0.02%)
ns3::UeSelected_s::operator= (127,305 samples, 0.01%)
ns3::PacketMetadata::Create (266,992 samples, 0.03%)
ns3::ObjectBase::ConstructSelf (185,707 samples, 0.02%)
std::_Rb_tree<unsigned short, std::pair<unsigned short const, ns3::DlInfoListElement_s>, std::_Select1st<std::pair<unsigned short const, ns3::DlInfoListElement_s> >, std::less<unsigned short>, std::allocator<std::pair<unsigned short const, ns3::DlInfoListElement_s> > >::_Auto_node::_Auto_node<std::pair<unsigned short, ns3::DlInfoListElement_s> > (1,129,994 samples, 0.12%)
[libm.so.6] (283,669 samples, 0.03%)
ns3::Ptr<ns3::SpectrumSignalParameters>::Ptr (126,810 samples, 0.01%)
ns3::Ptr<ns3::LteControlMessage>::Acquire (196,949 samples, 0.02%)
std::_Rb_tree<ns3::LteSpectrumModelId, std::pair<ns3::LteSpectrumModelId const, ns3::Ptr<ns3::SpectrumModel> >, std::_Select1st<std::pair<ns3::LteSpectrumModelId const, ns3::Ptr<ns3::SpectrumModel> > >, std::less<ns3::LteSpectrumModelId>, std::allocator<std::pair<ns3::LteSpectrumModelId const, ns3::Ptr<ns3::SpectrumModel> > > >::find (1,328,190 samples, 0.14%)
std::__cxx11::list<ns3::Ptr<ns3::Packet>, std::allocator<ns3::Ptr<ns3::Packet> > >::push_back (234,373 samples, 0.02%)
std::vector<unsigned char, std::allocator<unsigned char> >::~vector (162,616 samples, 0.02%)
ns3::SbMeasResult_s::SbMeasResult_s (1,765,679 samples, 0.18%)
ns3::EnbMacMemberLteMacSapProvider<ns3::LteEnbMac>::ReportBufferStatus (3,928,142 samples, 0.41%)
pow (353,785 samples, 0.04%)
void std::_Rb_tree<unsigned int, std::pair<unsigned int const, ns3::Ptr<ns3::SpectrumValue> >, std::_Select1st<std::pair<unsigned int const, ns3::Ptr<ns3::SpectrumValue> > >, std::less<unsigned int>, std::allocator<std::pair<unsigned int const, ns3::Ptr<ns3::SpectrumValue> > > >::_M_construct_node<unsigned int const&, ns3::Ptr<ns3::SpectrumValue>&> (395,726 samples, 0.04%)
ns3::Buffer::Buffer (238,535 samples, 0.02%)
ns3::Ptr<ns3::SpectrumModel const>::Ptr (141,816 samples, 0.01%)
ns3::TracedCallback<ns3::Ptr<ns3::SpectrumSignalParameters> >::operator (699,741 samples, 0.07%)
ns3::LtePhy::GetControlMessages[abi:cxx11] (5,917,079 samples, 0.61%)
void std::allocator_traits<std::allocator<std::_Rb_tree_node<std::pair<unsigned short const, std::vector<double, std::allocator<double> > > > > >::construct<std::pair<unsigned short const, std::vector<double, std::allocator<double> > >, std::pair<unsigned short const, std::vector<double, std::allocator<double> > > const&> (2,931,196 samples, 0.30%)
std::vector<unsigned char, std::allocator<unsigned char> >::push_back (155,710 samples, 0.02%)
void std::_Destroy<ns3::CqiListElement_s*> (416,767 samples, 0.04%)
ns3::PacketBurst::~PacketBurst (158,753 samples, 0.02%)
ns3::CqiListElement_s::~CqiListElement_s (154,796 samples, 0.02%)
std::_Rb_tree<unsigned short, std::pair<unsigned short const, unsigned int>, std::_Select1st<std::pair<unsigned short const, unsigned int> >, std::less<unsigned short>, std::allocator<std::pair<unsigned short const, unsigned int> > >::_M_begin (318,309 samples, 0.03%)
void std::_Destroy<int*, int> (161,562 samples, 0.02%)
ns3::DlInfoListElement_s::HarqStatus_e* std::copy<__gnu_cxx::__normal_iterator<ns3::DlInfoListElement_s::HarqStatus_e const*, std::vector<ns3::DlInfoListElement_s::HarqStatus_e, std::allocator<ns3::DlInfoListElement_s::HarqStatus_e> > >, ns3::DlInfoListElement_s::HarqStatus_e*> (1,860,884 samples, 0.19%)
ns3::Packet::~Packet (734,989 samples, 0.08%)
std::_Bind_helper<std::__or_<std::is_integral<std::decay<void (325,363 samples, 0.03%)
decltype (240,418 samples, 0.02%)
void std::__cxx11::list<ns3::UlDciLteControlMessage, std::allocator<ns3::UlDciLteControlMessage> >::_M_insert<ns3::UlDciLteControlMessage const&> (1,786,879 samples, 0.18%)
double* std::__uninitialized_default_n<double*, unsigned long> (455,698 samples, 0.05%)
__gnu_cxx::__aligned_membuf<std::pair<unsigned short const, unsigned int> >::_M_ptr (349,350 samples, 0.04%)
void std::__invoke_impl<void, ns3::MakeEvent<> (238,924 samples, 0.02%)
std::_Rb_tree<unsigned int, std::pair<unsigned int const, ns3::TxSpectrumModelInfo>, std::_Select1st<std::pair<unsigned int const, ns3::TxSpectrumModelInfo> >, std::less<unsigned int>, std::allocator<std::pair<unsigned int const, ns3::TxSpectrumModelInfo> > >::_M_lower_bound (420,439 samples, 0.04%)
unsigned short* std::__uninitialized_copy<true>::__uninit_copy<std::move_iterator<unsigned short*>, unsigned short*> (728,775 samples, 0.08%)
std::_Vector_base<ns3::VendorSpecificListElement_s, std::allocator<ns3::VendorSpecificListElement_s> >::_Vector_impl_data::_Vector_impl_data (157,537 samples, 0.02%)
ns3::LteAmc::GetMcsFromCqi (233,362 samples, 0.02%)
__gnu_cxx::__normal_iterator<ns3::Ptr<ns3::PacketBurst>*, std::vector<ns3::Ptr<ns3::PacketBurst>, std::allocator<ns3::Ptr<ns3::PacketBurst> > > > std::__miter_base<__gnu_cxx::__normal_iterator<ns3::Ptr<ns3::PacketBurst>*, std::vector<ns3::Ptr<ns3::PacketBurst>, std::allocator<ns3::Ptr<ns3::PacketBurst> > > > > (188,301 samples, 0.02%)
std::map<unsigned char, ns3::LteMacSapProvider::ReportBufferStatusParameters, std::less<unsigned char>, std::allocator<std::pair<unsigned char const, ns3::LteMacSapProvider::ReportBufferStatusParameters> > >::end (158,274 samples, 0.02%)
ns3::Singleton<ns3::IidManager>::Get (145,954 samples, 0.02%)
std::_Rb_tree<unsigned short, std::pair<unsigned short const, std::vector<std::vector<ns3::HarqProcessInfoElement_t, std::allocator<ns3::HarqProcessInfoElement_t> >, std::allocator<std::vector<ns3::HarqProcessInfoElement_t, std::allocator<ns3::HarqProcessInfoElement_t> > > > >, std::_Select1st<std::pair<unsigned short const, std::vector<std::vector<ns3::HarqProcessInfoElement_t, std::allocator<ns3::HarqProcessInfoElement_t> >, std::allocator<std::vector<ns3::HarqProcessInfoElement_t, std::allocator<ns3::HarqProcessInfoElement_t> > > > > >, std::less<unsigned short>, std::allocator<std::pair<unsigned short const, std::vector<std::vector<ns3::HarqProcessInfoElement_t, std::allocator<ns3::HarqProcessInfoElement_t> >, std::allocator<std::vector<ns3::HarqProcessInfoElement_t, std::allocator<ns3::HarqProcessInfoElement_t> > > > > > >::find (1,985,670 samples, 0.20%)
std::tuple_element<3ul, std::tuple<ns3::MultiModelSpectrumChannel*, ns3::Ptr<ns3::SpectrumValue>, double, ns3::Ptr<ns3::SpectrumSignalParameters>, ns3::Ptr<ns3::SpectrumPhy>, std::map<unsigned int, ns3::Ptr<ns3::SpectrumValue>, std::less<unsigned int>, std::allocator<std::pair<unsigned int const, ns3::Ptr<ns3::SpectrumValue> > > > > >::type& std::get<3ul, ns3::MultiModelSpectrumChannel*, ns3::Ptr<ns3::SpectrumValue>, double, ns3::Ptr<ns3::SpectrumSignalParameters>, ns3::Ptr<ns3::SpectrumPhy>, std::map<unsigned int, ns3::Ptr<ns3::SpectrumValue>, std::less<unsigned int>, std::allocator<std::pair<unsigned int const, ns3::Ptr<ns3::SpectrumValue> > > > > (236,255 samples, 0.02%)
std::move_iterator<unsigned short*>::move_iterator (197,587 samples, 0.02%)
ns3::Object::Dispose (238,924 samples, 0.02%)
std::_Rb_tree_iterator<std::pair<ns3::Scheduler::EventKey const, ns3::EventImpl*> > std::_Rb_tree<ns3::Scheduler::EventKey, std::pair<ns3::Scheduler::EventKey const, ns3::EventImpl*>, std::_Select1st<std::pair<ns3::Scheduler::EventKey const, ns3::EventImpl*> >, std::less<ns3::Scheduler::EventKey>, std::allocator<std::pair<ns3::Scheduler::EventKey const, ns3::EventImpl*> > >::_M_emplace_hint_unique<std::pair<ns3::Scheduler::EventKey, ns3::EventImpl*> > (2,388,285 samples, 0.25%)
ns3::DefaultSimulatorImpl::Schedule (2,358,952 samples, 0.24%)
ns3::MemberLteCcmMacSapUser<ns3::NoOpComponentCarrierManager>::NotifyTxOpportunity (304,289 samples, 0.03%)
std::map<unsigned char, ns3::LteMacSapProvider::ReportBufferStatusParameters, std::less<unsigned char>, std::allocator<std::pair<unsigned char const, ns3::LteMacSapProvider::ReportBufferStatusParameters> > >::end (393,274 samples, 0.04%)
std::map<unsigned short, ns3::pfsFlowPerf_t, std::less<unsigned short>, std::allocator<std::pair<unsigned short const, ns3::pfsFlowPerf_t> > >::find (1,750,862 samples, 0.18%)
std::_List_const_iterator<ns3::Ptr<ns3::Packet> >::operator++ (196,897 samples, 0.02%)
ns3::LogComponent::IsEnabled (217,399 samples, 0.02%)
double* std::__copy_move_a2<false, double const*, double*> (125,420 samples, 0.01%)
ns3::CqiListElement_s* std::__uninitialized_copy<false>::__uninit_copy<__gnu_cxx::__normal_iterator<ns3::CqiListElement_s*, std::vector<ns3::CqiListElement_s, std::allocator<ns3::CqiListElement_s> > >, ns3::CqiListElement_s*> (1,085,784 samples, 0.11%)
ns3::LogComponent::IsEnabled (126,870 samples, 0.01%)
std::__tuple_compare<std::tuple<double const&, double const&, double const&>, std::tuple<double const&, double const&, double const&>, 1ul, 3ul>::__eq (1,304,506 samples, 0.13%)
std::less<unsigned short>::operator (310,760 samples, 0.03%)
std::_Rb_tree<unsigned short, std::pair<unsigned short const, std::map<unsigned char, ns3::LteMacSapUser*, std::less<unsigned char>, std::allocator<std::pair<unsigned char const, ns3::LteMacSapUser*> > > >, std::_Select1st<std::pair<unsigned short const, std::map<unsigned char, ns3::LteMacSapUser*, std::less<unsigned char>, std::allocator<std::pair<unsigned char const, ns3::LteMacSapUser*> > > > >, std::less<unsigned short>, std::allocator<std::pair<unsigned short const, std::map<unsigned char, ns3::LteMacSapUser*, std::less<unsigned char>, std::allocator<std::pair<unsigned char const, ns3::LteMacSapUser*> > > > > >::_M_lower_bound (1,339,418 samples, 0.14%)
void std::allocator_traits<std::allocator<std::_List_node<ns3::Ptr<ns3::PacketBurst> > > >::destroy<ns3::Ptr<ns3::PacketBurst> > (1,991,119 samples, 0.21%)
std::vector<ns3::DlInfoListElement_s, std::allocator<ns3::DlInfoListElement_s> >::begin (154,700 samples, 0.02%)
std::_Rb_tree_iterator<std::pair<unsigned short const, unsigned char> >::operator* (264,202 samples, 0.03%)
(234,452 samples, 0.02%)
std::tuple<ns3::LteInterference*, ns3::Ptr<ns3::SpectrumValue const>, unsigned int>::~tuple (1,016,655 samples, 0.10%)
std::_Rb_tree<unsigned int, std::pair<unsigned int const, ns3::RxSpectrumModelInfo>, std::_Select1st<std::pair<unsigned int const, ns3::RxSpectrumModelInfo> >, std::less<unsigned int>, std::allocator<std::pair<unsigned int const, ns3::RxSpectrumModelInfo> > >::begin (414,271 samples, 0.04%)
ns3::Ptr<ns3::LteControlMessage>::Ptr (199,678 samples, 0.02%)
ns3::MacCeValue_u::~MacCeValue_u (457,826 samples, 0.05%)
std::vector<ns3::CeBitmap_e, std::allocator<ns3::CeBitmap_e> >::~vector (156,611 samples, 0.02%)
void std::_Function_base::_Base_manager<std::_Bind<void (496,911 samples, 0.05%)
ns3::Ptr<ns3::AntennaModel>::Acquire (155,047 samples, 0.02%)
ns3::Packet::RemovePacketTag (1,745,173 samples, 0.18%)
std::allocator<int>::allocate (169,207 samples, 0.02%)
[libm.so.6] (303,230 samples, 0.03%)
std::vector<unsigned char, std::allocator<unsigned char> >::max_size (250,041 samples, 0.03%)
ns3::MakeEvent<void (319,694 samples, 0.03%)
(164,113 samples, 0.02%)
ns3::CeBitmap_e* std::__uninitialized_copy<true>::__uninit_copy<__gnu_cxx::__normal_iterator<ns3::CeBitmap_e const*, std::vector<ns3::CeBitmap_e, std::allocator<ns3::CeBitmap_e> > >, ns3::CeBitmap_e*> (414,390 samples, 0.04%)
std::vector<double, std::allocator<double> >::vector (1,354,660 samples, 0.14%)
std::_Rb_tree_iterator<std::pair<unsigned char const, std::map<unsigned char, ns3::LteMacSapProvider*, std::less<unsigned char>, std::allocator<std::pair<unsigned char const, ns3::LteMacSapProvider*> > > > >::operator (126,576 samples, 0.01%)
ns3::Ptr<ns3::LteControlMessage>::Ptr (156,463 samples, 0.02%)
ns3::EventId ns3::Simulator::Schedule<void (4,891,359 samples, 0.50%)
ns3::Ptr<ns3::PacketBurst>* std::__copy_move<true, false, std::random_access_iterator_tag>::__copy_m<ns3::Ptr<ns3::PacketBurst>*, ns3::Ptr<ns3::PacketBurst>*> (5,666,405 samples, 0.58%)
std::_Rb_tree<unsigned short, std::pair<unsigned short const, std::vector<std::vector<ns3::Ptr<ns3::PacketBurst>, std::allocator<ns3::Ptr<ns3::PacketBurst> > >, std::allocator<std::vector<ns3::Ptr<ns3::PacketBurst>, std::allocator<ns3::Ptr<ns3::PacketBurst> > > > > >, std::_Select1st<std::pair<unsigned short const, std::vector<std::vector<ns3::Ptr<ns3::PacketBurst>, std::allocator<ns3::Ptr<ns3::PacketBurst> > >, std::allocator<std::vector<ns3::Ptr<ns3::PacketBurst>, std::allocator<ns3::Ptr<ns3::PacketBurst> > > > > > >, std::less<unsigned short>, std::allocator<std::pair<unsigned short const, std::vector<std::vector<ns3::Ptr<ns3::PacketBurst>, std::allocator<ns3::Ptr<ns3::PacketBurst> > >, std::allocator<std::vector<ns3::Ptr<ns3::PacketBurst>, std::allocator<ns3::Ptr<ns3::PacketBurst> > > > > > > >::_M_begin (155,598 samples, 0.02%)
ns3::SpectrumValue::~SpectrumValue (127,422 samples, 0.01%)
ns3::Ptr<ns3::RarLteControlMessage>::~Ptr (538,741 samples, 0.06%)
ns3::Buffer::Buffer (1,912,352 samples, 0.20%)
__gnu_cxx::__normal_iterator<int*, std::vector<int, std::allocator<int> > > std::__copy_move_a<false, __gnu_cxx::__normal_iterator<int const*, std::vector<int, std::allocator<int> > >, __gnu_cxx::__normal_iterator<int*, std::vector<int, std::allocator<int> > > > (330,607 samples, 0.03%)
std::_Rb_tree<ns3::Scheduler::EventKey, std::pair<ns3::Scheduler::EventKey const, ns3::EventImpl*>, std::_Select1st<std::pair<ns3::Scheduler::EventKey const, ns3::EventImpl*> >, std::less<ns3::Scheduler::EventKey>, std::allocator<std::pair<ns3::Scheduler::EventKey const, ns3::EventImpl*> > >::_M_mbegin (234,522 samples, 0.02%)
ns3::LteEnbMac::DoSchedDlConfigInd (1,650,854 samples, 0.17%)
std::vector<unsigned char, std::allocator<unsigned char> >::size (164,095 samples, 0.02%)
ns3::PacketMetadata::~PacketMetadata (559,336 samples, 0.06%)
ns3::MemberSchedSapProvider<ns3::PfFfMacScheduler>::SchedUlTriggerReq (34,464,006 samples, 3.55%) n..
std::vector<unsigned char, std::allocator<unsigned char> >::_M_check_len (545,573 samples, 0.06%)
std::vector<unsigned char, std::allocator<unsigned char> >::operator= (277,205 samples, 0.03%)
std::less<unsigned int>::operator (177,845 samples, 0.02%)
std::pair<ns3::TbId_t, ns3::tbInfo_t>::~pair (307,118 samples, 0.03%)
std::vector<ns3::DlDciListElement_s, std::allocator<ns3::DlDciListElement_s> >::size (284,337 samples, 0.03%)
std::vector<double, std::allocator<double> >::~vector (292,063 samples, 0.03%)
std::map<unsigned int, ns3::Ptr<ns3::SpectrumValue>, std::less<unsigned int>, std::allocator<std::pair<unsigned int const, ns3::Ptr<ns3::SpectrumValue> > > >::map (164,996 samples, 0.02%)
std::_Tuple_impl<1ul, ns3::Ptr<ns3::SpectrumValue const>, unsigned int>::_Tuple_impl<ns3::Ptr<ns3::SpectrumValue const>&, unsigned int&, void> (939,853 samples, 0.10%)
ns3::Object::SetTypeId (389,266 samples, 0.04%)
std::vector<std::__cxx11::list<ns3::UlDciLteControlMessage, std::allocator<ns3::UlDciLteControlMessage> >, std::allocator<std::__cxx11::list<ns3::UlDciLteControlMessage, std::allocator<ns3::UlDciLteControlMessage> > > >::end (191,913 samples, 0.02%)
ns3::Ptr<ns3::SpectrumModel const>::Acquire (156,296 samples, 0.02%)
std::vector<ns3::DlInfoListElement_s::HarqStatus_e, std::allocator<ns3::DlInfoListElement_s::HarqStatus_e> >::vector (485,819 samples, 0.05%)
std::__cxx11::list<ns3::AttributeConstructionList::Item, std::allocator<ns3::AttributeConstructionList::Item> >::list (496,879 samples, 0.05%)
decltype (274,733 samples, 0.03%)
std::map<ns3::TbId_t, ns3::tbInfo_t, std::less<ns3::TbId_t>, std::allocator<std::pair<ns3::TbId_t const, ns3::tbInfo_t> > >::clear (2,281,160 samples, 0.24%)
std::vector<double, std::allocator<double> >::_S_check_init_len (245,728 samples, 0.03%)
std::map<ns3::Scheduler::EventKey, ns3::EventImpl*, std::less<ns3::Scheduler::EventKey>, std::allocator<std::pair<ns3::Scheduler::EventKey const, ns3::EventImpl*> > >::erase[abi:cxx11] (7,110,876 samples, 0.73%)
ns3::Simulator::DoSchedule (192,930 samples, 0.02%)
ns3::LteUeMac::RefreshHarqProcessesPacketBuffer (953,324 samples, 0.10%)
std::_Vector_base<double, std::allocator<double> >::_M_allocate (126,483 samples, 0.01%)
void std::__cxx11::list<ns3::Ptr<ns3::LteControlMessage>, std::allocator<ns3::Ptr<ns3::LteControlMessage> > >::_M_insert<ns3::Ptr<ns3::MibLteControlMessage>&> (190,229 samples, 0.02%)
std::_Rb_tree_iterator<std::pair<unsigned int const, ns3::Ptr<ns3::SpectrumValue> > > std::map<unsigned int, ns3::Ptr<ns3::SpectrumValue>, std::less<unsigned int>, std::allocator<std::pair<unsigned int const, ns3::Ptr<ns3::SpectrumValue> > > >::emplace_hint<unsigned int const&, ns3::Ptr<ns3::SpectrumValue>&> (1,502,471 samples, 0.15%)
ns3::Ptr<ns3::LteControlMessage>& std::__cxx11::list<ns3::Ptr<ns3::LteControlMessage>, std::allocator<ns3::Ptr<ns3::LteControlMessage> > >::emplace_back<ns3::Ptr<ns3::MibLteControlMessage>&> (190,229 samples, 0.02%)
std::enable_if<is_member_pointer_v<void (2,016,394 samples, 0.21%)
void std::__copy_move<false, false, std::random_access_iterator_tag>::__assign_one<ns3::DlInfoListElement_s::HarqStatus_e, ns3::DlInfoListElement_s::HarqStatus_e const> (390,278 samples, 0.04%)
std::_Vector_base<ns3::HigherLayerSelected_s, std::allocator<ns3::HigherLayerSelected_s> >::_M_create_storage (329,313 samples, 0.03%)
std::__cxx11::list<ns3::Ptr<ns3::LteControlMessage>, std::allocator<ns3::Ptr<ns3::LteControlMessage> > >::~list (191,802 samples, 0.02%)
std::allocator_traits<std::allocator<std::_List_node<ns3::Ptr<ns3::LteControlMessage> > > >::deallocate (124,394 samples, 0.01%)
ns3::ByteTagList::Allocate (1,800,803 samples, 0.19%)
std::__cxx11::_List_base<ns3::UlDciLteControlMessage, std::allocator<ns3::UlDciLteControlMessage> >::_List_impl::_List_impl (831,229 samples, 0.09%)
std::tuple<ns3::LteEnbPhy*, ns3::Ptr<ns3::PacketBurst> >::tuple<ns3::LteEnbPhy*&, ns3::Ptr<ns3::PacketBurst>&, true> (929,346 samples, 0.10%)
std::_Tuple_impl<0ul, ns3::LteInterference*, ns3::Ptr<ns3::SpectrumValue const>, unsigned int>::~_Tuple_impl (448,944 samples, 0.05%)
std::_Rb_tree<unsigned short, std::pair<unsigned short const, std::vector<double, std::allocator<double> > >, std::_Select1st<std::pair<unsigned short const, std::vector<double, std::allocator<double> > > >, std::less<unsigned short>, std::allocator<std::pair<unsigned short const, std::vector<double, std::allocator<double> > > > >::_Rb_tree (400,356 samples, 0.04%)
std::__new_allocator<ns3::DlInfoListElement_s>::allocate (265,191 samples, 0.03%)
std::tuple<ns3::LteSpectrumPhy*>::tuple (285,575 samples, 0.03%)
ns3::FfMacSchedSapProvider::SchedDlTriggerReqParameters::~SchedDlTriggerReqParameters (1,122,238 samples, 0.12%)
std::_Rb_tree_iterator<std::pair<ns3::Scheduler::EventKey const, ns3::EventImpl*> >::operator* (316,524 samples, 0.03%)
std::_Rb_tree<unsigned short, std::pair<unsigned short const, unsigned int>, std::_Select1st<std::pair<unsigned short const, unsigned int> >, std::less<unsigned short>, std::allocator<std::pair<unsigned short const, unsigned int> > >::_M_mbegin (159,315 samples, 0.02%)
ns3::LteEnbPhy::StartSubFrame (415,834 samples, 0.04%)
std::enable_if<is_invocable_r_v<void, ns3::Callback<void, std::__cxx11::list<ns3::Ptr<ns3::LteControlMessage>, std::allocator<ns3::Ptr<ns3::LteControlMessage> > > >::Callback<void (28,232,039 samples, 2.91%) s..
std::_Rb_tree<unsigned char, std::pair<unsigned char const, ns3::LteMacSapUser*>, std::_Select1st<std::pair<unsigned char const, ns3::LteMacSapUser*> >, std::less<unsigned char>, std::allocator<std::pair<unsigned char const, ns3::LteMacSapUser*> > >::_M_lower_bound (1,144,795 samples, 0.12%)
std::_Rb_tree_iterator<std::pair<ns3::TbId_t const, ns3::tbInfo_t> > std::map<ns3::TbId_t, ns3::tbInfo_t, std::less<ns3::TbId_t>, std::allocator<std::pair<ns3::TbId_t const, ns3::tbInfo_t> > >::emplace_hint<std::pair<ns3::TbId_t, ns3::tbInfo_t> > (143,473 samples, 0.01%)
std::_Bind<void (782,663 samples, 0.08%)
std::vector<std::__cxx11::list<ns3::Ptr<ns3::LteControlMessage>, std::allocator<ns3::Ptr<ns3::LteControlMessage> > >, std::allocator<std::__cxx11::list<ns3::Ptr<ns3::LteControlMessage>, std::allocator<ns3::Ptr<ns3::LteControlMessage> > > > >::_M_erase (1,544,641 samples, 0.16%)
std::_Rb_tree_node<std::pair<ns3::LteSpectrumModelId const, ns3::Ptr<ns3::SpectrumModel> > >::_M_valptr (234,452 samples, 0.02%)
ns3::LteRlcSpecificLteMacSapUser::NotifyTxOpportunity (4,972,136 samples, 0.51%)
ns3::EnbMemberLteEnbPhySapProvider::SendMacPdu (783,721 samples, 0.08%)
std::map<unsigned short, unsigned int, std::less<unsigned short>, std::allocator<std::pair<unsigned short const, unsigned int> > >::find (1,203,918 samples, 0.12%)
std::_Vector_base<ns3::Ptr<ns3::Object>, std::allocator<ns3::Ptr<ns3::Object> > >::_Vector_impl_data::_Vector_impl_data (154,775 samples, 0.02%)
std::__cxx11::list<ns3::Ptr<ns3::Packet>, std::allocator<ns3::Ptr<ns3::Packet> > >::clear (3,285,580 samples, 0.34%)
std::vector<unsigned char, std::allocator<unsigned char> >::vector (775,418 samples, 0.08%)
ns3::Ptr<ns3::NixVector>::Ptr (395,681 samples, 0.04%)
__gnu_cxx::__enable_if<std::__is_byte<unsigned char>::__value, void>::__type std::__fill_a1<unsigned char> (464,806 samples, 0.05%)
ns3::PacketBurst::DoDispose (262,214 samples, 0.03%)
ns3::SpectrumValue::operator/= (127,965 samples, 0.01%)
ns3::Ptr<ns3::SpectrumPhy>::Acquire (282,880 samples, 0.03%)
ns3::Ptr<ns3::PacketBurst>::operator (236,363 samples, 0.02%)
std::_Tuple_impl<1ul, ns3::Ptr<ns3::SpectrumValue>, double, ns3::Ptr<ns3::SpectrumSignalParameters>, ns3::Ptr<ns3::SpectrumPhy>, std::map<unsigned int, ns3::Ptr<ns3::SpectrumValue>, std::less<unsigned int>, std::allocator<std::pair<unsigned int const, ns3::Ptr<ns3::SpectrumValue> > > > >::~_Tuple_impl (4,562,243 samples, 0.47%)
std::vector<ns3::MacCeListElement_s, std::allocator<ns3::MacCeListElement_s> >::_M_check_len (366,216 samples, 0.04%)
ns3::TracedCallback<ns3::Ptr<ns3::PacketBurst const> >::operator (284,159 samples, 0.03%)
std::remove_reference<std::_Vector_base<unsigned char, std::allocator<unsigned char> >::_Vector_impl&>::type&& std::move<std::_Vector_base<unsigned char, std::allocator<unsigned char> >::_Vector_impl&> (130,561 samples, 0.01%)
std::_Rb_tree<unsigned short, std::pair<unsigned short const, std::vector<std::vector<ns3::HarqProcessInfoElement_t, std::allocator<ns3::HarqProcessInfoElement_t> >, std::allocator<std::vector<ns3::HarqProcessInfoElement_t, std::allocator<ns3::HarqProcessInfoElement_t> > > > >, std::_Select1st<std::pair<unsigned short const, std::vector<std::vector<ns3::HarqProcessInfoElement_t, std::allocator<ns3::HarqProcessInfoElement_t> >, std::allocator<std::vector<ns3::HarqProcessInfoElement_t, std::allocator<ns3::HarqProcessInfoElement_t> > > > > >, std::less<unsigned short>, std::allocator<std::pair<unsigned short const, std::vector<std::vector<ns3::HarqProcessInfoElement_t, std::allocator<ns3::HarqProcessInfoElement_t> >, std::allocator<std::vector<ns3::HarqProcessInfoElement_t, std::allocator<ns3::HarqProcessInfoElement_t> > > > > > >::_S_key (474,607 samples, 0.05%)
std::vector<signed char, std::allocator<signed char> >::_M_erase (208,683 samples, 0.02%)
std::_List_iterator<ns3::Ptr<ns3::Packet> >::_List_iterator (190,641 samples, 0.02%)
std::_Tuple_impl<5ul, std::map<unsigned int, ns3::Ptr<ns3::SpectrumValue>, std::less<unsigned int>, std::allocator<std::pair<unsigned int const, ns3::Ptr<ns3::SpectrumValue> > > > >::_Tuple_impl<std::map<unsigned int, ns3::Ptr<ns3::SpectrumValue>, std::less<unsigned int>, std::allocator<std::pair<unsigned int const, ns3::Ptr<ns3::SpectrumValue> > > >&> (163,911 samples, 0.02%)
std::_Tuple_impl<1ul, ns3::Ptr<ns3::SpectrumValue>, double, ns3::Ptr<ns3::SpectrumSignalParameters>, ns3::Ptr<ns3::SpectrumPhy>, std::map<unsigned int, ns3::Ptr<ns3::SpectrumValue>, std::less<unsigned int>, std::allocator<std::pair<unsigned int const, ns3::Ptr<ns3::SpectrumValue> > > > >::_Tuple_impl<ns3::Ptr<ns3::SpectrumValue>&, double&, ns3::Ptr<ns3::SpectrumSignalParameters>&, ns3::Ptr<ns3::SpectrumPhy>&, std::map<unsigned int, ns3::Ptr<ns3::SpectrumValue>, std::less<unsigned int>, std::allocator<std::pair<unsigned int const, ns3::Ptr<ns3::SpectrumValue> > > >&, void> (206,637 samples, 0.02%)
ns3::SimpleRefCount<ns3::SpectrumValue, ns3::Empty, ns3::DefaultDeleter<ns3::SpectrumValue> >::Unref (470,391 samples, 0.05%)
std::_Rb_tree_iterator<std::pair<int const, double> > std::_Rb_tree<int, std::pair<int const, double>, std::_Select1st<std::pair<int const, double> >, std::less<int>, std::allocator<std::pair<int const, double> > >::_M_emplace_hint_unique<std::pair<int, double> > (1,269,252 samples, 0.13%)
std::tuple_element<2ul, std::tuple<ns3::MultiModelSpectrumChannel*, ns3::Ptr<ns3::SpectrumValue>, double, ns3::Ptr<ns3::SpectrumSignalParameters>, ns3::Ptr<ns3::SpectrumPhy>, std::map<unsigned int, ns3::Ptr<ns3::SpectrumValue>, std::less<unsigned int>, std::allocator<std::pair<unsigned int const, ns3::Ptr<ns3::SpectrumValue> > > > > >::type& std::get<2ul, ns3::MultiModelSpectrumChannel*, ns3::Ptr<ns3::SpectrumValue>, double, ns3::Ptr<ns3::SpectrumSignalParameters>, ns3::Ptr<ns3::SpectrumPhy>, std::map<unsigned int, ns3::Ptr<ns3::SpectrumValue>, std::less<unsigned int>, std::allocator<std::pair<unsigned int const, ns3::Ptr<ns3::SpectrumValue> > > > > (473,819 samples, 0.05%)
unsigned char* std::__copy_move_a<false, __gnu_cxx::__normal_iterator<unsigned char const*, std::vector<unsigned char, std::allocator<unsigned char> > >, unsigned char*> (292,785 samples, 0.03%)
std::_Vector_base<double, std::allocator<double> >::~_Vector_base (167,250 samples, 0.02%)
__gnu_cxx::__aligned_membuf<std::pair<ns3::LteFlowId_t const, ns3::FfMacSchedSapProvider::SchedDlRlcBufferReqParameters> >::_M_ptr (151,492 samples, 0.02%)
ns3::PacketBurst::~PacketBurst (3,267,652 samples, 0.34%)
ns3::HigherLayerSelected_s* std::__copy_move<false, false, std::random_access_iterator_tag>::__copy_m<ns3::HigherLayerSelected_s const*, ns3::HigherLayerSelected_s*> (193,644 samples, 0.02%)
ns3::Time::ToDouble (693,056 samples, 0.07%)
int& std::forward<int&> (154,940 samples, 0.02%)
std::vector<unsigned char, std::allocator<unsigned char> >::vector (158,373 samples, 0.02%)
__gnu_cxx::__aligned_membuf<unsigned short>::_M_ptr (275,914 samples, 0.03%)
ns3::tbInfo_t::tbInfo_t (509,350 samples, 0.05%)
std::_Rb_tree<ns3::TbId_t, std::pair<ns3::TbId_t const, ns3::tbInfo_t>, std::_Select1st<std::pair<ns3::TbId_t const, ns3::tbInfo_t> >, std::less<ns3::TbId_t>, std::allocator<std::pair<ns3::TbId_t const, ns3::tbInfo_t> > >::_M_erase (1,924,737 samples, 0.20%)
unsigned long* std::__copy_move_a<false, unsigned long*, unsigned long*> (190,049 samples, 0.02%)
ns3::LteUeMac::DoSubframeIndication (16,576,198 samples, 1.71%)
void ns3::Callback<void, ns3::DlInfoListElement_s>::Callback<void (3,542,887 samples, 0.37%)
bool __gnu_cxx::operator==<double const*, std::vector<double, std::allocator<double> > > (229,110 samples, 0.02%)
ns3::Ptr<ns3::EventImpl>::~Ptr (390,370 samples, 0.04%)
ns3::Ptr<ns3::PacketBurst>* std::__copy_move<true, false, std::random_access_iterator_tag>::__copy_m<ns3::Ptr<ns3::PacketBurst>*, ns3::Ptr<ns3::PacketBurst>*> (458,200 samples, 0.05%)
ns3::CqiListElement_s::~CqiListElement_s (377,731 samples, 0.04%)
std::_Rb_tree<unsigned short, std::pair<unsigned short const, unsigned int>, std::_Select1st<std::pair<unsigned short const, unsigned int> >, std::less<unsigned short>, std::allocator<std::pair<unsigned short const, unsigned int> > >::clear (355,870 samples, 0.04%)
std::_Rb_tree<unsigned short, std::pair<unsigned short const, std::vector<unsigned char, std::allocator<unsigned char> > >, std::_Select1st<std::pair<unsigned short const, std::vector<unsigned char, std::allocator<unsigned char> > > >, std::less<unsigned short>, std::allocator<std::pair<unsigned short const, std::vector<unsigned char, std::allocator<unsigned char> > > > >::_M_lower_bound (725,002 samples, 0.07%)
std::_Rb_tree<unsigned char, std::pair<unsigned char const, ns3::LteMacSapProvider::ReportBufferStatusParameters>, std::_Select1st<std::pair<unsigned char const, ns3::LteMacSapProvider::ReportBufferStatusParameters> >, std::less<unsigned char>, std::allocator<std::pair<unsigned char const, ns3::LteMacSapProvider::ReportBufferStatusParameters> > >::find (1,345,383 samples, 0.14%)
std::__invoke_result<ns3::MakeEvent<> (238,924 samples, 0.02%)
ns3::SimpleRefCount<ns3::Packet, ns3::Empty, ns3::DefaultDeleter<ns3::Packet> >::Unref (161,302 samples, 0.02%)
std::_Rb_tree_node<std::pair<ns3::TbId_t const, ns3::tbInfo_t> >::_M_valptr (352,479 samples, 0.04%)
ns3::DlDciListElement_s::DlDciListElement_s (500,791 samples, 0.05%)
std::_Vector_base<unsigned int, std::allocator<unsigned int> >::_Vector_base (447,425 samples, 0.05%)
operator delete[] (204,130 samples, 0.02%)
std::map<ns3::Scheduler::EventKey, ns3::EventImpl*, std::less<ns3::Scheduler::EventKey>, std::allocator<std::pair<ns3::Scheduler::EventKey const, ns3::EventImpl*> > >::lower_bound (1,750,547 samples, 0.18%)
unsigned char* std::__copy_move_a1<false, unsigned char const*, unsigned char*> (185,651 samples, 0.02%)
std::pair<ns3::TbId_t, ns3::tbInfo_t>::pair<ns3::TbId_t&, ns3::tbInfo_t&> (217,947 samples, 0.02%)
__gnu_cxx::__normal_iterator<double*, std::vector<double, std::allocator<double> > > std::__copy_move_a<false, __gnu_cxx::__normal_iterator<double const*, std::vector<double, std::allocator<double> > >, __gnu_cxx::__normal_iterator<double*, std::vector<double, std::allocator<double> > > > (507,555 samples, 0.05%)
unsigned int const& std::max<unsigned int> (238,645 samples, 0.02%)
std::set<unsigned short, std::less<unsigned short>, std::allocator<unsigned short> >::find (495,883 samples, 0.05%)
std::vector<ns3::Ptr<ns3::Object>, std::allocator<ns3::Ptr<ns3::Object> > >::vector (350,110 samples, 0.04%)
ns3::CallbackImpl<void, ns3::DlInfoListElement_s>::operator (4,219,650 samples, 0.44%)
void std::_Rb_tree<ns3::TbId_t, std::pair<ns3::TbId_t const, ns3::tbInfo_t>, std::_Select1st<std::pair<ns3::TbId_t const, ns3::tbInfo_t> >, std::less<ns3::TbId_t>, std::allocator<std::pair<ns3::TbId_t const, ns3::tbInfo_t> > >::_M_construct_node<std::pair<ns3::TbId_t, ns3::tbInfo_t> > (1,227,522 samples, 0.13%)
std::function<void (324,769 samples, 0.03%)
__gnu_cxx::__aligned_membuf<ns3::Ptr<ns3::LteControlMessage> >::_M_ptr (192,658 samples, 0.02%)
ns3::Buffer::Recycle (663,612 samples, 0.07%)
std::_Rb_tree<unsigned short, std::pair<unsigned short const, std::vector<double, std::allocator<double> > >, std::_Select1st<std::pair<unsigned short const, std::vector<double, std::allocator<double> > > >, std::less<unsigned short>, std::allocator<std::pair<unsigned short const, std::vector<double, std::allocator<double> > > > >::_M_erase (704,923 samples, 0.07%)
std::_Rb_tree<ns3::Scheduler::EventKey, std::pair<ns3::Scheduler::EventKey const, ns3::EventImpl*>, std::_Select1st<std::pair<ns3::Scheduler::EventKey const, ns3::EventImpl*> >, std::less<ns3::Scheduler::EventKey>, std::allocator<std::pair<ns3::Scheduler::EventKey const, ns3::EventImpl*> > >::_Auto_node::_M_insert (391,675 samples, 0.04%)
std::allocator<int>::allocate (127,251 samples, 0.01%)
ns3::HigherLayerSelected_s::HigherLayerSelected_s (323,441 samples, 0.03%)
__gnu_cxx::__aligned_membuf<std::pair<unsigned short const, std::vector<ns3::DlDciListElement_s, std::allocator<ns3::DlDciListElement_s> > > >::_M_addr (155,689 samples, 0.02%)
ns3::DlInfoListElement_s* std::__do_uninit_copy<__gnu_cxx::__normal_iterator<ns3::DlInfoListElement_s const*, std::vector<ns3::DlInfoListElement_s, std::allocator<ns3::DlInfoListElement_s> > >, ns3::DlInfoListElement_s*> (411,592 samples, 0.04%)
decltype (240,540 samples, 0.02%)
std::_Rb_tree_node<std::pair<unsigned int const, ns3::TxSpectrumModelInfo> >::_M_valptr (221,148 samples, 0.02%)
void std::_Function_base::_Base_manager<std::_Bind<void (411,266 samples, 0.04%)
std::_Rb_tree_iterator<std::pair<unsigned short const, std::vector<unsigned short, std::allocator<unsigned short> > > > std::_Rb_tree<unsigned short, std::pair<unsigned short const, std::vector<unsigned short, std::allocator<unsigned short> > >, std::_Select1st<std::pair<unsigned short const, std::vector<unsigned short, std::allocator<unsigned short> > > >, std::less<unsigned short>, std::allocator<std::pair<unsigned short const, std::vector<unsigned short, std::allocator<unsigned short> > > > >::_M_emplace_hint_unique<std::piecewise_construct_t const&, std::tuple<unsigned short const&>, std::tuple<> > (299,849 samples, 0.03%)
ns3::Ptr<ns3::EventImpl>::operator= (572,810 samples, 0.06%)
__cxxabiv1::__si_class_type_info::__do_dyncast (128,525 samples, 0.01%)
ns3::PacketTagList::Add (190,338 samples, 0.02%)
ns3::TracedCallback<ns3::Ptr<ns3::SpectrumSignalParameters> >::operator (312,772 samples, 0.03%)
__gnu_cxx::__normal_iterator<ns3::Ptr<ns3::PacketBurst>*, std::vector<ns3::Ptr<ns3::PacketBurst>, std::allocator<ns3::Ptr<ns3::PacketBurst> > > > std::move<__gnu_cxx::__normal_iterator<ns3::Ptr<ns3::PacketBurst>*, std::vector<ns3::Ptr<ns3::PacketBurst>, std::allocator<ns3::Ptr<ns3::PacketBurst> > > >, __gnu_cxx::__normal_iterator<ns3::Ptr<ns3::PacketBurst>*, std::vector<ns3::Ptr<ns3::PacketBurst>, std::allocator<ns3::Ptr<ns3::PacketBurst> > > > > (6,507,760 samples, 0.67%)
std::vector<int, std::allocator<int> >::at (645,472 samples, 0.07%)
std::_Rb_tree_key_compare<std::less<unsigned short> >::_Rb_tree_key_compare (234,753 samples, 0.02%)
void std::__cxx11::list<ns3::Ptr<ns3::LteControlMessage>, std::allocator<ns3::Ptr<ns3::LteControlMessage> > >::_M_initialize_dispatch<std::_List_const_iterator<ns3::Ptr<ns3::LteControlMessage> > > (1,438,361 samples, 0.15%)
ns3::DlInfoListElement_s::HarqStatus_e* std::copy<std::move_iterator<ns3::DlInfoListElement_s::HarqStatus_e*>, ns3::DlInfoListElement_s::HarqStatus_e*> (267,517 samples, 0.03%)
ns3::UniformRandomVariable::GetValue (789,202 samples, 0.08%)
std::__cxx11::list<ns3::Ptr<ns3::LteControlMessage>, std::allocator<ns3::Ptr<ns3::LteControlMessage> > >::clear (265,487 samples, 0.03%)
ns3::MacCeValue_u::MacCeValue_u (858,457 samples, 0.09%)
void std::__cxx11::list<ns3::Ptr<ns3::LteControlMessage>, std::allocator<ns3::Ptr<ns3::LteControlMessage> > >::_M_initialize_dispatch<std::_List_const_iterator<ns3::Ptr<ns3::LteControlMessage> > > (216,051 samples, 0.02%)
ns3::Ptr<ns3::PacketBurst> ns3::CompleteConstruct<ns3::PacketBurst> (2,140,117 samples, 0.22%)
std::__cxx11::list<ns3::Ptr<ns3::Packet>, std::allocator<ns3::Ptr<ns3::Packet> > >::clear (154,782 samples, 0.02%)
(124,340 samples, 0.01%)
std::vector<double, std::allocator<double> >::~vector (241,102 samples, 0.02%)
std::vector<std::vector<ns3::RlcPduListElement_s, std::allocator<ns3::RlcPduListElement_s> >, std::allocator<std::vector<ns3::RlcPduListElement_s, std::allocator<ns3::RlcPduListElement_s> > > >::_S_relocate (199,707 samples, 0.02%)
ns3::HarqProcessInfoElement_t* std::__copy_move<false, true, std::random_access_iterator_tag>::__copy_m<ns3::HarqProcessInfoElement_t const, ns3::HarqProcessInfoElement_t> (368,034 samples, 0.04%)
void std::_Destroy<ns3::CqiListElement_s> (933,761 samples, 0.10%)
ns3::LteInterference::EndRx (23,269,983 samples, 2.40%)
void std::vector<int, std::allocator<int> >::_M_realloc_insert<int const&> (336,155 samples, 0.03%)
std::allocator_traits<std::allocator<std::_Rb_tree_node<std::pair<int const, double> > > >::allocate (199,176 samples, 0.02%)
ns3::DefaultDeleter<ns3::SpectrumValue>::Delete (392,749 samples, 0.04%)
std::_Rb_tree<unsigned short, std::pair<unsigned short const, std::vector<double, std::allocator<double> > >, std::_Select1st<std::pair<unsigned short const, std::vector<double, std::allocator<double> > > >, std::less<unsigned short>, std::allocator<std::pair<unsigned short const, std::vector<double, std::allocator<double> > > > >::_M_erase (231,712 samples, 0.02%)
std::_Rb_tree<int, std::pair<int const, double>, std::_Select1st<std::pair<int const, double> >, std::less<int>, std::allocator<std::pair<int const, double> > >::_S_key (429,986 samples, 0.04%)
ns3::LteSpectrumPhy::StartTxDlCtrlFrame (52,866,048 samples, 5.45%) ns3:..
std::vector<int, std::allocator<int> >::push_back (263,413 samples, 0.03%)
std::_Rb_tree<unsigned int, std::pair<unsigned int const, ns3::TxSpectrumModelInfo>, std::_Select1st<std::pair<unsigned int const, ns3::TxSpectrumModelInfo> >, std::less<unsigned int>, std::allocator<std::pair<unsigned int const, ns3::TxSpectrumModelInfo> > >::end (149,904 samples, 0.02%)
ns3::RlcPduListElement_s* std::__uninitialized_copy_a<__gnu_cxx::__normal_iterator<ns3::RlcPduListElement_s const*, std::vector<ns3::RlcPduListElement_s, std::allocator<ns3::RlcPduListElement_s> > >, ns3::RlcPduListElement_s*, ns3::RlcPduListElement_s> (1,020,771 samples, 0.11%)
(353,348 samples, 0.04%)
std::_Rb_tree_node<std::pair<unsigned int const, ns3::RxSpectrumModelInfo> >::_M_valptr (415,198 samples, 0.04%)
ns3::Ptr<ns3::EventImpl>::Acquire (195,822 samples, 0.02%)
std::__cxx11::list<ns3::Callback<void, unsigned short, unsigned short, double>, std::allocator<ns3::Callback<void, unsigned short, unsigned short, double> > >::begin (274,474 samples, 0.03%)
std::_Rb_tree<unsigned short, std::pair<unsigned short const, ns3::LteEnbComponentCarrierManager::UeInfo>, std::_Select1st<std::pair<unsigned short const, ns3::LteEnbComponentCarrierManager::UeInfo> >, std::less<unsigned short>, std::allocator<std::pair<unsigned short const, ns3::LteEnbComponentCarrierManager::UeInfo> > >::_S_key (775,617 samples, 0.08%)
ns3::Ptr<ns3::SpectrumPhy>::Ptr (359,569 samples, 0.04%)
std::vector<ns3::DlDciListElement_s, std::allocator<ns3::DlDciListElement_s> >::at (514,866 samples, 0.05%)
std::_Bind<void (1,733,420 samples, 0.18%)
ns3::SpectrumValue::SpectrumValue (152,703 samples, 0.02%)
__gnu_cxx::__normal_iterator<double*, std::vector<double, std::allocator<double> > > std::copy<__gnu_cxx::__normal_iterator<double const*, std::vector<double, std::allocator<double> > >, __gnu_cxx::__normal_iterator<double*, std::vector<double, std::allocator<double> > > > (307,652 samples, 0.03%)
std::_Function_handler<void (19,740,362 samples, 2.04%)
ns3::NoOpComponentCarrierManager::DoNotifyTxOpportunity (4,972,136 samples, 0.51%)
ns3::Ptr<ns3::SpectrumValue>::operator= (512,892 samples, 0.05%)
std::vector<std::vector<ns3::HarqProcessInfoElement_t, std::allocator<ns3::HarqProcessInfoElement_t> >, std::allocator<std::vector<ns3::HarqProcessInfoElement_t, std::allocator<ns3::HarqProcessInfoElement_t> > > >::at (139,701 samples, 0.01%)
std::_Rb_tree<unsigned char, std::pair<unsigned char const, ns3::LteMacSapProvider::ReportBufferStatusParameters>, std::_Select1st<std::pair<unsigned char const, ns3::LteMacSapProvider::ReportBufferStatusParameters> >, std::less<unsigned char>, std::allocator<std::pair<unsigned char const, ns3::LteMacSapProvider::ReportBufferStatusParameters> > >::_M_begin (234,350 samples, 0.02%)
std::operator== (210,233 samples, 0.02%)
std::_Vector_base<ns3::Ptr<ns3::Object>, std::allocator<ns3::Ptr<ns3::Object> > >::_Vector_base (420,986 samples, 0.04%)
double* std::__copy_move_a<false, __gnu_cxx::__normal_iterator<double const*, std::vector<double, std::allocator<double> > >, double*> (456,050 samples, 0.05%)
void std::destroy_at<ns3::Ptr<ns3::Packet> > (1,191,133 samples, 0.12%)
void std::allocator_traits<std::allocator<ns3::ByteTagListData*> >::destroy<ns3::ByteTagListData*> (350,982 samples, 0.04%)
std::__cxx11::list<ns3::Callback<void, unsigned short, ns3::Ptr<ns3::SpectrumValue> >, std::allocator<ns3::Callback<void, unsigned short, ns3::Ptr<ns3::SpectrumValue> > > >::end (207,421 samples, 0.02%)
std::vector<ns3::ByteTagListData*, std::allocator<ns3::ByteTagListData*> >::empty (455,493 samples, 0.05%)
std::__cxx11::list<ns3::Callback<void, unsigned short, ns3::Ptr<ns3::SpectrumValue> >, std::allocator<ns3::Callback<void, unsigned short, ns3::Ptr<ns3::SpectrumValue> > > >::begin (189,841 samples, 0.02%)
__gnu_cxx::__normal_iterator<unsigned char const*, std::vector<unsigned char, std::allocator<unsigned char> > >::__normal_iterator (229,352 samples, 0.02%)
ns3::TracedCallback<unsigned short, ns3::Ptr<ns3::SpectrumValue> >::operator (538,849 samples, 0.06%)
std::__cxx11::_List_base<ns3::Ptr<ns3::Packet>, std::allocator<ns3::Ptr<ns3::Packet> > >::_M_get_node (655,781 samples, 0.07%)
std::_Rb_tree<int, std::pair<int const, double>, std::_Select1st<std::pair<int const, double> >, std::less<int>, std::allocator<std::pair<int const, double> > >::_M_insert_node (196,868 samples, 0.02%)
double* std::copy<__gnu_cxx::__normal_iterator<double const*, std::vector<double, std::allocator<double> > >, double*> (165,918 samples, 0.02%)
std::_Rb_tree<unsigned short, std::pair<unsigned short const, std::vector<double, std::allocator<double> > >, std::_Select1st<std::pair<unsigned short const, std::vector<double, std::allocator<double> > > >, std::less<unsigned short>, std::allocator<std::pair<unsigned short const, std::vector<double, std::allocator<double> > > > >::_M_copy (4,538,330 samples, 0.47%)
std::_Rb_tree_node<std::pair<unsigned short const, std::vector<double, std::allocator<double> > > >* std::_Rb_tree<unsigned short, std::pair<unsigned short const, std::vector<double, std::allocator<double> > >, std::_Select1st<std::pair<unsigned short const, std::vector<double, std::allocator<double> > > >, std::less<unsigned short>, std::allocator<std::pair<unsigned short const, std::vector<double, std::allocator<double> > > > >::_M_copy<false, std::_Rb_tree<unsigned short, std::pair<unsigned short const, std::vector<double, std::allocator<double> > >, std::_Select1st<std::pair<unsigned short const, std::vector<double, std::allocator<double> > > >, std::less<unsigned short>, std::allocator<std::pair<unsigned short const, std::vector<double, std::allocator<double> > > > >::_Alloc_node> (347,372 samples, 0.04%)
std::_Head_base<5ul, std::map<unsigned int, ns3::Ptr<ns3::SpectrumValue>, std::less<unsigned int>, std::allocator<std::pair<unsigned int const, ns3::Ptr<ns3::SpectrumValue> > > >, false>::~_Head_base (220,721 samples, 0.02%)
unsigned short* std::__relocate_a<unsigned short*, unsigned short*, std::allocator<unsigned short> > (196,177 samples, 0.02%)
std::_Rb_tree<unsigned short, std::pair<unsigned short const, std::vector<double, std::allocator<double> > >, std::_Select1st<std::pair<unsigned short const, std::vector<double, std::allocator<double> > > >, std::less<unsigned short>, std::allocator<std::pair<unsigned short const, std::vector<double, std::allocator<double> > > > >::_S_key (400,281 samples, 0.04%)
std::_List_node<ns3::Ptr<ns3::LteControlMessage> >* std::__cxx11::list<ns3::Ptr<ns3::LteControlMessage>, std::allocator<ns3::Ptr<ns3::LteControlMessage> > >::_M_create_node<ns3::Ptr<ns3::LteControlMessage> const&> (530,447 samples, 0.05%)
std::_Tuple_impl<1ul, ns3::Ptr<ns3::SpectrumValue const>, unsigned int>::~_Tuple_impl (370,840 samples, 0.04%)
std::allocator_traits<std::allocator<std::_Rb_tree_node<std::pair<ns3::Scheduler::EventKey const, ns3::EventImpl*> > > >::allocate (163,549 samples, 0.02%)
std::map<unsigned char, ns3::LteMacSapUser*, std::less<unsigned char>, std::allocator<std::pair<unsigned char const, ns3::LteMacSapUser*> > >::find (1,336,082 samples, 0.14%)
std::__cxx11::_List_base<ns3::Ptr<ns3::Packet>, std::allocator<ns3::Ptr<ns3::Packet> > >::_M_clear (182,893 samples, 0.02%)
void std::__cxx11::list<ns3::Ptr<ns3::LteControlMessage>, std::allocator<ns3::Ptr<ns3::LteControlMessage> > >::_M_insert<ns3::Ptr<ns3::LteControlMessage> const&> (228,584 samples, 0.02%)
ns3::Simulator::DoSchedule (1,698,311 samples, 0.18%)
ns3::ByteTagList::Deallocate (267,431 samples, 0.03%)
ns3::SpectrumValue::Divide (414,550 samples, 0.04%)
std::_Tuple_impl<5ul, std::map<unsigned int, ns3::Ptr<ns3::SpectrumValue>, std::less<unsigned int>, std::allocator<std::pair<unsigned int const, ns3::Ptr<ns3::SpectrumValue> > > > >::_Tuple_impl (152,827 samples, 0.02%)
std::_Rb_tree<unsigned short, std::pair<unsigned short const, std::vector<unsigned char, std::allocator<unsigned char> > >, std::_Select1st<std::pair<unsigned short const, std::vector<unsigned char, std::allocator<unsigned char> > > >, std::less<unsigned short>, std::allocator<std::pair<unsigned short const, std::vector<unsigned char, std::allocator<unsigned char> > > > >::_S_key (552,579 samples, 0.06%)
std::allocator<unsigned int>::deallocate (227,074 samples, 0.02%)
std::_Vector_base<unsigned short, std::allocator<unsigned short> >::_M_create_storage (578,790 samples, 0.06%)
ns3::BuildRarListElement_s* std::__uninitialized_copy_a<__gnu_cxx::__normal_iterator<ns3::BuildRarListElement_s const*, std::vector<ns3::BuildRarListElement_s, std::allocator<ns3::BuildRarListElement_s> > >, ns3::BuildRarListElement_s*, ns3::BuildRarListElement_s> (278,330 samples, 0.03%)
ns3::FfMacSchedSapUser::SchedDlConfigIndParameters::SchedDlConfigIndParameters (155,354 samples, 0.02%)
std::vector<std::vector<ns3::HarqProcessInfoElement_t, std::allocator<ns3::HarqProcessInfoElement_t> >, std::allocator<std::vector<ns3::HarqProcessInfoElement_t, std::allocator<ns3::HarqProcessInfoElement_t> > > >::_M_range_check (426,031 samples, 0.04%)
[libm.so.6] (277,109 samples, 0.03%)
ns3::ByteTagIterator::HasNext (236,780 samples, 0.02%)
double& std::_Mu<double, false, false>::operator (202,203 samples, 0.02%)
std::allocator<double>::allocate (530,824 samples, 0.05%)
std::_Vector_base<double, std::allocator<double> >::_Vector_base (211,429 samples, 0.02%)
std::vector<ns3::CqiListElement_s, std::allocator<ns3::CqiListElement_s> >::end (201,936 samples, 0.02%)
unsigned char* std::__uninitialized_copy_a<__gnu_cxx::__normal_iterator<unsigned char const*, std::vector<unsigned char, std::allocator<unsigned char> > >, unsigned char*, unsigned char> (223,250 samples, 0.02%)
std::map<unsigned char, std::map<unsigned char, ns3::LteMacSapProvider*, std::less<unsigned char>, std::allocator<std::pair<unsigned char const, ns3::LteMacSapProvider*> > >, std::less<unsigned char>, std::allocator<std::pair<unsigned char const, std::map<unsigned char, ns3::LteMacSapProvider*, std::less<unsigned char>, std::allocator<std::pair<unsigned char const, ns3::LteMacSapProvider*> > > > > >::begin (204,131 samples, 0.02%)
std::_Rb_tree<int, std::pair<int const, double>, std::_Select1st<std::pair<int const, double> >, std::less<int>, std::allocator<std::pair<int const, double> > >::_M_erase (637,679 samples, 0.07%)
std::_Rb_tree_iterator<std::pair<unsigned int const, ns3::Ptr<ns3::SpectrumValue> > > std::map<unsigned int, ns3::Ptr<ns3::SpectrumValue>, std::less<unsigned int>, std::allocator<std::pair<unsigned int const, ns3::Ptr<ns3::SpectrumValue> > > >::emplace_hint<unsigned int const&, ns3::Ptr<ns3::SpectrumValue>&> (838,836 samples, 0.09%)
std::allocator<double>::deallocate (163,066 samples, 0.02%)
std::_Rb_tree<unsigned int, std::pair<unsigned int const, ns3::Ptr<ns3::SpectrumValue> >, std::_Select1st<std::pair<unsigned int const, ns3::Ptr<ns3::SpectrumValue> > >, std::less<unsigned int>, std::allocator<std::pair<unsigned int const, ns3::Ptr<ns3::SpectrumValue> > > >::_M_copy (878,011 samples, 0.09%)
ns3::RlcTag::GetInstanceTypeId (313,712 samples, 0.03%)
ns3::Ptr<ns3::SpectrumValue> ns3::Create<ns3::SpectrumValue, ns3::Ptr<ns3::SpectrumModel>&> (1,854,475 samples, 0.19%)
__gnu_cxx::__aligned_membuf<std::pair<unsigned short const, ns3::LteEnbComponentCarrierManager::UeInfo> >::_M_addr (124,878 samples, 0.01%)
ns3::LteSpectrumSignalParametersDataFrame::LteSpectrumSignalParametersDataFrame (1,082,844 samples, 0.11%)
ns3::PacketBurst::PacketBurst (495,532 samples, 0.05%)
std::vector<ns3::Ptr<ns3::PacketBurst>, std::allocator<ns3::Ptr<ns3::PacketBurst> > >::cbegin (384,549 samples, 0.04%)
std::_Rb_tree<unsigned short, std::pair<unsigned short const, ns3::LteUePhy::UeMeasurementsElement>, std::_Select1st<std::pair<unsigned short const, ns3::LteUePhy::UeMeasurementsElement> >, std::less<unsigned short>, std::allocator<std::pair<unsigned short const, ns3::LteUePhy::UeMeasurementsElement> > >::find (162,761 samples, 0.02%)
ns3::LteSpectrumPhy*& std::_Mu<ns3::LteSpectrumPhy*, false, false>::operator (199,187 samples, 0.02%)
std::vector<unsigned char, std::allocator<unsigned char> >::operator= (193,644 samples, 0.02%)
std::_Rb_tree_iterator<std::pair<unsigned short const, ns3::LteEnbComponentCarrierManager::UeInfo> >::operator* (379,355 samples, 0.04%)
unsigned long const& std::min<unsigned long> (156,731 samples, 0.02%)
std::allocator<ns3::DlInfoListElement_s>::allocate (265,191 samples, 0.03%)
std::_Rb_tree<int, std::pair<int const, double>, std::_Select1st<std::pair<int const, double> >, std::less<int>, std::allocator<std::pair<int const, double> > >::~_Rb_tree (763,268 samples, 0.08%)
std::vector<ns3::CeBitmap_e, std::allocator<ns3::CeBitmap_e> >::end (267,288 samples, 0.03%)
ns3::Simulator::DoSchedule (1,482,842 samples, 0.15%)
ns3::BufferSizeLevelBsr::BsrId2BufferSize (237,172 samples, 0.02%)
std::_Rb_tree_node<std::pair<unsigned char const, ns3::LteMacSapUser*> >::_M_valptr (126,162 samples, 0.01%)
ns3::HarqProcessInfoElement_t* std::__uninitialized_copy<true>::__uninit_copy<__gnu_cxx::__normal_iterator<ns3::HarqProcessInfoElement_t const*, std::vector<ns3::HarqProcessInfoElement_t, std::allocator<ns3::HarqProcessInfoElement_t> > >, ns3::HarqProcessInfoElement_t*> (1,453,727 samples, 0.15%)
ns3::DefaultSimulatorImpl::ScheduleWithContext (7,958,779 samples, 0.82%)
ns3::Callback<void, ns3::UlInfoListElement_s>::Callback<void (249,755 samples, 0.03%)
std::_Rb_tree<ns3::Scheduler::EventKey, std::pair<ns3::Scheduler::EventKey const, ns3::EventImpl*>, std::_Select1st<std::pair<ns3::Scheduler::EventKey const, ns3::EventImpl*> >, std::less<ns3::Scheduler::EventKey>, std::allocator<std::pair<ns3::Scheduler::EventKey const, ns3::EventImpl*> > >::lower_bound (567,494 samples, 0.06%)
std::map<ns3::Scheduler::EventKey, ns3::EventImpl*, std::less<ns3::Scheduler::EventKey>, std::allocator<std::pair<ns3::Scheduler::EventKey const, ns3::EventImpl*> > >::empty (712,405 samples, 0.07%)
__gnu_cxx::__normal_iterator<std::__cxx11::list<ns3::Ptr<ns3::LteControlMessage>, std::allocator<ns3::Ptr<ns3::LteControlMessage> > >*, std::vector<std::__cxx11::list<ns3::Ptr<ns3::LteControlMessage>, std::allocator<ns3::Ptr<ns3::LteControlMessage> > >, std::allocator<std::__cxx11::list<ns3::Ptr<ns3::LteControlMessage>, std::allocator<ns3::Ptr<ns3::LteControlMessage> > > > > >::operator+ (160,323 samples, 0.02%)
std::vector<unsigned short, std::allocator<unsigned short> >::max_size (230,324 samples, 0.02%)
void std::_Destroy_aux<true>::__destroy<unsigned short*> (155,477 samples, 0.02%)
std::vector<double, std::allocator<double> >::vector (631,882 samples, 0.07%)
ns3::Vector3D::GetLength (361,586 samples, 0.04%)
ns3::Ptr<ns3::SpectrumChannel>::operator bool (155,807 samples, 0.02%)
std::__cxx11::list<ns3::Ptr<ns3::Packet>, std::allocator<ns3::Ptr<ns3::Packet> > >::clear (467,457 samples, 0.05%)
std::vector<ns3::Ptr<ns3::PacketBurst>, std::allocator<ns3::Ptr<ns3::PacketBurst> > >::erase (616,017 samples, 0.06%)
std::vector<std::__cxx11::list<ns3::Ptr<ns3::LteControlMessage>, std::allocator<ns3::Ptr<ns3::LteControlMessage> > >, std::allocator<std::__cxx11::list<ns3::Ptr<ns3::LteControlMessage>, std::allocator<ns3::Ptr<ns3::LteControlMessage> > > > >::_M_range_check (190,527 samples, 0.02%)
std::enable_if<std::is_constructible<std::pair<ns3::Scheduler::EventKey const, ns3::EventImpl*>, std::pair<ns3::Scheduler::EventKey, ns3::EventImpl*> >::value, std::pair<std::_Rb_tree_iterator<std::pair<ns3::Scheduler::EventKey const, ns3::EventImpl*> >, bool> >::type std::map<ns3::Scheduler::EventKey, ns3::EventImpl*, std::less<ns3::Scheduler::EventKey>, std::allocator<std::pair<ns3::Scheduler::EventKey const, ns3::EventImpl*> > >::insert<std::pair<ns3::Scheduler::EventKey, ns3::EventImpl*> > (239,679 samples, 0.02%)
std::_Rb_tree<unsigned int, std::pair<unsigned int const, ns3::Ptr<ns3::SpectrumValue> >, std::_Select1st<std::pair<unsigned int const, ns3::Ptr<ns3::SpectrumValue> > >, std::less<unsigned int>, std::allocator<std::pair<unsigned int const, ns3::Ptr<ns3::SpectrumValue> > > >::_M_copy (155,456 samples, 0.02%)
std::_Bvector_base<std::allocator<bool> >::~_Bvector_base (545,023 samples, 0.06%)
__gnu_cxx::__aligned_membuf<ns3::Ptr<ns3::Packet> >::_M_ptr (396,644 samples, 0.04%)
std::map<unsigned short, std::vector<unsigned short, std::allocator<unsigned short> >, std::less<unsigned short>, std::allocator<std::pair<unsigned short const, std::vector<unsigned short, std::allocator<unsigned short> > > > >::~map (148,912 samples, 0.02%)
unsigned char* std::__copy_move_a1<false, unsigned char const*, unsigned char*> (149,127 samples, 0.02%)
std::__cxx11::list<ns3::UlDciLteControlMessage, std::allocator<ns3::UlDciLteControlMessage> >* std::__copy_move_a2<true, std::__cxx11::list<ns3::UlDciLteControlMessage, std::allocator<ns3::UlDciLteControlMessage> >*, std::__cxx11::list<ns3::UlDciLteControlMessage, std::allocator<ns3::UlDciLteControlMessage> >*> (1,623,419 samples, 0.17%)
main (2,105,662 samples, 0.22%)
void std::allocator_traits<std::allocator<std::_List_node<ns3::Ptr<ns3::Packet> > > >::destroy<ns3::Ptr<ns3::Packet> > (521,712 samples, 0.05%)
ns3::NoOpComponentCarrierManager::DoUlReceiveMacCe (4,513,254 samples, 0.47%)
ns3::UeSelected_s::operator= (241,903 samples, 0.02%)
ns3::LteUePhy::RlfDetection (610,186 samples, 0.06%)
ns3::VendorSpecificListElement_s* std::uninitialized_copy<__gnu_cxx::__normal_iterator<ns3::VendorSpecificListElement_s const*, std::vector<ns3::VendorSpecificListElement_s, std::allocator<ns3::VendorSpecificListElement_s> > >, ns3::VendorSpecificListElement_s*> (598,518 samples, 0.06%)
ns3::LteEnbRrc::GetUeManager (297,730 samples, 0.03%)
std::__new_allocator<double>::deallocate (163,066 samples, 0.02%)
ns3::Time::To (446,431 samples, 0.05%)
ns3::ByteTagList::Deallocate (675,876 samples, 0.07%)
ns3::PacketMetadata::Deallocate (241,216 samples, 0.02%)
void std::allocator_traits<std::allocator<ns3::ByteTagListData*> >::construct<ns3::ByteTagListData*, ns3::ByteTagListData* const&> (320,897 samples, 0.03%)
ns3::SpectrumSignalParameters* ns3::PeekPointer<ns3::SpectrumSignalParameters> (161,138 samples, 0.02%)
std::vector<double, std::allocator<double> >::~vector (159,560 samples, 0.02%)
unsigned char* std::copy<__gnu_cxx::__normal_iterator<unsigned char const*, std::vector<unsigned char, std::allocator<unsigned char> > >, unsigned char*> (330,967 samples, 0.03%)
std::_Vector_base<int, std::allocator<int> >::~_Vector_base (157,700 samples, 0.02%)
void std::_Construct<ns3::CqiListElement_s, ns3::CqiListElement_s&> (968,712 samples, 0.10%)
ns3::Simulator::Run (922,121,412 samples, 95.09%) ns3::Simulator::Run
__gnu_cxx::__aligned_membuf<ns3::Ptr<ns3::LteControlMessage> >::_M_ptr (315,999 samples, 0.03%)
ns3::Ptr<ns3::PacketBurst>* std::__copy_move_a2<true, ns3::Ptr<ns3::PacketBurst>*, ns3::Ptr<ns3::PacketBurst>*> (1,973,200 samples, 0.20%)
std::_Tuple_impl<0ul, ns3::MultiModelSpectrumChannel*, ns3::Ptr<ns3::SpectrumValue>, double, ns3::Ptr<ns3::SpectrumSignalParameters>, ns3::Ptr<ns3::SpectrumPhy>, std::map<unsigned int, ns3::Ptr<ns3::SpectrumValue>, std::less<unsigned int>, std::allocator<std::pair<unsigned int const, ns3::Ptr<ns3::SpectrumValue> > > > >::_Tuple_impl<ns3::MultiModelSpectrumChannel*&, ns3::Ptr<ns3::SpectrumValue>&, double&, ns3::Ptr<ns3::SpectrumSignalParameters>&, ns3::Ptr<ns3::SpectrumPhy>&, std::map<unsigned int, ns3::Ptr<ns3::SpectrumValue>, std::less<unsigned int>, std::allocator<std::pair<unsigned int const, ns3::Ptr<ns3::SpectrumValue> > > >&, void> (206,637 samples, 0.02%)
std::_Vector_base<double, std::allocator<double> >::_M_create_storage (162,839 samples, 0.02%)
std::_Rb_tree_iterator<std::pair<ns3::Scheduler::EventKey const, ns3::EventImpl*> > std::map<ns3::Scheduler::EventKey, ns3::EventImpl*, std::less<ns3::Scheduler::EventKey>, std::allocator<std::pair<ns3::Scheduler::EventKey const, ns3::EventImpl*> > >::emplace_hint<std::pair<ns3::Scheduler::EventKey, ns3::EventImpl*> > (1,461,013 samples, 0.15%)
__gnu_cxx::__normal_iterator<unsigned char*, std::vector<unsigned char, std::allocator<unsigned char> > > std::__copy_move_a<false, __gnu_cxx::__normal_iterator<unsigned char const*, std::vector<unsigned char, std::allocator<unsigned char> > >, __gnu_cxx::__normal_iterator<unsigned char*, std::vector<unsigned char, std::allocator<unsigned char> > > > (155,513 samples, 0.02%)
ns3::Buffer::~Buffer (158,245 samples, 0.02%)
ns3::Ptr<ns3::SpectrumValue>::Ptr (302,852 samples, 0.03%)
ns3::SimpleRefCount<ns3::Object, ns3::ObjectBase, ns3::ObjectDeleter>::Unref (5,067,937 samples, 0.52%)
ns3::SimpleUeComponentCarrierManager::DoReportBufferStatus (1,164,381 samples, 0.12%)
std::tuple<ns3::MultiModelSpectrumChannel*, ns3::Ptr<ns3::SpectrumValue>, double, ns3::Ptr<ns3::SpectrumSignalParameters>, ns3::Ptr<ns3::SpectrumPhy>, std::map<unsigned int, ns3::Ptr<ns3::SpectrumValue>, std::less<unsigned int>, std::allocator<std::pair<unsigned int const, ns3::Ptr<ns3::SpectrumValue> > > > >::~tuple (4,562,243 samples, 0.47%)
ns3::UlDciListElement_s* std::__do_uninit_copy<__gnu_cxx::__normal_iterator<ns3::UlDciListElement_s const*, std::vector<ns3::UlDciListElement_s, std::allocator<ns3::UlDciListElement_s> > >, ns3::UlDciListElement_s*> (160,843 samples, 0.02%)
std::_List_const_iterator<ns3::Ptr<ns3::Packet> >::operator* (789,338 samples, 0.08%)
std::_Tuple_impl<4ul, ns3::Ptr<ns3::SpectrumPhy>, std::map<unsigned int, ns3::Ptr<ns3::SpectrumValue>, std::less<unsigned int>, std::allocator<std::pair<unsigned int const, ns3::Ptr<ns3::SpectrumValue> > > > >::_Tuple_impl (283,515 samples, 0.03%)
void std::vector<unsigned char, std::allocator<unsigned char> >::_M_realloc_insert<unsigned char> (2,339,611 samples, 0.24%)
std::allocator<std::_Rb_tree_node<std::pair<unsigned short const, std::vector<unsigned short, std::allocator<unsigned short> > > > >::allocate (228,044 samples, 0.02%)
ns3::SimpleRefCount<ns3::EventImpl, ns3::Empty, ns3::DefaultDeleter<ns3::EventImpl> >::Ref (161,738 samples, 0.02%)
std::vector<ns3::RachListElement_s, std::allocator<ns3::RachListElement_s> >::_M_erase_at_end (156,259 samples, 0.02%)
ns3::ByteTagList::~ByteTagList (713,131 samples, 0.07%)
std::map<unsigned short, ns3::DlInfoListElement_s, std::less<unsigned short>, std::allocator<std::pair<unsigned short const, ns3::DlInfoListElement_s> > >::map (351,966 samples, 0.04%)
ns3::LtePhy::SetMacPdu (332,587 samples, 0.03%)
std::map<unsigned int, ns3::Ptr<ns3::SpectrumValue>, std::less<unsigned int>, std::allocator<std::pair<unsigned int const, ns3::Ptr<ns3::SpectrumValue> > > >::~map (270,414 samples, 0.03%)
std::_Rb_tree_iterator<std::pair<ns3::Scheduler::EventKey const, ns3::EventImpl*> > std::_Rb_tree<ns3::Scheduler::EventKey, std::pair<ns3::Scheduler::EventKey const, ns3::EventImpl*>, std::_Select1st<std::pair<ns3::Scheduler::EventKey const, ns3::EventImpl*> >, std::less<ns3::Scheduler::EventKey>, std::allocator<std::pair<ns3::Scheduler::EventKey const, ns3::EventImpl*> > >::_M_emplace_hint_unique<std::pair<ns3::Scheduler::EventKey, ns3::EventImpl*> > (2,857,108 samples, 0.29%)
ns3::LteUePhy*& std::forward<ns3::LteUePhy*&> (157,221 samples, 0.02%)
std::vector<unsigned char, std::allocator<unsigned char> >::_M_range_check (188,564 samples, 0.02%)
std::_Rb_tree<unsigned short, std::pair<unsigned short const, unsigned int>, std::_Select1st<std::pair<unsigned short const, unsigned int> >, std::less<unsigned short>, std::allocator<std::pair<unsigned short const, unsigned int> > >::_M_lower_bound (601,671 samples, 0.06%)
std::_Vector_base<ns3::RlcPduListElement_s, std::allocator<ns3::RlcPduListElement_s> >::_Vector_impl::_Vector_impl (155,130 samples, 0.02%)
unsigned char* std::__copy_move_a<false, __gnu_cxx::__normal_iterator<unsigned char const*, std::vector<unsigned char, std::allocator<unsigned char> > >, unsigned char*> (275,599 samples, 0.03%)
std::_Vector_base<ns3::BuildBroadcastListElement_s, std::allocator<ns3::BuildBroadcastListElement_s> >::_Vector_base (584,510 samples, 0.06%)
ns3::PacketBurst::Copy (4,566,749 samples, 0.47%)
std::vector<ns3::HarqProcessInfoElement_t, std::allocator<ns3::HarqProcessInfoElement_t> >* std::__copy_move_a1<true, std::vector<ns3::HarqProcessInfoElement_t, std::allocator<ns3::HarqProcessInfoElement_t> >*, std::vector<ns3::HarqProcessInfoElement_t, std::allocator<ns3::HarqProcessInfoElement_t> >*> (2,516,750 samples, 0.26%)
ns3::SimpleRefCount<ns3::SpectrumSignalParameters, ns3::Empty, ns3::DefaultDeleter<ns3::SpectrumSignalParameters> >::Unref (273,890 samples, 0.03%)
std::operator== (160,825 samples, 0.02%)
std::map<unsigned short, std::vector<double, std::allocator<double> >, std::less<unsigned short>, std::allocator<std::pair<unsigned short const, std::vector<double, std::allocator<double> > > > >::map (459,078 samples, 0.05%)
ns3::LteRlcSpecificLteMacSapUser::NotifyTxOpportunity (17,080,246 samples, 1.76%)
std::vector<std::vector<ns3::HarqProcessInfoElement_t, std::allocator<ns3::HarqProcessInfoElement_t> >, std::allocator<std::vector<ns3::HarqProcessInfoElement_t, std::allocator<ns3::HarqProcessInfoElement_t> > > >::push_back (2,568,842 samples, 0.26%)
void std::_Destroy<ns3::CqiListElement_s*> (970,280 samples, 0.10%)
std::_Rb_tree<unsigned short, std::pair<unsigned short const, ns3::Ptr<ns3::UeManager> >, std::_Select1st<std::pair<unsigned short const, ns3::Ptr<ns3::UeManager> > >, std::less<unsigned short>, std::allocator<std::pair<unsigned short const, ns3::Ptr<ns3::UeManager> > > >::_S_key (321,034 samples, 0.03%)
ns3::MapScheduler::Insert (1,160,513 samples, 0.12%)
std::vector<double, std::allocator<double> >::~vector (202,197 samples, 0.02%)
std::_Rb_tree<unsigned short, std::pair<unsigned short const, unsigned char>, std::_Select1st<std::pair<unsigned short const, unsigned char> >, std::less<unsigned short>, std::allocator<std::pair<unsigned short const, unsigned char> > >::find (1,128,415 samples, 0.12%)
void std::__invoke_impl<void, void (5,321,712 samples, 0.55%)
main (5,321,712 samples, 0.55%)
ns3::Ptr<ns3::LteSpectrumSignalParametersUlSrsFrame> ns3::DynamicCast<ns3::LteSpectrumSignalParametersUlSrsFrame, ns3::SpectrumSignalParameters> (670,184 samples, 0.07%)
std::_Bvector_base<std::allocator<bool> >::_Bvector_impl_data::_M_move_data (231,889 samples, 0.02%)
std::vector<ns3::CqiListElement_s, std::allocator<ns3::CqiListElement_s> >::_M_erase (416,767 samples, 0.04%)
std::_Rb_tree<unsigned int, std::pair<unsigned int const, ns3::Ptr<ns3::SpectrumValue> >, std::_Select1st<std::pair<unsigned int const, ns3::Ptr<ns3::SpectrumValue> > >, std::less<unsigned int>, std::allocator<std::pair<unsigned int const, ns3::Ptr<ns3::SpectrumValue> > > >::_Rb_tree_impl<std::less<unsigned int>, true>::_Rb_tree_impl (152,651 samples, 0.02%)
ns3::SimpleRefCount<ns3::Packet, ns3::Empty, ns3::DefaultDeleter<ns3::Packet> >::Unref (750,603 samples, 0.08%)
void std::_Bind<void (5,321,712 samples, 0.55%)
(353,481 samples, 0.04%)
std::pair<ns3::TbId_t const, ns3::tbInfo_t>::~pair (190,528 samples, 0.02%)
ns3::Packet::AddByteTag (1,292,520 samples, 0.13%)
std::vector<ns3::DlInfoListElement_s::HarqStatus_e, std::allocator<ns3::DlInfoListElement_s::HarqStatus_e> >::vector (381,879 samples, 0.04%)
ns3::LteSpectrumSignalParametersDlCtrlFrame::~LteSpectrumSignalParametersDlCtrlFrame (233,861 samples, 0.02%)
ns3::SpectrumValue::SpectrumValue (1,744,005 samples, 0.18%)
[ld-linux-x86-64.so.2] (1,432,157 samples, 0.15%)
std::_Bit_const_iterator::_Bit_const_iterator (204,269 samples, 0.02%)
std::_Rb_tree<unsigned short, std::pair<unsigned short const, ns3::LteEnbComponentCarrierManager::UeInfo>, std::_Select1st<std::pair<unsigned short const, ns3::LteEnbComponentCarrierManager::UeInfo> >, std::less<unsigned short>, std::allocator<std::pair<unsigned short const, ns3::LteEnbComponentCarrierManager::UeInfo> > >::lower_bound (151,718 samples, 0.02%)
unsigned char* std::__uninitialized_copy_a<__gnu_cxx::__normal_iterator<unsigned char const*, std::vector<unsigned char, std::allocator<unsigned char> > >, unsigned char*, unsigned char> (481,444 samples, 0.05%)
ns3::Callback<void, ns3::SpectrumValue const&>::operator (20,199,448 samples, 2.08%)
std::_Rb_tree<unsigned int, std::pair<unsigned int const, ns3::TxSpectrumModelInfo>, std::_Select1st<std::pair<unsigned int const, ns3::TxSpectrumModelInfo> >, std::less<unsigned int>, std::allocator<std::pair<unsigned int const, ns3::TxSpectrumModelInfo> > >::find (188,402 samples, 0.02%)
ns3::DlInfoListElement_s::HarqStatus_e* std::__copy_move<false, true, std::random_access_iterator_tag>::__copy_m<ns3::DlInfoListElement_s::HarqStatus_e const, ns3::DlInfoListElement_s::HarqStatus_e> (243,097 samples, 0.03%)
std::__new_allocator<std::_Rb_tree_node<std::pair<ns3::Scheduler::EventKey const, ns3::EventImpl*> > >::allocate (183,384 samples, 0.02%)
ns3::Time::Time (244,557 samples, 0.03%)
void std::vector<ns3::CqiListElement_s, std::allocator<ns3::CqiListElement_s> >::_M_range_insert<__gnu_cxx::__normal_iterator<ns3::CqiListElement_s*, std::vector<ns3::CqiListElement_s, std::allocator<ns3::CqiListElement_s> > > > (1,338,732 samples, 0.14%)
std::function<void (1,214,433 samples, 0.13%)
std::vector<ns3::UlDciListElement_s, std::allocator<ns3::UlDciListElement_s> >::end (241,860 samples, 0.02%)
ns3::SpectrumValue::Copy (2,143,209 samples, 0.22%)
ns3::LteSpectrumSignalParametersDlCtrlFrame::Copy (729,950 samples, 0.08%)
std::allocator<unsigned short>::allocate (378,103 samples, 0.04%)
ns3::DefaultDeleter<ns3::SpectrumSignalParameters>::Delete (3,402,650 samples, 0.35%)
ns3::Ptr<ns3::SpectrumModel const>::operator= (199,517 samples, 0.02%)
unsigned char* std::__uninitialized_fill_n<true>::__uninit_fill_n<unsigned char*, unsigned long, unsigned char> (149,553 samples, 0.02%)
ns3::ObjectDeleter::Delete (8,154,602 samples, 0.84%)
ns3::Ptr<ns3::Packet>::~Ptr (479,003 samples, 0.05%)
void std::vector<ns3::HigherLayerSelected_s, std::allocator<ns3::HigherLayerSelected_s> >::_M_realloc_insert<ns3::HigherLayerSelected_s const&> (1,903,180 samples, 0.20%)
std::_Rb_tree<unsigned int, std::pair<unsigned int const, ns3::Ptr<ns3::SpectrumValue> >, std::_Select1st<std::pair<unsigned int const, ns3::Ptr<ns3::SpectrumValue> > >, std::less<unsigned int>, std::allocator<std::pair<unsigned int const, ns3::Ptr<ns3::SpectrumValue> > > >::_Auto_node::_M_insert (143,534 samples, 0.01%)
std::vector<ns3::HarqProcessInfoElement_t, std::allocator<ns3::HarqProcessInfoElement_t> >::~vector (449,968 samples, 0.05%)
ns3::FfMacSchedSapProvider::SchedUlCqiInfoReqParameters::SchedUlCqiInfoReqParameters (319,872 samples, 0.03%)
std::_Vector_base<int, std::allocator<int> >::_Vector_impl_data::_Vector_impl_data (195,817 samples, 0.02%)
__gnu_cxx::__aligned_membuf<std::pair<unsigned int const, ns3::RxSpectrumModelInfo> >::_M_ptr (376,880 samples, 0.04%)
std::_Rb_tree<unsigned short, std::pair<unsigned short const, std::map<unsigned char, ns3::LteMacSapUser*, std::less<unsigned char>, std::allocator<std::pair<unsigned char const, ns3::LteMacSapUser*> > > >, std::_Select1st<std::pair<unsigned short const, std::map<unsigned char, ns3::LteMacSapUser*, std::less<unsigned char>, std::allocator<std::pair<unsigned char const, ns3::LteMacSapUser*> > > > >, std::less<unsigned short>, std::allocator<std::pair<unsigned short const, std::map<unsigned char, ns3::LteMacSapUser*, std::less<unsigned char>, std::allocator<std::pair<unsigned char const, ns3::LteMacSapUser*> > > > > >::_M_end (161,396 samples, 0.02%)
std::pair<std::_Rb_tree_iterator<std::pair<ns3::Scheduler::EventKey const, ns3::EventImpl*> >, bool>::operator= (149,032 samples, 0.02%)
std::map<unsigned short, ns3::LteEnbComponentCarrierManager::UeInfo, std::less<unsigned short>, std::allocator<std::pair<unsigned short const, ns3::LteEnbComponentCarrierManager::UeInfo> > >::at (2,696,904 samples, 0.28%)
ns3::DefaultSimulatorImpl::Now (126,194 samples, 0.01%)
std::__cxx11::list<ns3::Ptr<ns3::LteControlMessage>, std::allocator<ns3::Ptr<ns3::LteControlMessage> > >::operator= (154,567 samples, 0.02%)
void std::vector<ns3::UlDciListElement_s, std::allocator<ns3::UlDciListElement_s> >::_M_realloc_insert<ns3::UlDciListElement_s const&> (1,765,394 samples, 0.18%)
void std::_Destroy_aux<false>::__destroy<ns3::Ptr<ns3::Object>*> (190,590 samples, 0.02%)
std::__cxx11::list<ns3::Ptr<ns3::LteControlMessage>, std::allocator<ns3::Ptr<ns3::LteControlMessage> > >::get_allocator (396,683 samples, 0.04%)
double* std::uninitialized_copy<__gnu_cxx::__normal_iterator<double const*, std::vector<double, std::allocator<double> > >, double*> (460,469 samples, 0.05%)
ns3::Ptr<ns3::SpectrumModel const>::Ptr<ns3::SpectrumModel> (273,542 samples, 0.03%)
std::tuple<ns3::LteUePhy*, unsigned int, unsigned int>::tuple (190,393 samples, 0.02%)
std::_Vector_base<ns3::VendorSpecificListElement_s, std::allocator<ns3::VendorSpecificListElement_s> >::_M_create_storage (317,668 samples, 0.03%)
ns3::VendorSpecificListElement_s* std::__uninitialized_copy_a<__gnu_cxx::__normal_iterator<ns3::VendorSpecificListElement_s const*, std::vector<ns3::VendorSpecificListElement_s, std::allocator<ns3::VendorSpecificListElement_s> > >, ns3::VendorSpecificListElement_s*, ns3::VendorSpecificListElement_s> (675,744 samples, 0.07%)
ns3::DlInfoListElement_s* std::uninitialized_copy<ns3::DlInfoListElement_s*, ns3::DlInfoListElement_s*> (632,143 samples, 0.07%)
std::_Rb_tree<unsigned int, std::pair<unsigned int const, ns3::Ptr<ns3::SpectrumValue> >, std::_Select1st<std::pair<unsigned int const, ns3::Ptr<ns3::SpectrumValue> > >, std::less<unsigned int>, std::allocator<std::pair<unsigned int const, ns3::Ptr<ns3::SpectrumValue> > > >::~_Rb_tree (220,721 samples, 0.02%)
ns3::HigherLayerSelected_s* std::__uninitialized_copy_a<__gnu_cxx::__normal_iterator<ns3::HigherLayerSelected_s const*, std::vector<ns3::HigherLayerSelected_s, std::allocator<ns3::HigherLayerSelected_s> > >, ns3::HigherLayerSelected_s*, ns3::HigherLayerSelected_s> (389,363 samples, 0.04%)
ns3::LteSpectrumPhy::AddExpectedTb (5,530,969 samples, 0.57%)
std::_Rb_tree<unsigned short, std::pair<unsigned short const, std::vector<double, std::allocator<double> > >, std::_Select1st<std::pair<unsigned short const, std::vector<double, std::allocator<double> > > >, std::less<unsigned short>, std::allocator<std::pair<unsigned short const, std::vector<double, std::allocator<double> > > > >::_M_get_node (474,197 samples, 0.05%)
std::tuple<ns3::MultiModelSpectrumChannel*, ns3::Ptr<ns3::SpectrumValue>, double, ns3::Ptr<ns3::SpectrumSignalParameters>, ns3::Ptr<ns3::SpectrumPhy>, std::map<unsigned int, ns3::Ptr<ns3::SpectrumValue>, std::less<unsigned int>, std::allocator<std::pair<unsigned int const, ns3::Ptr<ns3::SpectrumValue> > > > >::tuple (665,649 samples, 0.07%)
std::_Rb_tree<ns3::Scheduler::EventKey, std::pair<ns3::Scheduler::EventKey const, ns3::EventImpl*>, std::_Select1st<std::pair<ns3::Scheduler::EventKey const, ns3::EventImpl*> >, std::less<ns3::Scheduler::EventKey>, std::allocator<std::pair<ns3::Scheduler::EventKey const, ns3::EventImpl*> > >::_M_insert_node (391,675 samples, 0.04%)
void std::_Destroy<ns3::CqiListElement_s*> (190,387 samples, 0.02%)
ns3::LtePhy::GetPacketBurst (2,782,438 samples, 0.29%)
std::map<ns3::Scheduler::EventKey, ns3::EventImpl*, std::less<ns3::Scheduler::EventKey>, std::allocator<std::pair<ns3::Scheduler::EventKey const, ns3::EventImpl*> > >::lower_bound (272,545 samples, 0.03%)
std::_Rb_tree_iterator<std::pair<unsigned char const, ns3::LteCcmMacSapProvider*> >::operator (124,340 samples, 0.01%)
ns3::Vector3D::GetLength (548,871 samples, 0.06%)
bool __gnu_cxx::operator==<double*, std::vector<double, std::allocator<double> > > (408,801 samples, 0.04%)
ns3::DefaultDeleter<ns3::SpectrumValue>::Delete (196,986 samples, 0.02%)
std::_Rb_tree<unsigned int, std::pair<unsigned int const, ns3::Ptr<ns3::SpectrumValue> >, std::_Select1st<std::pair<unsigned int const, ns3::Ptr<ns3::SpectrumValue> > >, std::less<unsigned int>, std::allocator<std::pair<unsigned int const, ns3::Ptr<ns3::SpectrumValue> > > >::_M_erase (437,697 samples, 0.05%)
std::less<ns3::Scheduler::EventKey>::operator (246,576 samples, 0.03%)
ns3::Packet::GetByteTagIterator (353,377 samples, 0.04%)
std::vector<unsigned char, std::allocator<unsigned char> >::vector (435,841 samples, 0.04%)
__fixunsxfti (505,737 samples, 0.05%)
std::_Rb_tree_node<std::pair<ns3::TbId_t const, ns3::tbInfo_t> >* std::_Rb_tree<ns3::TbId_t, std::pair<ns3::TbId_t const, ns3::tbInfo_t>, std::_Select1st<std::pair<ns3::TbId_t const, ns3::tbInfo_t> >, std::less<ns3::TbId_t>, std::allocator<std::pair<ns3::TbId_t const, ns3::tbInfo_t> > >::_M_create_node<std::pair<ns3::TbId_t, ns3::tbInfo_t> > (1,468,656 samples, 0.15%)
std::allocator_traits<std::allocator<unsigned char> >::allocate (352,577 samples, 0.04%)
std::vector<ns3::CqiListElement_s, std::allocator<ns3::CqiListElement_s> >::end (186,918 samples, 0.02%)
ns3::PacketBurst::AddPacket (2,019,519 samples, 0.21%)
void std::destroy_at<ns3::UlDciLteControlMessage> (234,425 samples, 0.02%)
std::_List_node<ns3::Ptr<ns3::LteControlMessage> >* std::__cxx11::list<ns3::Ptr<ns3::LteControlMessage>, std::allocator<ns3::Ptr<ns3::LteControlMessage> > >::_M_create_node<ns3::Ptr<ns3::LteControlMessage> const&> (370,818 samples, 0.04%)
std::tuple_element<1ul, std::tuple<ns3::LteInterference*, ns3::Ptr<ns3::SpectrumValue const>, unsigned int> >::type& std::get<1ul, ns3::LteInterference*, ns3::Ptr<ns3::SpectrumValue const>, unsigned int> (881,128 samples, 0.09%)
std::_Vector_base<ns3::RlcPduListElement_s, std::allocator<ns3::RlcPduListElement_s> >::_Vector_base (623,026 samples, 0.06%)
std::vector<double, std::allocator<double> >::vector (194,069 samples, 0.02%)
ns3::EventId::operator= (688,506 samples, 0.07%)
std::allocator<std::_List_node<ns3::UlDciLteControlMessage> >::allocate (420,367 samples, 0.04%)
bool __gnu_cxx::operator==<ns3::CqiListElement_s const*, std::vector<ns3::CqiListElement_s, std::allocator<ns3::CqiListElement_s> > > (158,030 samples, 0.02%)
std::__new_allocator<std::_List_node<ns3::UlDciLteControlMessage> >::allocate (397,126 samples, 0.04%)
void std::_Destroy<ns3::MacCeListElement_s*, ns3::MacCeListElement_s> (796,900 samples, 0.08%)
std::is_constant_evaluated (159,721 samples, 0.02%)
ns3::Object::DoDelete (238,924 samples, 0.02%)
std::vector<std::vector<ns3::HarqProcessInfoElement_t, std::allocator<ns3::HarqProcessInfoElement_t> >, std::allocator<std::vector<ns3::HarqProcessInfoElement_t, std::allocator<ns3::HarqProcessInfoElement_t> > > >::_M_erase (3,534,925 samples, 0.36%)
std::_Rb_tree_node<std::pair<unsigned int const, ns3::Ptr<ns3::SpectrumValue> > >* std::_Rb_tree<unsigned int, std::pair<unsigned int const, ns3::Ptr<ns3::SpectrumValue> >, std::_Select1st<std::pair<unsigned int const, ns3::Ptr<ns3::SpectrumValue> > >, std::less<unsigned int>, std::allocator<std::pair<unsigned int const, ns3::Ptr<ns3::SpectrumValue> > > >::_Alloc_node::operator (346,575 samples, 0.04%)
ns3::Ptr<ns3::SpectrumModel const>::Ptr (150,773 samples, 0.02%)
ns3::Ptr<ns3::PacketBurst>& std::vector<ns3::Ptr<ns3::PacketBurst>, std::allocator<ns3::Ptr<ns3::PacketBurst> > >::emplace_back<ns3::Ptr<ns3::PacketBurst> > (838,531 samples, 0.09%)
(160,407 samples, 0.02%)
std::_Rb_tree<unsigned short, std::pair<unsigned short const, ns3::LteEnbComponentCarrierManager::UeInfo>, std::_Select1st<std::pair<unsigned short const, ns3::LteEnbComponentCarrierManager::UeInfo> >, std::less<unsigned short>, std::allocator<std::pair<unsigned short const, ns3::LteEnbComponentCarrierManager::UeInfo> > >::lower_bound (966,658 samples, 0.10%)
std::vector<unsigned char, std::allocator<unsigned char> >::~vector (384,119 samples, 0.04%)
ns3::Ptr<ns3::Packet const>::Ptr<ns3::Packet> (235,834 samples, 0.02%)
ns3::Ptr<ns3::SpectrumValue const>::Ptr (238,944 samples, 0.02%)
std::vector<std::__cxx11::list<ns3::Ptr<ns3::LteControlMessage>, std::allocator<ns3::Ptr<ns3::LteControlMessage> > >, std::allocator<std::__cxx11::list<ns3::Ptr<ns3::LteControlMessage>, std::allocator<ns3::Ptr<ns3::LteControlMessage> > > > >::erase (446,852 samples, 0.05%)
decltype (368,604 samples, 0.04%)
__gnu_cxx::__normal_iterator<std::__cxx11::list<ns3::Ptr<ns3::LteControlMessage>, std::allocator<ns3::Ptr<ns3::LteControlMessage> > >*, std::vector<std::__cxx11::list<ns3::Ptr<ns3::LteControlMessage>, std::allocator<ns3::Ptr<ns3::LteControlMessage> > >, std::allocator<std::__cxx11::list<ns3::Ptr<ns3::LteControlMessage>, std::allocator<ns3::Ptr<ns3::LteControlMessage> > > > > > std::move<__gnu_cxx::__normal_iterator<std::__cxx11::list<ns3::Ptr<ns3::LteControlMessage>, std::allocator<ns3::Ptr<ns3::LteControlMessage> > >*, std::vector<std::__cxx11::list<ns3::Ptr<ns3::LteControlMessage>, std::allocator<ns3::Ptr<ns3::LteControlMessage> > >, std::allocator<std::__cxx11::list<ns3::Ptr<ns3::LteControlMessage>, std::allocator<ns3::Ptr<ns3::LteControlMessage> > > > > >, __gnu_cxx::__normal_iterator<std::__cxx11::list<ns3::Ptr<ns3::LteControlMessage>, std::allocator<ns3::Ptr<ns3::LteControlMessage> > >*, std::vector<std::__cxx11::list<ns3::Ptr<ns3::LteControlMessage>, std::allocator<ns3::Ptr<ns3::LteControlMessage> > >, std::allocator<std::__cxx11::list<ns3::Ptr<ns3::LteControlMessage>, std::allocator<ns3::Ptr<ns3::LteControlMessage> > > > > > > (1,076,159 samples, 0.11%)
void std::_Destroy<ns3::BuildRarListElement_s*, ns3::BuildRarListElement_s> (157,406 samples, 0.02%)
std::_Rb_tree<unsigned short, std::pair<unsigned short const, std::vector<std::vector<ns3::HarqProcessInfoElement_t, std::allocator<ns3::HarqProcessInfoElement_t> >, std::allocator<std::vector<ns3::HarqProcessInfoElement_t, std::allocator<ns3::HarqProcessInfoElement_t> > > > >, std::_Select1st<std::pair<unsigned short const, std::vector<std::vector<ns3::HarqProcessInfoElement_t, std::allocator<ns3::HarqProcessInfoElement_t> >, std::allocator<std::vector<ns3::HarqProcessInfoElement_t, std::allocator<ns3::HarqProcessInfoElement_t> > > > > >, std::less<unsigned short>, std::allocator<std::pair<unsigned short const, std::vector<std::vector<ns3::HarqProcessInfoElement_t, std::allocator<ns3::HarqProcessInfoElement_t> >, std::allocator<std::vector<ns3::HarqProcessInfoElement_t, std::allocator<ns3::HarqProcessInfoElement_t> > > > > > >::_S_key (158,025 samples, 0.02%)
ns3::Ptr<ns3::PacketBurst>* std::__copy_move_a1<true, ns3::Ptr<ns3::PacketBurst>*, ns3::Ptr<ns3::PacketBurst>*> (2,014,508 samples, 0.21%)
ns3::VendorSpecificListElement_s* std::__uninitialized_copy<false>::__uninit_copy<__gnu_cxx::__normal_iterator<ns3::VendorSpecificListElement_s const*, std::vector<ns3::VendorSpecificListElement_s, std::allocator<ns3::VendorSpecificListElement_s> > >, ns3::VendorSpecificListElement_s*> (198,957 samples, 0.02%)
void std::allocator_traits<std::allocator<std::_List_node<ns3::Ptr<ns3::Packet> > > >::construct<ns3::Ptr<ns3::Packet>, ns3::Ptr<ns3::Packet> const&> (408,582 samples, 0.04%)
ns3::HarqProcessInfoElement_t* std::__uninitialized_copy<true>::__uninit_copy<__gnu_cxx::__normal_iterator<ns3::HarqProcessInfoElement_t const*, std::vector<ns3::HarqProcessInfoElement_t, std::allocator<ns3::HarqProcessInfoElement_t> > >, ns3::HarqProcessInfoElement_t*> (419,766 samples, 0.04%)
std::map<unsigned short, std::vector<std::vector<ns3::HarqProcessInfoElement_t, std::allocator<ns3::HarqProcessInfoElement_t> >, std::allocator<std::vector<ns3::HarqProcessInfoElement_t, std::allocator<ns3::HarqProcessInfoElement_t> > > >, std::less<unsigned short>, std::allocator<std::pair<unsigned short const, std::vector<std::vector<ns3::HarqProcessInfoElement_t, std::allocator<ns3::HarqProcessInfoElement_t> >, std::allocator<std::vector<ns3::HarqProcessInfoElement_t, std::allocator<ns3::HarqProcessInfoElement_t> > > > > > >::find (1,985,670 samples, 0.20%)
std::vector<double, std::allocator<double> >::at (197,283 samples, 0.02%)
std::_Vector_base<ns3::VendorSpecificListElement_s, std::allocator<ns3::VendorSpecificListElement_s> >::_Vector_base (426,707 samples, 0.04%)
std::vector<int, std::allocator<int> >::_M_check_len (249,636 samples, 0.03%)
ns3::DefaultDeleter<ns3::SpectrumValue>::Delete (433,382 samples, 0.04%)
ns3::FfMacSchedSapProvider::SchedDlRlcBufferReqParameters::operator= (1,434,031 samples, 0.15%)
ns3::SimpleRefCount<ns3::Object, ns3::ObjectBase, ns3::ObjectDeleter>::Unref (3,158,900 samples, 0.33%)
std::pair<ns3::TbId_t const, ns3::tbInfo_t>::pair<ns3::TbId_t, ns3::tbInfo_t> (581,670 samples, 0.06%)
ns3::TypeId::GetAttributeN (149,666 samples, 0.02%)
std::vector<ns3::BuildDataListElement_s, std::allocator<ns3::BuildDataListElement_s> >::vector (296,060 samples, 0.03%)
ns3::LteEnbPhy::SendControlChannels (63,350,263 samples, 6.53%) ns3::..
ns3::Ptr<ns3::Packet>::operator (160,485 samples, 0.02%)
ns3::Object::GetTypeId (544,814 samples, 0.06%)
std::less<ns3::LteFlowId_t>::operator (150,830 samples, 0.02%)
std::vector<ns3::MacCeListElement_s, std::allocator<ns3::MacCeListElement_s> >::~vector (237,617 samples, 0.02%)
ns3::TypeId::operator= (327,866 samples, 0.03%)
bool __gnu_cxx::operator==<ns3::VendorSpecificListElement_s const*, std::vector<ns3::VendorSpecificListElement_s, std::allocator<ns3::VendorSpecificListElement_s> > > (316,067 samples, 0.03%)
std::allocator_traits<std::allocator<int> >::deallocate (169,673 samples, 0.02%)
void std::_Bind<void (22,443,594 samples, 2.31%)
ns3::SimpleRefCount<ns3::SpectrumValue, ns3::Empty, ns3::DefaultDeleter<ns3::SpectrumValue> >::Unref (165,191 samples, 0.02%)
ns3::VendorSpecificListElement_s* std::__copy_move_a1<false, ns3::VendorSpecificListElement_s const*, ns3::VendorSpecificListElement_s*> (181,476 samples, 0.02%)
ns3::Object::Construct (260,304 samples, 0.03%)
std::_Rb_tree<unsigned short, std::pair<unsigned short const, std::vector<std::vector<ns3::HarqProcessInfoElement_t, std::allocator<ns3::HarqProcessInfoElement_t> >, std::allocator<std::vector<ns3::HarqProcessInfoElement_t, std::allocator<ns3::HarqProcessInfoElement_t> > > > >, std::_Select1st<std::pair<unsigned short const, std::vector<std::vector<ns3::HarqProcessInfoElement_t, std::allocator<ns3::HarqProcessInfoElement_t> >, std::allocator<std::vector<ns3::HarqProcessInfoElement_t, std::allocator<ns3::HarqProcessInfoElement_t> > > > > >, std::less<unsigned short>, std::allocator<std::pair<unsigned short const, std::vector<std::vector<ns3::HarqProcessInfoElement_t, std::allocator<ns3::HarqProcessInfoElement_t> >, std::allocator<std::vector<ns3::HarqProcessInfoElement_t, std::allocator<ns3::HarqProcessInfoElement_t> > > > > > >::_M_lower_bound (993,953 samples, 0.10%)
ns3::DefaultSimulatorImpl::ProcessOneEvent (22,443,594 samples, 2.31%)
unsigned char* std::uninitialized_copy<__gnu_cxx::__normal_iterator<unsigned char const*, std::vector<unsigned char, std::allocator<unsigned char> > >, unsigned char*> (204,725 samples, 0.02%)
ns3::SimpleRefCount<ns3::SpectrumValue, ns3::Empty, ns3::DefaultDeleter<ns3::SpectrumValue> >::operator= (239,557 samples, 0.02%)
std::_Rb_tree<unsigned int, std::pair<unsigned int const, ns3::Ptr<ns3::SpectrumValue> >, std::_Select1st<std::pair<unsigned int const, ns3::Ptr<ns3::SpectrumValue> > >, std::less<unsigned int>, std::allocator<std::pair<unsigned int const, ns3::Ptr<ns3::SpectrumValue> > > >::~_Rb_tree (270,414 samples, 0.03%)
std::enable_if<is_member_pointer_v<void (1,840,445 samples, 0.19%)
ns3::Object::Object (2,165,809 samples, 0.22%)
std::set<unsigned short, std::less<unsigned short>, std::allocator<unsigned short> >::find (148,308 samples, 0.02%)
ns3::SpectrumValue::operator[] (190,175 samples, 0.02%)
std::_Rb_tree<ns3::Scheduler::EventKey, std::pair<ns3::Scheduler::EventKey const, ns3::EventImpl*>, std::_Select1st<std::pair<ns3::Scheduler::EventKey const, ns3::EventImpl*> >, std::less<ns3::Scheduler::EventKey>, std::allocator<std::pair<ns3::Scheduler::EventKey const, ns3::EventImpl*> > >::_S_left (158,793 samples, 0.02%)
std::_Vector_base<int, std::allocator<int> >::_Vector_impl::_Vector_impl (165,440 samples, 0.02%)
void std::vector<ns3::BuildDataListElement_s, std::allocator<ns3::BuildDataListElement_s> >::_M_realloc_insert<ns3::BuildDataListElement_s const&> (3,684,590 samples, 0.38%)
std::_Rb_tree_decrement (156,793 samples, 0.02%)
decltype (2,332,441 samples, 0.24%)
double* std::__uninitialized_default_n_1<true>::__uninit_default_n<double*, unsigned long> (153,593 samples, 0.02%)
std::__cxx11::_List_base<ns3::Ptr<ns3::LteControlMessage>, std::allocator<ns3::Ptr<ns3::LteControlMessage> > >::_List_base (403,989 samples, 0.04%)
bool __gnu_cxx::operator==<ns3::RlcPduListElement_s const*, std::vector<ns3::RlcPduListElement_s, std::allocator<ns3::RlcPduListElement_s> > > (346,484 samples, 0.04%)
std::_Rb_tree<int, std::pair<int const, double>, std::_Select1st<std::pair<int const, double> >, std::less<int>, std::allocator<std::pair<int const, double> > >::_Auto_node::_Auto_node<std::pair<int, double> > (461,183 samples, 0.05%)
ns3::DlCqiLteControlMessage::~DlCqiLteControlMessage (197,585 samples, 0.02%)
std::vector<int, std::allocator<int> >::operator= (458,503 samples, 0.05%)
ns3::Ptr<ns3::PacketBurst>::Ptr (272,135 samples, 0.03%)
ns3::TagBuffer::ReadU32 (197,361 samples, 0.02%)
ns3::SpectrumSignalParameters::~SpectrumSignalParameters (184,600 samples, 0.02%)
double* std::fill_n<double*, unsigned long, double> (162,027 samples, 0.02%)
ns3::DefaultSimulatorImpl::Run (922,121,412 samples, 95.09%) ns3::DefaultSimulatorImpl::Run
std::_Vector_base<unsigned char, std::allocator<unsigned char> >::_Vector_impl::_Vector_impl (183,612 samples, 0.02%)
std::_Tuple_impl<5ul, std::map<unsigned int, ns3::Ptr<ns3::SpectrumValue>, std::less<unsigned int>, std::allocator<std::pair<unsigned int const, ns3::Ptr<ns3::SpectrumValue> > > > >::_Tuple_impl (165,624 samples, 0.02%)
ns3::MakeEvent<void (2,408,455 samples, 0.25%)
ns3::PacketBurst::Copy (10,413,233 samples, 1.07%)
std::__cxx11::list<ns3::Ptr<ns3::LteControlMessage>, std::allocator<ns3::Ptr<ns3::LteControlMessage> > >* std::__niter_base<std::__cxx11::list<ns3::Ptr<ns3::LteControlMessage>, std::allocator<ns3::Ptr<ns3::LteControlMessage> > >*, std::vector<std::__cxx11::list<ns3::Ptr<ns3::LteControlMessage>, std::allocator<ns3::Ptr<ns3::LteControlMessage> > >, std::allocator<std::__cxx11::list<ns3::Ptr<ns3::LteControlMessage>, std::allocator<ns3::Ptr<ns3::LteControlMessage> > > > > > (157,965 samples, 0.02%)
ns3::PacketBurst::~PacketBurst (2,458,313 samples, 0.25%)
std::_Rb_tree<unsigned short, std::pair<unsigned short const, std::vector<unsigned short, std::allocator<unsigned short> > >, std::_Select1st<std::pair<unsigned short const, std::vector<unsigned short, std::allocator<unsigned short> > > >, std::less<unsigned short>, std::allocator<std::pair<unsigned short const, std::vector<unsigned short, std::allocator<unsigned short> > > > >::_S_key (157,744 samples, 0.02%)
ns3::EventId::EventId (646,382 samples, 0.07%)
std::map<unsigned short, std::vector<unsigned short, std::allocator<unsigned short> >, std::less<unsigned short>, std::allocator<std::pair<unsigned short const, std::vector<unsigned short, std::allocator<unsigned short> > > > >::operator[] (3,043,186 samples, 0.31%)
__gnu_cxx::__aligned_membuf<std::pair<ns3::TbId_t const, ns3::tbInfo_t> >::_M_ptr (179,937 samples, 0.02%)
std::_Head_base<1ul, ns3::Ptr<ns3::SpectrumValue const>, false>::_Head_base (380,537 samples, 0.04%)
ns3::Ptr<ns3::SpectrumModel const>::Acquire (127,934 samples, 0.01%)
unsigned short&& std::forward<unsigned short> (242,245 samples, 0.02%)
unsigned char* std::__uninitialized_copy<true>::__uninit_copy<__gnu_cxx::__normal_iterator<unsigned char const*, std::vector<unsigned char, std::allocator<unsigned char> > >, unsigned char*> (650,532 samples, 0.07%)
ns3::SpectrumValue::~SpectrumValue (362,265 samples, 0.04%)
ns3::SimpleRefCount<ns3::Object, ns3::ObjectBase, ns3::ObjectDeleter>::Unref (191,238 samples, 0.02%)
void std::__cxx11::list<ns3::Ptr<ns3::LteControlMessage>, std::allocator<ns3::Ptr<ns3::LteControlMessage> > >::_M_assign_dispatch<std::_List_const_iterator<ns3::Ptr<ns3::LteControlMessage> > > (776,735 samples, 0.08%)
std::_Rb_tree<ns3::TbId_t, std::pair<ns3::TbId_t const, ns3::tbInfo_t>, std::_Select1st<std::pair<ns3::TbId_t const, ns3::tbInfo_t> >, std::less<ns3::TbId_t>, std::allocator<std::pair<ns3::TbId_t const, ns3::tbInfo_t> > >::_M_get_insert_hint_unique_pos (485,965 samples, 0.05%)
std::vector<double, std::allocator<double> >::end (220,899 samples, 0.02%)
std::_Vector_base<ns3::HarqProcessInfoElement_t, std::allocator<ns3::HarqProcessInfoElement_t> >::_Vector_impl_data::_M_swap_data (195,859 samples, 0.02%)
__dynamic_cast (271,796 samples, 0.03%)
unsigned short* std::__uninitialized_copy<true>::__uninit_copy<std::move_iterator<unsigned short*>, unsigned short*> (154,651 samples, 0.02%)
std::vector<unsigned char, std::allocator<unsigned char> >::end (326,697 samples, 0.03%)
std::_Bit_iterator::_Bit_iterator (156,996 samples, 0.02%)
std::map<unsigned char, unsigned int, std::less<unsigned char>, std::allocator<std::pair<unsigned char const, unsigned int> > >::empty (277,085 samples, 0.03%)
std::vector<ns3::PacketMetadata::Data*, std::allocator<ns3::PacketMetadata::Data*> >::begin (175,095 samples, 0.02%)
std::_Rb_tree<ns3::Scheduler::EventKey, std::pair<ns3::Scheduler::EventKey const, ns3::EventImpl*>, std::_Select1st<std::pair<ns3::Scheduler::EventKey const, ns3::EventImpl*> >, std::less<ns3::Scheduler::EventKey>, std::allocator<std::pair<ns3::Scheduler::EventKey const, ns3::EventImpl*> > >::_S_key (553,980 samples, 0.06%)
std::allocator<ns3::DlInfoListElement_s::HarqStatus_e>::allocate (185,863 samples, 0.02%)
ns3::Ptr<ns3::SpectrumModel const>::operator* (233,289 samples, 0.02%)
std::_Rb_tree_iterator<std::pair<unsigned short const, ns3::pfsFlowPerf_t> >::operator* (587,602 samples, 0.06%)
void std::_Destroy<ns3::VendorSpecificListElement_s*> (234,807 samples, 0.02%)
ns3::EventId ns3::Simulator::ScheduleNow<void (1,222,846 samples, 0.13%)
std::function<void (2,750,000 samples, 0.28%)
ns3::TagBuffer::ReadU8 (285,405 samples, 0.03%)
void std::__invoke_impl<void, std::_Bind<void (886,915,093 samples, 91.46%) void std::__invoke_impl<void, std::_Bind<void
std::_Rb_tree_iterator<std::pair<ns3::Scheduler::EventKey const, ns3::EventImpl*> > std::map<ns3::Scheduler::EventKey, ns3::EventImpl*, std::less<ns3::Scheduler::EventKey>, std::allocator<std::pair<ns3::Scheduler::EventKey const, ns3::EventImpl*> > >::emplace_hint<std::pair<ns3::Scheduler::EventKey, ns3::EventImpl*> > (953,823 samples, 0.10%)
std::_Rb_tree<ns3::TbId_t, std::pair<ns3::TbId_t const, ns3::tbInfo_t>, std::_Select1st<std::pair<ns3::TbId_t const, ns3::tbInfo_t> >, std::less<ns3::TbId_t>, std::allocator<std::pair<ns3::TbId_t const, ns3::tbInfo_t> > >::end (332,913 samples, 0.03%)
ns3::CeBitmap_e* std::uninitialized_copy<__gnu_cxx::__normal_iterator<ns3::CeBitmap_e const*, std::vector<ns3::CeBitmap_e, std::allocator<ns3::CeBitmap_e> > >, ns3::CeBitmap_e*> (492,021 samples, 0.05%)
unsigned short const& std::__get_helper<0ul, unsigned short const&> (277,874 samples, 0.03%)
__gnu_cxx::__aligned_membuf<ns3::Ptr<ns3::PacketBurst> >::_M_ptr (311,832 samples, 0.03%)
ns3::ObjectBase::~ObjectBase (202,260 samples, 0.02%)
std::vector<bool, std::allocator<bool> >::_M_check_len (234,878 samples, 0.02%)
ns3::LteRadioBearerTag::Deserialize (721,482 samples, 0.07%)
std::_Function_handler<void (916,117 samples, 0.09%)
operator new (333,876 samples, 0.03%)
std::pair<int, double>::pair<int&, double&> (314,047 samples, 0.03%)
std::_Select1st<std::pair<ns3::LteSpectrumModelId const, ns3::Ptr<ns3::SpectrumModel> > >::operator (203,288 samples, 0.02%)
std::this_thread::get_id (261,839 samples, 0.03%)
std::__cxx11::_List_base<ns3::Ptr<ns3::LteControlMessage>, std::allocator<ns3::Ptr<ns3::LteControlMessage> > >::~_List_base (277,280 samples, 0.03%)
ns3::MapScheduler::Insert (146,147 samples, 0.02%)
std::_Rb_tree<unsigned short, std::pair<unsigned short const, std::vector<unsigned short, std::allocator<unsigned short> > >, std::_Select1st<std::pair<unsigned short const, std::vector<unsigned short, std::allocator<unsigned short> > > >, std::less<unsigned short>, std::allocator<std::pair<unsigned short const, std::vector<unsigned short, std::allocator<unsigned short> > > > >::_M_get_insert_hint_unique_pos (424,499 samples, 0.04%)
std::vector<ns3::HarqProcessInfoElement_t, std::allocator<ns3::HarqProcessInfoElement_t> >::clear (165,983 samples, 0.02%)
ns3::Ptr<ns3::EventImpl>::Ptr (596,385 samples, 0.06%)
std::_Vector_base<ns3::DlInfoListElement_s, std::allocator<ns3::DlInfoListElement_s> >::_M_allocate (381,294 samples, 0.04%)
std::allocator_traits<std::allocator<double> >::allocate (168,940 samples, 0.02%)
std::vector<ns3::TypeId::AttributeInformation, std::allocator<ns3::TypeId::AttributeInformation> >::size (214,385 samples, 0.02%)
std::_Rb_tree<unsigned int, std::pair<unsigned int const, ns3::TxSpectrumModelInfo>, std::_Select1st<std::pair<unsigned int const, ns3::TxSpectrumModelInfo> >, std::less<unsigned int>, std::allocator<std::pair<unsigned int const, ns3::TxSpectrumModelInfo> > >::_M_end (171,031 samples, 0.02%)
ns3::LteInterference*& std::forward<ns3::LteInterference*&> (156,121 samples, 0.02%)
operator new (167,253 samples, 0.02%)
std::map<ns3::Scheduler::EventKey, ns3::EventImpl*, std::less<ns3::Scheduler::EventKey>, std::allocator<std::pair<ns3::Scheduler::EventKey const, ns3::EventImpl*> > >::key_comp (280,831 samples, 0.03%)
ns3::PhichListElement_s* std::uninitialized_copy<__gnu_cxx::__normal_iterator<ns3::PhichListElement_s const*, std::vector<ns3::PhichListElement_s, std::allocator<ns3::PhichListElement_s> > >, ns3::PhichListElement_s*> (202,017 samples, 0.02%)
std::map<unsigned short, std::vector<std::vector<std::vector<ns3::RlcPduListElement_s, std::allocator<ns3::RlcPduListElement_s> >, std::allocator<std::vector<ns3::RlcPduListElement_s, std::allocator<ns3::RlcPduListElement_s> > > >, std::allocator<std::vector<std::vector<ns3::RlcPduListElement_s, std::allocator<ns3::RlcPduListElement_s> >, std::allocator<std::vector<ns3::RlcPduListElement_s, std::allocator<ns3::RlcPduListElement_s> > > > > >, std::less<unsigned short>, std::allocator<std::pair<unsigned short const, std::vector<std::vector<std::vector<ns3::RlcPduListElement_s, std::allocator<ns3::RlcPduListElement_s> >, std::allocator<std::vector<ns3::RlcPduListElement_s, std::allocator<ns3::RlcPduListElement_s> > > >, std::allocator<std::vector<std::vector<ns3::RlcPduListElement_s, std::allocator<ns3::RlcPduListElement_s> >, std::allocator<std::vector<ns3::RlcPduListElement_s, std::allocator<ns3::RlcPduListElement_s> > > > > > > > >::find (1,363,562 samples, 0.14%)
std::_Rb_tree<ns3::Scheduler::EventKey, std::pair<ns3::Scheduler::EventKey const, ns3::EventImpl*>, std::_Select1st<std::pair<ns3::Scheduler::EventKey const, ns3::EventImpl*> >, std::less<ns3::Scheduler::EventKey>, std::allocator<std::pair<ns3::Scheduler::EventKey const, ns3::EventImpl*> > >::lower_bound (2,165,306 samples, 0.22%)
std::_Rb_tree<unsigned int, std::pair<unsigned int const, ns3::TxSpectrumModelInfo>, std::_Select1st<std::pair<unsigned int const, ns3::TxSpectrumModelInfo> >, std::less<unsigned int>, std::allocator<std::pair<unsigned int const, ns3::TxSpectrumModelInfo> > >::end (151,000 samples, 0.02%)
ns3::TypeId::GetAttributeN (1,373,694 samples, 0.14%)
void std::__invoke_impl<void, ns3::Callback<void, ns3::SpectrumValue const&>::Callback<void (324,769 samples, 0.03%)
void std::vector<int, std::allocator<int> >::_M_realloc_insert<int const&> (1,905,826 samples, 0.20%)
__gnu_cxx::__aligned_membuf<ns3::UlDciLteControlMessage>::_M_ptr (143,958 samples, 0.01%)
std::_Rb_tree_node<std::pair<unsigned int const, ns3::Ptr<ns3::SpectrumValue> > >::_M_valptr (126,568 samples, 0.01%)
ns3::DlDciListElement_s::~DlDciListElement_s (221,743 samples, 0.02%)
ns3::LteRlcSpecificLteMacSapUser::NotifyTxOpportunity (1,376,216 samples, 0.14%)
ns3::ByteTagList::Iterator::PrepareForNext (236,079 samples, 0.02%)
std::_Bvector_base<std::allocator<bool> >::_Bvector_impl_data::_Bvector_impl_data (156,996 samples, 0.02%)
ns3::Angles::Angles (3,272,025 samples, 0.34%)
double* std::__copy_move_a2<false, double const*, double*> (447,358 samples, 0.05%)
ns3::LteSpectrumSignalParametersDataFrame::LteSpectrumSignalParametersDataFrame (5,596,120 samples, 0.58%)
std::__cxx11::_List_base<ns3::Ptr<ns3::LteControlMessage>, std::allocator<ns3::Ptr<ns3::LteControlMessage> > >::_List_impl::_List_impl (157,771 samples, 0.02%)
ns3::EventId ns3::Simulator::Schedule<void (2,167,776 samples, 0.22%)
std::_List_node<ns3::Ptr<ns3::LteControlMessage> >::_M_valptr (151,932 samples, 0.02%)
unsigned int& std::__get_helper<2ul, unsigned int> (272,452 samples, 0.03%)
ns3::LteEnbMac::DoReceiveLteControlMessage (20,358,746 samples, 2.10%)
ns3::ObjectBase::ConstructSelf (2,873,447 samples, 0.30%)
double* std::__niter_base<double*, std::vector<double, std::allocator<double> > > (155,897 samples, 0.02%)
ns3::PacketTagList::COWTraverse (1,126,525 samples, 0.12%)
std::tuple_element<5ul, std::tuple<ns3::MultiModelSpectrumChannel*, ns3::Ptr<ns3::SpectrumValue>, double, ns3::Ptr<ns3::SpectrumSignalParameters>, ns3::Ptr<ns3::SpectrumPhy>, std::map<unsigned int, ns3::Ptr<ns3::SpectrumValue>, std::less<unsigned int>, std::allocator<std::pair<unsigned int const, ns3::Ptr<ns3::SpectrumValue> > > > > >::type& std::get<5ul, ns3::MultiModelSpectrumChannel*, ns3::Ptr<ns3::SpectrumValue>, double, ns3::Ptr<ns3::SpectrumSignalParameters>, ns3::Ptr<ns3::SpectrumPhy>, std::map<unsigned int, ns3::Ptr<ns3::SpectrumValue>, std::less<unsigned int>, std::allocator<std::pair<unsigned int const, ns3::Ptr<ns3::SpectrumValue> > > > > (744,917 samples, 0.08%)
ns3::LteSpectrumPhy::GetMobility (303,143 samples, 0.03%)
std::_List_iterator<ns3::Ptr<ns3::LteControlMessage> > std::__cxx11::list<ns3::Ptr<ns3::LteControlMessage>, std::allocator<ns3::Ptr<ns3::LteControlMessage> > >::insert<std::_List_const_iterator<ns3::Ptr<ns3::LteControlMessage> >, void> (411,083 samples, 0.04%)
void std::allocator_traits<std::allocator<std::_Rb_tree_node<std::pair<ns3::TbId_t const, ns3::tbInfo_t> > > >::destroy<std::pair<ns3::TbId_t const, ns3::tbInfo_t> > (190,528 samples, 0.02%)
std::vector<std::vector<ns3::HarqProcessInfoElement_t, std::allocator<ns3::HarqProcessInfoElement_t> >, std::allocator<std::vector<ns3::HarqProcessInfoElement_t, std::allocator<ns3::HarqProcessInfoElement_t> > > >::size (173,421 samples, 0.02%)
std::map<int, double, std::less<int>, std::allocator<std::pair<int const, double> > >::~map (804,188 samples, 0.08%)
std::vector<ns3::IidManager::IidInformation, std::allocator<ns3::IidManager::IidInformation> >::operator[] (150,378 samples, 0.02%)
std::_Rb_tree<ns3::Scheduler::EventKey, std::pair<ns3::Scheduler::EventKey const, ns3::EventImpl*>, std::_Select1st<std::pair<ns3::Scheduler::EventKey const, ns3::EventImpl*> >, std::less<ns3::Scheduler::EventKey>, std::allocator<std::pair<ns3::Scheduler::EventKey const, ns3::EventImpl*> > >::_Auto_node::_M_insert (220,811 samples, 0.02%)
double* std::__uninitialized_default_n<double*, unsigned long> (197,197 samples, 0.02%)
std::_Rb_tree<unsigned char, std::pair<unsigned char const, ns3::LteMacSapProvider::ReportBufferStatusParameters>, std::_Select1st<std::pair<unsigned char const, ns3::LteMacSapProvider::ReportBufferStatusParameters> >, std::less<unsigned char>, std::allocator<std::pair<unsigned char const, ns3::LteMacSapProvider::ReportBufferStatusParameters> > >::begin (295,218 samples, 0.03%)
std::__cxx11::list<ns3::Callback<void, ns3::Ptr<ns3::PacketBurst const> >, std::allocator<ns3::Callback<void, ns3::Ptr<ns3::PacketBurst const> > > >::begin (233,931 samples, 0.02%)
bool __gnu_cxx::operator==<ns3::PhichListElement_s const*, std::vector<ns3::PhichListElement_s, std::allocator<ns3::PhichListElement_s> > > (161,679 samples, 0.02%)
void std::_Destroy<unsigned short*, unsigned short> (155,477 samples, 0.02%)
std::__allocated_ptr<std::allocator<std::_List_node<ns3::Ptr<ns3::Packet> > > >::__allocated_ptr (199,424 samples, 0.02%)
ns3::LtePhy::SetControlMessages (985,557 samples, 0.10%)
void std::__invoke_impl<void, void (870,107,623 samples, 89.72%) void std::__invoke_impl<void, void
ns3::LteEnbRrc::GetUeManager (2,186,317 samples, 0.23%)
ns3::Object::DoDelete (191,238 samples, 0.02%)
ns3::LteSpectrumPhy::UpdateSinrPerceived (400,144 samples, 0.04%)
std::_Rb_tree<int, std::pair<int const, double>, std::_Select1st<std::pair<int const, double> >, std::less<int>, std::allocator<std::pair<int const, double> > >::_M_erase (763,268 samples, 0.08%)
__gnu_cxx::__aligned_membuf<std::pair<unsigned short const, ns3::LteEnbComponentCarrierManager::UeInfo> >::_M_ptr (230,371 samples, 0.02%)
std::vector<std::__cxx11::list<ns3::UlDciLteControlMessage, std::allocator<ns3::UlDciLteControlMessage> >, std::allocator<std::__cxx11::list<ns3::UlDciLteControlMessage, std::allocator<ns3::UlDciLteControlMessage> > > >::erase (3,494,424 samples, 0.36%)
std::_Rb_tree<ns3::TbId_t, std::pair<ns3::TbId_t const, ns3::tbInfo_t>, std::_Select1st<std::pair<ns3::TbId_t const, ns3::tbInfo_t> >, std::less<ns3::TbId_t>, std::allocator<std::pair<ns3::TbId_t const, ns3::tbInfo_t> > >::_Auto_node::_Auto_node<std::pair<ns3::TbId_t, ns3::tbInfo_t> > (1,468,656 samples, 0.15%)
ns3::PacketMetadata::PacketMetadata (266,992 samples, 0.03%)
std::_Rb_tree<int, std::pair<int const, double>, std::_Select1st<std::pair<int const, double> >, std::less<int>, std::allocator<std::pair<int const, double> > >::clear (1,054,314 samples, 0.11%)
std::vector<ns3::Ptr<ns3::PacketBurst>, std::allocator<ns3::Ptr<ns3::PacketBurst> > >::at (194,370 samples, 0.02%)
std::_Rb_tree_iterator<std::pair<ns3::Scheduler::EventKey const, ns3::EventImpl*> > std::map<ns3::Scheduler::EventKey, ns3::EventImpl*, std::less<ns3::Scheduler::EventKey>, std::allocator<std::pair<ns3::Scheduler::EventKey const, ns3::EventImpl*> > >::emplace_hint<std::pair<ns3::Scheduler::EventKey, ns3::EventImpl*> > (487,403 samples, 0.05%)
ns3::PacketBurst::~PacketBurst (3,088,032 samples, 0.32%)
ns3::LteSpectrumPhy::AddExpectedTb (590,754 samples, 0.06%)
ns3::MemberSchedSapProvider<ns3::PfFfMacScheduler>::SchedUlCqiInfoReq (6,622,886 samples, 0.68%)
ns3::DlInfoListElement_s* std::copy<ns3::DlInfoListElement_s*, ns3::DlInfoListElement_s*> (475,054 samples, 0.05%)
std::_Rb_tree_iterator<std::pair<unsigned int const, ns3::Ptr<ns3::SpectrumValue> > > std::_Rb_tree<unsigned int, std::pair<unsigned int const, ns3::Ptr<ns3::SpectrumValue> >, std::_Select1st<std::pair<unsigned int const, ns3::Ptr<ns3::SpectrumValue> > >, std::less<unsigned int>, std::allocator<std::pair<unsigned int const, ns3::Ptr<ns3::SpectrumValue> > > >::_M_emplace_hint_unique<unsigned int const&, ns3::Ptr<ns3::SpectrumValue>&> (838,836 samples, 0.09%)
ns3::Ptr<ns3::SpectrumValue const>::Acquire (472,815 samples, 0.05%)
std::vector<std::vector<ns3::HarqProcessInfoElement_t, std::allocator<ns3::HarqProcessInfoElement_t> >, std::allocator<std::vector<ns3::HarqProcessInfoElement_t, std::allocator<ns3::HarqProcessInfoElement_t> > > >::push_back (371,903 samples, 0.04%)
ns3::Buffer::~Buffer (338,881 samples, 0.03%)
__gnu_cxx::__aligned_membuf<std::pair<unsigned short const, std::vector<std::vector<ns3::HarqProcessInfoElement_t, std::allocator<ns3::HarqProcessInfoElement_t> >, std::allocator<std::vector<ns3::HarqProcessInfoElement_t, std::allocator<ns3::HarqProcessInfoElement_t> > > > > >::_M_ptr (232,556 samples, 0.02%)
f32xsqrtf64 (164,839 samples, 0.02%)
ns3::ByteTagList::ByteTagList (157,202 samples, 0.02%)
ns3::Packet::~Packet (2,563,159 samples, 0.26%)
ns3::Ptr<ns3::LteControlMessage>& std::__cxx11::list<ns3::Ptr<ns3::LteControlMessage>, std::allocator<ns3::Ptr<ns3::LteControlMessage> > >::emplace_back<ns3::Ptr<ns3::LteControlMessage> const&> (156,292 samples, 0.02%)
std::__cxx11::list<ns3::Callback<void, ns3::PhyTransmissionStatParameters>, std::allocator<ns3::Callback<void, ns3::PhyTransmissionStatParameters> > >::begin (125,646 samples, 0.01%)
std::_Rb_tree<unsigned int, std::pair<unsigned int const, ns3::TxSpectrumModelInfo>, std::_Select1st<std::pair<unsigned int const, ns3::TxSpectrumModelInfo> >, std::less<unsigned int>, std::allocator<std::pair<unsigned int const, ns3::TxSpectrumModelInfo> > >::_M_begin (343,708 samples, 0.04%)
std::_Tuple_impl<1ul, ns3::Ptr<ns3::SpectrumValue const>, unsigned int>::~_Tuple_impl (935,788 samples, 0.10%)
std::vector<std::__cxx11::list<ns3::UlDciLteControlMessage, std::allocator<ns3::UlDciLteControlMessage> >, std::allocator<std::__cxx11::list<ns3::UlDciLteControlMessage, std::allocator<ns3::UlDciLteControlMessage> > > >::_M_range_check (215,267 samples, 0.02%)
std::vector<ns3::Ptr<ns3::PacketBurst>, std::allocator<ns3::Ptr<ns3::PacketBurst> > >::_M_range_check (145,739 samples, 0.02%)
std::vector<int, std::allocator<int> >::vector (293,137 samples, 0.03%)
ns3::Ptr<ns3::LteSpectrumPhy>::Ptr (960,925 samples, 0.10%)
ns3::SimpleRefCount<ns3::SpectrumValue, ns3::Empty, ns3::DefaultDeleter<ns3::SpectrumValue> >::Unref (508,044 samples, 0.05%)
std::_Rb_tree<unsigned short, std::pair<unsigned short const, std::vector<double, std::allocator<double> > >, std::_Select1st<std::pair<unsigned short const, std::vector<double, std::allocator<double> > > >, std::less<unsigned short>, std::allocator<std::pair<unsigned short const, std::vector<double, std::allocator<double> > > > >::_M_copy (425,223 samples, 0.04%)
ns3::Ptr<ns3::SpectrumPhy>::Ptr (160,484 samples, 0.02%)
ns3::RlcPduListElement_s* std::__uninitialized_copy<false>::__uninit_copy<__gnu_cxx::__normal_iterator<ns3::RlcPduListElement_s const*, std::vector<ns3::RlcPduListElement_s, std::allocator<ns3::RlcPduListElement_s> > >, ns3::RlcPduListElement_s*> (178,382 samples, 0.02%)
std::__cxx11::_List_base<ns3::AttributeConstructionList::Item, std::allocator<ns3::AttributeConstructionList::Item> >::_List_base (961,294 samples, 0.10%)
__gnu_cxx::__aligned_membuf<unsigned short>::_M_addr (241,097 samples, 0.02%)
operator new (195,089 samples, 0.02%)
ns3::Ptr<ns3::LteInterference>::operator (310,011 samples, 0.03%)
ns3::LteEnbPhy::StartSubFrame (19,358,790 samples, 2.00%)
std::_Rb_tree_node<std::pair<unsigned short const, std::vector<double, std::allocator<double> > > >* std::_Rb_tree<unsigned short, std::pair<unsigned short const, std::vector<double, std::allocator<double> > >, std::_Select1st<std::pair<unsigned short const, std::vector<double, std::allocator<double> > > >, std::less<unsigned short>, std::allocator<std::pair<unsigned short const, std::vector<double, std::allocator<double> > > > >::_Alloc_node::operator (310,137 samples, 0.03%)
std::_Rb_tree<int, std::pair<int const, double>, std::_Select1st<std::pair<int const, double> >, std::less<int>, std::allocator<std::pair<int const, double> > >::clear (301,718 samples, 0.03%)
std::_Rb_tree<ns3::Scheduler::EventKey, std::pair<ns3::Scheduler::EventKey const, ns3::EventImpl*>, std::_Select1st<std::pair<ns3::Scheduler::EventKey const, ns3::EventImpl*> >, std::less<ns3::Scheduler::EventKey>, std::allocator<std::pair<ns3::Scheduler::EventKey const, ns3::EventImpl*> > >::_M_get_insert_hint_unique_pos (920,658 samples, 0.09%)
void std::_Function_base::_Base_manager<std::_Bind<void (266,931 samples, 0.03%)
__sqrt_finite (155,543 samples, 0.02%)
ns3::Ptr<ns3::PropagationDelayModel>::operator bool (144,100 samples, 0.01%)
std::_Tuple_impl<3ul, ns3::Ptr<ns3::SpectrumSignalParameters>, ns3::Ptr<ns3::SpectrumPhy>, std::map<unsigned int, ns3::Ptr<ns3::SpectrumValue>, std::less<unsigned int>, std::allocator<std::pair<unsigned int const, ns3::Ptr<ns3::SpectrumValue> > > > >::_Tuple_impl (517,866 samples, 0.05%)
std::vector<double, std::allocator<double> >::at (291,311 samples, 0.03%)
std::_Rb_tree_node<std::pair<unsigned short const, unsigned char> >::_M_valptr (632,959 samples, 0.07%)
ns3::UeSelected_s::~UeSelected_s (156,086 samples, 0.02%)
double* std::copy<__gnu_cxx::__normal_iterator<double const*, std::vector<double, std::allocator<double> > >, double*> (775,199 samples, 0.08%)
std::__cxx11::list<ns3::Ptr<ns3::Packet>, std::allocator<ns3::Ptr<ns3::Packet> > >::clear (828,329 samples, 0.09%)
int* std::__copy_move_a<false, __gnu_cxx::__normal_iterator<int const*, std::vector<int, std::allocator<int> > >, int*> (599,025 samples, 0.06%)
std::_Rb_tree_decrement (195,924 samples, 0.02%)
std::vector<ns3::Ptr<ns3::Object>, std::allocator<ns3::Ptr<ns3::Object> > >::vector (604,571 samples, 0.06%)
__gnu_cxx::__aligned_membuf<ns3::UlDciLteControlMessage>::_M_ptr (283,830 samples, 0.03%)
std::_Tuple_impl<0ul, ns3::LteInterference*, ns3::Ptr<ns3::SpectrumValue const>, unsigned int>::~_Tuple_impl (976,372 samples, 0.10%)
decltype (979,889 samples, 0.10%)
malloc (333,876 samples, 0.03%)
ns3::Object::Initialize (214,377 samples, 0.02%)
std::allocator_traits<std::allocator<double> >::deallocate (163,066 samples, 0.02%)
std::_Rb_tree<unsigned char, std::pair<unsigned char const, ns3::LteMacSapUser*>, std::_Select1st<std::pair<unsigned char const, ns3::LteMacSapUser*> >, std::less<unsigned char>, std::allocator<std::pair<unsigned char const, ns3::LteMacSapUser*> > >::_M_mbegin (161,866 samples, 0.02%)
ns3::operator+ (373,725 samples, 0.04%)
ns3::LteSpectrumSignalParametersDataFrame::~LteSpectrumSignalParametersDataFrame (3,401,494 samples, 0.35%)
std::allocator_traits<std::allocator<std::vector<ns3::RlcPduListElement_s, std::allocator<ns3::RlcPduListElement_s> > > >::allocate (272,885 samples, 0.03%)
std::vector<unsigned char, std::allocator<unsigned char> >::at (338,936 samples, 0.03%)
std::vector<ns3::HarqProcessInfoElement_t, std::allocator<ns3::HarqProcessInfoElement_t> >::~vector (250,258 samples, 0.03%)
ns3::BufferSizeLevelBsr::BufferSize2BsrId (148,238 samples, 0.02%)
std::_Rb_tree<unsigned short, std::pair<unsigned short const, std::vector<unsigned short, std::allocator<unsigned short> > >, std::_Select1st<std::pair<unsigned short const, std::vector<unsigned short, std::allocator<unsigned short> > > >, std::less<unsigned short>, std::allocator<std::pair<unsigned short const, std::vector<unsigned short, std::allocator<unsigned short> > > > >::_M_get_insert_hint_unique_pos (303,018 samples, 0.03%)
std::tuple_element<1ul, std::tuple<ns3::LteUePhy*, unsigned int, unsigned int> >::type& std::get<1ul, ns3::LteUePhy*, unsigned int, unsigned int> (345,321 samples, 0.04%)
double* std::uninitialized_copy<__gnu_cxx::__normal_iterator<double const*, std::vector<double, std::allocator<double> > >, double*> (418,403 samples, 0.04%)
std::_Tuple_impl<4ul, ns3::Ptr<ns3::SpectrumPhy>, std::map<unsigned int, ns3::Ptr<ns3::SpectrumValue>, std::less<unsigned int>, std::allocator<std::pair<unsigned int const, ns3::Ptr<ns3::SpectrumValue> > > > >::_Tuple_impl<ns3::Ptr<ns3::SpectrumPhy>&, std::map<unsigned int, ns3::Ptr<ns3::SpectrumValue>, std::less<unsigned int>, std::allocator<std::pair<unsigned int const, ns3::Ptr<ns3::SpectrumValue> > > >&, void> (395,163 samples, 0.04%)
std::map<unsigned short, std::vector<std::vector<ns3::Ptr<ns3::PacketBurst>, std::allocator<ns3::Ptr<ns3::PacketBurst> > >, std::allocator<std::vector<ns3::Ptr<ns3::PacketBurst>, std::allocator<ns3::Ptr<ns3::PacketBurst> > > > >, std::less<unsigned short>, std::allocator<std::pair<unsigned short const, std::vector<std::vector<ns3::Ptr<ns3::PacketBurst>, std::allocator<ns3::Ptr<ns3::PacketBurst> > >, std::allocator<std::vector<ns3::Ptr<ns3::PacketBurst>, std::allocator<ns3::Ptr<ns3::PacketBurst> > > > > > > >::find (1,318,462 samples, 0.14%)
__gnu_cxx::__aligned_membuf<std::pair<unsigned char const, ns3::LteMacSapProvider::ReportBufferStatusParameters> >::_M_ptr (283,636 samples, 0.03%)
std::_Rb_tree<unsigned short, std::pair<unsigned short const, std::vector<unsigned short, std::allocator<unsigned short> > >, std::_Select1st<std::pair<unsigned short const, std::vector<unsigned short, std::allocator<unsigned short> > > >, std::less<unsigned short>, std::allocator<std::pair<unsigned short const, std::vector<unsigned short, std::allocator<unsigned short> > > > >::find (146,964 samples, 0.02%)
ns3::Ptr<ns3::SpectrumPhy> ns3::Object::GetObject<ns3::SpectrumPhy> (506,061 samples, 0.05%)
ns3::Ptr<ns3::PacketBurst>::operator= (418,721 samples, 0.04%)
std::_List_node<ns3::Ptr<ns3::PacketBurst> >::_M_valptr (136,464 samples, 0.01%)
void std::_Destroy<ns3::CqiListElement_s*, ns3::CqiListElement_s> (416,767 samples, 0.04%)
ns3::UlDciLteControlMessage::UlDciLteControlMessage (388,309 samples, 0.04%)
ns3::VendorSpecificListElement_s* std::__do_uninit_copy<__gnu_cxx::__normal_iterator<ns3::VendorSpecificListElement_s const*, std::vector<ns3::VendorSpecificListElement_s, std::allocator<ns3::VendorSpecificListElement_s> > >, ns3::VendorSpecificListElement_s*> (156,843 samples, 0.02%)
std::_Bit_iterator::operator* (166,567 samples, 0.02%)
ns3::Ptr<ns3::BsrLteControlMessage>::operator (142,163 samples, 0.01%)
std::_Function_base::_Base_manager<void (405,896 samples, 0.04%)
operator new (239,912 samples, 0.02%)
std::_Bind<void (1,111,745 samples, 0.11%)
std::vector<unsigned int, std::allocator<unsigned int> >::_S_check_init_len (571,492 samples, 0.06%)
std::_Rb_tree_iterator<std::pair<unsigned char const, ns3::LteMacSapUser*> >::operator* (248,472 samples, 0.03%)
std::_Rb_tree_node<std::pair<unsigned short const, double> >::_M_valptr (567,548 samples, 0.06%)
std::_Rb_tree_iterator<std::pair<ns3::Scheduler::EventKey const, ns3::EventImpl*> >::operator-- (195,924 samples, 0.02%)
std::_Vector_base<double, std::allocator<double> >::_M_create_storage (507,018 samples, 0.05%)
int* std::__copy_move_a<false, __gnu_cxx::__normal_iterator<int const*, std::vector<int, std::allocator<int> > >, int*> (468,442 samples, 0.05%)
std::__new_allocator<unsigned char>::deallocate (194,524 samples, 0.02%)
std::vector<bool, std::allocator<bool> >::operator= (842,802 samples, 0.09%)
std::vector<ns3::VendorSpecificListElement_s, std::allocator<ns3::VendorSpecificListElement_s> >::~vector (629,475 samples, 0.06%)
ns3::LteMacSapUser::TxOpportunityParameters::TxOpportunityParameters (163,135 samples, 0.02%)
std::_List_const_iterator<ns3::Ptr<ns3::LteControlMessage> >::operator* (275,268 samples, 0.03%)
std::_Rb_tree<unsigned int, std::pair<unsigned int const, ns3::Ptr<ns3::SpectrumValue> >, std::_Select1st<std::pair<unsigned int const, ns3::Ptr<ns3::SpectrumValue> > >, std::less<unsigned int>, std::allocator<std::pair<unsigned int const, ns3::Ptr<ns3::SpectrumValue> > > >::lower_bound (238,325 samples, 0.02%)
ns3::Ptr<ns3::SpectrumValue const>::Ptr<ns3::SpectrumValue> (235,951 samples, 0.02%)
std::map<unsigned int, ns3::Ptr<ns3::SpectrumValue>, std::less<unsigned int>, std::allocator<std::pair<unsigned int const, ns3::Ptr<ns3::SpectrumValue> > > >::map (263,384 samples, 0.03%)
void std::fill<unsigned short*, unsigned short> (157,918 samples, 0.02%)
ns3::Ptr<ns3::SpectrumModel const>::Acquire (223,430 samples, 0.02%)
std::_Vector_base<ns3::BuildDataListElement_s, std::allocator<ns3::BuildDataListElement_s> >::_Vector_impl_data::_Vector_impl_data (199,981 samples, 0.02%)
ns3::Ptr<ns3::NixVector>::Acquire (191,450 samples, 0.02%)
std::vector<unsigned short, std::allocator<unsigned short> >::resize (343,043 samples, 0.04%)
ns3::TagBuffer::ReadU8 (154,581 samples, 0.02%)
std::_List_const_iterator<ns3::Ptr<ns3::LteControlMessage> >::operator* (644,591 samples, 0.07%)
ns3::Ptr<ns3::BsrLteControlMessage> ns3::Create<ns3::BsrLteControlMessage> (556,282 samples, 0.06%)
ns3::BuildDataListElement_s::BuildDataListElement_s (189,091 samples, 0.02%)
std::_Rb_tree<unsigned short, std::pair<unsigned short const, std::vector<unsigned char, std::allocator<unsigned char> > >, std::_Select1st<std::pair<unsigned short const, std::vector<unsigned char, std::allocator<unsigned char> > > >, std::less<unsigned short>, std::allocator<std::pair<unsigned short const, std::vector<unsigned char, std::allocator<unsigned char> > > > >::_M_mbegin (398,471 samples, 0.04%)
ns3::Ptr<ns3::LteEnbPhy>::Ptr (308,737 samples, 0.03%)
void std::_Rb_tree<int, std::pair<int const, double>, std::_Select1st<std::pair<int const, double> >, std::less<int>, std::allocator<std::pair<int const, double> > >::_M_construct_node<std::pair<int const, double> const&> (205,403 samples, 0.02%)
std::_Vector_base<ns3::DlInfoListElement_s::HarqStatus_e, std::allocator<ns3::DlInfoListElement_s::HarqStatus_e> >::_Vector_impl::_Vector_impl (165,586 samples, 0.02%)
std::less<ns3::Scheduler::EventKey>::operator (529,361 samples, 0.05%)
ns3::Ptr<ns3::LteControlMessage>::Acquire (234,941 samples, 0.02%)
ns3::Ptr<ns3::SpectrumValue>::operator= (291,061 samples, 0.03%)
std::_Rb_tree<unsigned short, std::pair<unsigned short const, double>, std::_Select1st<std::pair<unsigned short const, double> >, std::less<unsigned short>, std::allocator<std::pair<unsigned short const, double> > >::_M_end (151,821 samples, 0.02%)
std::vector<unsigned short, std::allocator<unsigned short> >::_M_check_len (563,247 samples, 0.06%)
ns3::LteSpectrumValueHelper::GetSpectrumModel (2,320,104 samples, 0.24%)
__gnu_cxx::__normal_iterator<double*, std::vector<double, std::allocator<double> > > std::__copy_move_a<false, __gnu_cxx::__normal_iterator<double const*, std::vector<double, std::allocator<double> > >, __gnu_cxx::__normal_iterator<double*, std::vector<double, std::allocator<double> > > > (307,652 samples, 0.03%)
__gnu_cxx::__aligned_membuf<std::pair<unsigned short const, ns3::LteEnbComponentCarrierManager::UeInfo> >::_M_ptr (234,295 samples, 0.02%)
std::_List_node<ns3::Ptr<ns3::LteControlMessage> >* std::__cxx11::list<ns3::Ptr<ns3::LteControlMessage>, std::allocator<ns3::Ptr<ns3::LteControlMessage> > >::_M_create_node<ns3::Ptr<ns3::LteControlMessage>&> (498,015 samples, 0.05%)
std::vector<unsigned char, std::allocator<unsigned char> >::_M_check_len (747,839 samples, 0.08%)
ns3::Angles::CheckIfValid (149,412 samples, 0.02%)
void (325,947 samples, 0.03%)
std::__cxx11::_List_base<ns3::Ptr<ns3::Packet>, std::allocator<ns3::Ptr<ns3::Packet> > >::_M_init (154,782 samples, 0.02%)
std::_Vector_base<unsigned char, std::allocator<unsigned char> >::_M_deallocate (149,822 samples, 0.02%)
std::enable_if<is_invocable_r_v<void, std::_Bind<void (22,443,594 samples, 2.31%)
std::_Rb_tree_iterator<std::pair<unsigned short const, unsigned char> >::_Rb_tree_iterator (238,804 samples, 0.02%)
ns3::Ptr<ns3::SpectrumValue> ns3::Create<ns3::SpectrumValue, ns3::Ptr<ns3::SpectrumModel const> const&> (1,704,960 samples, 0.18%)
__gnu_cxx::__aligned_membuf<std::pair<ns3::Scheduler::EventKey const, ns3::EventImpl*> >::_M_addr (162,805 samples, 0.02%)
std::_Rb_tree<ns3::LteSpectrumModelId, std::pair<ns3::LteSpectrumModelId const, ns3::Ptr<ns3::SpectrumModel> >, std::_Select1st<std::pair<ns3::LteSpectrumModelId const, ns3::Ptr<ns3::SpectrumModel> > >, std::less<ns3::LteSpectrumModelId>, std::allocator<std::pair<ns3::LteSpectrumModelId const, ns3::Ptr<ns3::SpectrumModel> > > >::find (220,015 samples, 0.02%)
ns3::LteRlcSm::ReportBufferStatus (6,485,597 samples, 0.67%)
std::_Rb_tree<unsigned short, std::pair<unsigned short const, ns3::pfsFlowPerf_t>, std::_Select1st<std::pair<unsigned short const, ns3::pfsFlowPerf_t> >, std::less<unsigned short>, std::allocator<std::pair<unsigned short const, ns3::pfsFlowPerf_t> > >::begin (210,507 samples, 0.02%)
ns3::LteAmc::GetUlTbSizeFromMcs (193,747 samples, 0.02%)
decltype (2,563,971 samples, 0.26%)
std::enable_if<is_invocable_r_v<void, ns3::Callback<void, ns3::UlInfoListElement_s>::Callback<void (2,054,238 samples, 0.21%)
[libc.so.6] (5,321,712 samples, 0.55%)
std::__cxx11::_List_base<ns3::Ptr<ns3::Packet>, std::allocator<ns3::Ptr<ns3::Packet> > >::_M_clear (424,329 samples, 0.04%)
std::_Rb_tree<ns3::Scheduler::EventKey, std::pair<ns3::Scheduler::EventKey const, ns3::EventImpl*>, std::_Select1st<std::pair<ns3::Scheduler::EventKey const, ns3::EventImpl*> >, std::less<ns3::Scheduler::EventKey>, std::allocator<std::pair<ns3::Scheduler::EventKey const, ns3::EventImpl*> > >::_M_lower_bound (1,465,798 samples, 0.15%)
(126,110 samples, 0.01%)
ns3::PacketBurst::GetTypeId (273,306 samples, 0.03%)
std::_Rb_tree<ns3::TbId_t, std::pair<ns3::TbId_t const, ns3::tbInfo_t>, std::_Select1st<std::pair<ns3::TbId_t const, ns3::tbInfo_t> >, std::less<ns3::TbId_t>, std::allocator<std::pair<ns3::TbId_t const, ns3::tbInfo_t> > >::find (814,139 samples, 0.08%)
void std::__cxx11::list<ns3::Ptr<ns3::LteControlMessage>, std::allocator<ns3::Ptr<ns3::LteControlMessage> > >::_M_insert<ns3::Ptr<ns3::LteControlMessage> const&> (564,216 samples, 0.06%)
std::vector<int, std::allocator<int> >::_S_relocate (124,634 samples, 0.01%)
void std::allocator_traits<std::allocator<ns3::BuildDataListElement_s> >::construct<ns3::BuildDataListElement_s, ns3::BuildDataListElement_s const&> (189,091 samples, 0.02%)
ns3::EventId::~EventId (866,210 samples, 0.09%)
std::_Rb_tree_node<std::pair<unsigned char const, ns3::LteUeMac::LcInfo> >::_M_valptr (126,661 samples, 0.01%)
ns3::Buffer::Initialize (535,246 samples, 0.06%)
std::_Rb_tree_iterator<std::pair<ns3::LteFlowId_t const, ns3::FfMacSchedSapProvider::SchedDlRlcBufferReqParameters> >::operator* (195,770 samples, 0.02%)
std::allocator<std::_List_node<ns3::Ptr<ns3::Packet> > >::allocate (313,319 samples, 0.03%)
ns3::LteMacSapUser::ReceivePduParameters::ReceivePduParameters (154,503 samples, 0.02%)
std::__cxx11::list<ns3::Ptr<ns3::LteControlMessage>, std::allocator<ns3::Ptr<ns3::LteControlMessage> > >::operator= (814,123 samples, 0.08%)
std::_Vector_base<ns3::UlInfoListElement_s, std::allocator<ns3::UlInfoListElement_s> >::~_Vector_base (160,392 samples, 0.02%)
ns3::MacCeListElement_s::~MacCeListElement_s (457,826 samples, 0.05%)
std::_Rb_tree<unsigned int, std::pair<unsigned int const, ns3::SpectrumConverter>, std::_Select1st<std::pair<unsigned int const, ns3::SpectrumConverter> >, std::less<unsigned int>, std::allocator<std::pair<unsigned int const, ns3::SpectrumConverter> > >::find (738,382 samples, 0.08%)
std::_Rb_tree<unsigned char, std::pair<unsigned char const, ns3::LteCcmMacSapProvider*>, std::_Select1st<std::pair<unsigned char const, ns3::LteCcmMacSapProvider*> >, std::less<unsigned char>, std::allocator<std::pair<unsigned char const, ns3::LteCcmMacSapProvider*> > >::_M_end (200,561 samples, 0.02%)
ns3::SpectrumValue::~SpectrumValue (392,749 samples, 0.04%)
ns3::Time::GetNanoSeconds (191,170 samples, 0.02%)
std::_Vector_base<unsigned char, std::allocator<unsigned char> >::_Vector_base (194,555 samples, 0.02%)
std::__cxx11::list<ns3::Ptr<ns3::Packet>, std::allocator<ns3::Ptr<ns3::Packet> > >::list (368,722 samples, 0.04%)
std::__cxx11::list<ns3::UlDciLteControlMessage, std::allocator<ns3::UlDciLteControlMessage> >* std::__copy_move_a1<true, std::__cxx11::list<ns3::UlDciLteControlMessage, std::allocator<ns3::UlDciLteControlMessage> >*, std::__cxx11::list<ns3::UlDciLteControlMessage, std::allocator<ns3::UlDciLteControlMessage> >*> (1,663,604 samples, 0.17%)
ns3::Ptr<ns3::EventImpl>::Ptr (195,822 samples, 0.02%)
std::_Rb_tree<unsigned short, std::pair<unsigned short const, ns3::SbMeasResult_s>, std::_Select1st<std::pair<unsigned short const, ns3::SbMeasResult_s> >, std::less<unsigned short>, std::allocator<std::pair<unsigned short const, ns3::SbMeasResult_s> > >::_M_mbegin (155,977 samples, 0.02%)
std::_Vector_base<ns3::Ptr<ns3::Object>, std::allocator<ns3::Ptr<ns3::Object> > >::~_Vector_base (148,451 samples, 0.02%)
std::vector<unsigned short, std::allocator<unsigned short> >::vector (165,594 samples, 0.02%)
void std::__cxx11::list<ns3::UlDciLteControlMessage, std::allocator<ns3::UlDciLteControlMessage> >::_M_initialize_dispatch<std::_List_const_iterator<ns3::UlDciLteControlMessage> > (3,076,347 samples, 0.32%)
std::_List_node<ns3::Ptr<ns3::LteControlMessage> >::_M_valptr (234,399 samples, 0.02%)
std::__cxx11::_List_base<ns3::Ptr<ns3::LteControlMessage>, std::allocator<ns3::Ptr<ns3::LteControlMessage> > >::~_List_base (309,041 samples, 0.03%)
std::_Rb_tree_iterator<std::pair<unsigned short const, unsigned char> >::operator* (714,872 samples, 0.07%)
std::vector<ns3::HarqProcessInfoElement_t, std::allocator<ns3::HarqProcessInfoElement_t> >::begin (261,627 samples, 0.03%)
ns3::SpectrumValue::SpectrumValue (826,746 samples, 0.09%)
ns3::SpectrumValue::SpectrumValue (332,272 samples, 0.03%)
std::vector<unsigned char, std::allocator<unsigned char> >::at (377,393 samples, 0.04%)
ns3::Ptr<ns3::Object>::Ptr<ns3::AntennaModel> (485,174 samples, 0.05%)
decltype (398,640 samples, 0.04%)
std::_Rb_tree<unsigned short, std::pair<unsigned short const, ns3::DlInfoListElement_s>, std::_Select1st<std::pair<unsigned short const, ns3::DlInfoListElement_s> >, std::less<unsigned short>, std::allocator<std::pair<unsigned short const, ns3::DlInfoListElement_s> > >::_Rb_tree_impl<std::less<unsigned short>, true>::_Rb_tree_impl (313,901 samples, 0.03%)
ns3::Packet::Packet (1,604,788 samples, 0.17%)
ns3::SpectrumValue::operator= (1,064,743 samples, 0.11%)
std::_Select1st<std::pair<unsigned char const, ns3::LteUeMac::LcInfo> >::operator (151,315 samples, 0.02%)
std::map<unsigned short, std::vector<std::vector<ns3::HarqProcessInfoElement_t, std::allocator<ns3::HarqProcessInfoElement_t> >, std::allocator<std::vector<ns3::HarqProcessInfoElement_t, std::allocator<ns3::HarqProcessInfoElement_t> > > >, std::less<unsigned short>, std::allocator<std::pair<unsigned short const, std::vector<std::vector<ns3::HarqProcessInfoElement_t, std::allocator<ns3::HarqProcessInfoElement_t> >, std::allocator<std::vector<ns3::HarqProcessInfoElement_t, std::allocator<ns3::HarqProcessInfoElement_t> > > > > > >::find (2,994,899 samples, 0.31%)
ns3::PacketTagList::~PacketTagList (323,410 samples, 0.03%)
ns3::EnbMacMemberLteEnbPhySapUser::SubframeIndication (415,834 samples, 0.04%)
void std::_Function_base::_Base_manager<std::_Bind<void (188,902 samples, 0.02%)
std::__cxx11::_List_base<ns3::Ptr<ns3::LteControlMessage>, std::allocator<ns3::Ptr<ns3::LteControlMessage> > >::_M_clear (191,802 samples, 0.02%)
ns3::MemberLteEnbRrcSapUser<ns3::LteEnbRrcProtocolIdeal>::SendSystemInformation (188,903 samples, 0.02%)
std::vector<ns3::HarqProcessInfoElement_t, std::allocator<ns3::HarqProcessInfoElement_t> >* std::__copy_move<true, false, std::random_access_iterator_tag>::__copy_m<std::vector<ns3::HarqProcessInfoElement_t, std::allocator<ns3::HarqProcessInfoElement_t> >*, std::vector<ns3::HarqProcessInfoElement_t, std::allocator<ns3::HarqProcessInfoElement_t> >*> (148,381 samples, 0.02%)
ns3::ObjectBase::~ObjectBase (189,056 samples, 0.02%)
malloc (168,940 samples, 0.02%)
ns3::Ptr<ns3::PacketBurst> ns3::CompleteConstruct<ns3::PacketBurst> (4,210,057 samples, 0.43%)
std::_Rb_tree<unsigned short, std::pair<unsigned short const, unsigned int>, std::_Select1st<std::pair<unsigned short const, unsigned int> >, std::less<unsigned short>, std::allocator<std::pair<unsigned short const, unsigned int> > >::begin (162,137 samples, 0.02%)
std::__cxx11::list<ns3::Ptr<ns3::LteControlMessage>, std::allocator<ns3::Ptr<ns3::LteControlMessage> > >::end (158,022 samples, 0.02%)
__gnu_cxx::__normal_iterator<ns3::CeBitmap_e const*, std::vector<ns3::CeBitmap_e, std::allocator<ns3::CeBitmap_e> > >::__normal_iterator (148,109 samples, 0.02%)
std::vector<ns3::HarqProcessInfoElement_t, std::allocator<ns3::HarqProcessInfoElement_t> >::_M_move_assign (2,021,899 samples, 0.21%)
ns3::Ptr<ns3::SpectrumValue> ns3::Create<ns3::SpectrumValue, ns3::Ptr<ns3::SpectrumModel const> const&> (159,012 samples, 0.02%)
std::map<unsigned short, std::vector<double, std::allocator<double> >, std::less<unsigned short>, std::allocator<std::pair<unsigned short const, std::vector<double, std::allocator<double> > > > >::~map (231,712 samples, 0.02%)
std::_Vector_base<ns3::Ptr<ns3::Object>, std::allocator<ns3::Ptr<ns3::Object> > >::_Vector_base (200,921 samples, 0.02%)
void std::__cxx11::list<ns3::Ptr<ns3::LteControlMessage>, std::allocator<ns3::Ptr<ns3::LteControlMessage> > >::_M_initialize_dispatch<std::_List_const_iterator<ns3::Ptr<ns3::LteControlMessage> > > (1,272,114 samples, 0.13%)
std::_Bind<void (410,482 samples, 0.04%)
ns3::AttributeConstructionList::~AttributeConstructionList (332,038 samples, 0.03%)
std::vector<ns3::HarqProcessInfoElement_t, std::allocator<ns3::HarqProcessInfoElement_t> >::_M_move_assign (148,381 samples, 0.02%)
std::vector<ns3::MacCeListElement_s, std::allocator<ns3::MacCeListElement_s> >::at (309,993 samples, 0.03%)
std::_Vector_base<ns3::HarqProcessInfoElement_t, std::allocator<ns3::HarqProcessInfoElement_t> >::_Vector_base (550,304 samples, 0.06%)
std::_Rb_tree_iterator<std::pair<unsigned short const, ns3::DlInfoListElement_s> >::_Rb_tree_iterator (124,409 samples, 0.01%)
ns3::TimeStep (329,548 samples, 0.03%)
std::_Vector_base<unsigned char, std::allocator<unsigned char> >::_Vector_impl_data::_Vector_impl_data (148,226 samples, 0.02%)
__gnu_cxx::__aligned_membuf<std::pair<unsigned short const, std::vector<std::vector<ns3::Ptr<ns3::PacketBurst>, std::allocator<ns3::Ptr<ns3::PacketBurst> > >, std::allocator<std::vector<ns3::Ptr<ns3::PacketBurst>, std::allocator<ns3::Ptr<ns3::PacketBurst> > > > > > >::_M_ptr (155,635 samples, 0.02%)
std::_Rb_tree_node<std::pair<unsigned short const, std::vector<double, std::allocator<double> > > >* std::_Rb_tree<unsigned short, std::pair<unsigned short const, std::vector<double, std::allocator<double> > >, std::_Select1st<std::pair<unsigned short const, std::vector<double, std::allocator<double> > > >, std::less<unsigned short>, std::allocator<std::pair<unsigned short const, std::vector<double, std::allocator<double> > > > >::_M_clone_node<false, std::_Rb_tree<unsigned short, std::pair<unsigned short const, std::vector<double, std::allocator<double> > >, std::_Select1st<std::pair<unsigned short const, std::vector<double, std::allocator<double> > > >, std::less<unsigned short>, std::allocator<std::pair<unsigned short const, std::vector<double, std::allocator<double> > > > >::_Alloc_node> (347,372 samples, 0.04%)
void std::allocator_traits<std::allocator<std::_Rb_tree_node<std::pair<unsigned short const, std::vector<double, std::allocator<double> > > > > >::destroy<std::pair<unsigned short const, std::vector<double, std::allocator<double> > > > (193,911 samples, 0.02%)
std::_Rb_tree<unsigned int, std::pair<unsigned int const, ns3::SpectrumConverter>, std::_Select1st<std::pair<unsigned int const, ns3::SpectrumConverter> >, std::less<unsigned int>, std::allocator<std::pair<unsigned int const, ns3::SpectrumConverter> > >::_S_key (240,712 samples, 0.02%)
ns3::SimpleRefCount<ns3::LteControlMessage, ns3::Empty, ns3::DefaultDeleter<ns3::LteControlMessage> >::SimpleRefCount (152,002 samples, 0.02%)
__gnu_cxx::__aligned_membuf<std::pair<ns3::TbId_t const, ns3::tbInfo_t> >::_M_ptr (204,057 samples, 0.02%)
std::_Rb_tree_iterator<std::pair<ns3::TbId_t const, ns3::tbInfo_t> >::operator* (791,920 samples, 0.08%)
std::vector<ns3::CqiListElement_s, std::allocator<ns3::CqiListElement_s> >::push_back (234,240 samples, 0.02%)
int* std::__uninitialized_copy<true>::__uninit_copy<__gnu_cxx::__normal_iterator<int const*, std::vector<int, std::allocator<int> > >, int*> (833,507 samples, 0.09%)
std::_Head_base<1ul, double const&, false>::_M_head (200,778 samples, 0.02%)
ns3::operator* (1,238,991 samples, 0.13%)
std::vector<unsigned char, std::allocator<unsigned char> >::vector (344,519 samples, 0.04%)
double* std::__copy_move_a1<false, double const*, double*> (200,338 samples, 0.02%)
std::allocator_traits<std::allocator<unsigned short> >::allocate (378,466 samples, 0.04%)
ns3::Ptr<ns3::MatrixArray<std::complex<double> > const>::Acquire (192,272 samples, 0.02%)
ns3::Ptr<ns3::SpectrumValue const>::Ptr (396,945 samples, 0.04%)
void std::_Rb_tree<ns3::Scheduler::EventKey, std::pair<ns3::Scheduler::EventKey const, ns3::EventImpl*>, std::_Select1st<std::pair<ns3::Scheduler::EventKey const, ns3::EventImpl*> >, std::less<ns3::Scheduler::EventKey>, std::allocator<std::pair<ns3::Scheduler::EventKey const, ns3::EventImpl*> > >::_M_construct_node<std::pair<ns3::Scheduler::EventKey, ns3::EventImpl*> > (405,977 samples, 0.04%)
ns3::LtePhy::GetControlMessages[abi:cxx11] (5,327,384 samples, 0.55%)
ns3::Ptr<ns3::SpectrumModel const>::operator= (252,993 samples, 0.03%)
std::vector<unsigned char, std::allocator<unsigned char> >::operator= (127,305 samples, 0.01%)
ns3::DlInfoListElement_s::DlInfoListElement_s (152,454 samples, 0.02%)
void ns3::Callback<void, std::__cxx11::list<ns3::Ptr<ns3::LteControlMessage>, std::allocator<ns3::Ptr<ns3::LteControlMessage> > > >::Callback<void (74,700,874 samples, 7.70%) void n..
std::__cxx11::_List_base<ns3::Ptr<ns3::LteControlMessage>, std::allocator<ns3::Ptr<ns3::LteControlMessage> > >::~_List_base (343,413 samples, 0.04%)
ns3::Ptr<ns3::PacketBurst>::Ptr (203,782 samples, 0.02%)
std::__cxx11::_List_base<ns3::AttributeConstructionList::Item, std::allocator<ns3::AttributeConstructionList::Item> >::_List_impl::_List_impl (374,981 samples, 0.04%)
unsigned long* std::copy<unsigned long*, unsigned long*> (260,141 samples, 0.03%)
std::map<unsigned int, ns3::Ptr<ns3::SpectrumValue>, std::less<unsigned int>, std::allocator<std::pair<unsigned int const, ns3::Ptr<ns3::SpectrumValue> > > >::map (719,320 samples, 0.07%)
void std::_Destroy<ns3::DlInfoListElement_s::HarqStatus_e*, ns3::DlInfoListElement_s::HarqStatus_e> (305,928 samples, 0.03%)
std::_Rb_tree_node<std::pair<int const, double> >* std::_Rb_tree<int, std::pair<int const, double>, std::_Select1st<std::pair<int const, double> >, std::less<int>, std::allocator<std::pair<int const, double> > >::_M_create_node<std::pair<int, double> > (461,183 samples, 0.05%)
std::vector<ns3::MacCeListElement_s, std::allocator<ns3::MacCeListElement_s> >::_M_erase_at_end (796,900 samples, 0.08%)
std::_Rb_tree_node<std::pair<unsigned int const, ns3::Ptr<ns3::SpectrumValue> > >* std::_Rb_tree<unsigned int, std::pair<unsigned int const, ns3::Ptr<ns3::SpectrumValue> >, std::_Select1st<std::pair<unsigned int const, ns3::Ptr<ns3::SpectrumValue> > >, std::less<unsigned int>, std::allocator<std::pair<unsigned int const, ns3::Ptr<ns3::SpectrumValue> > > >::_M_copy<false, std::_Rb_tree<unsigned int, std::pair<unsigned int const, ns3::Ptr<ns3::SpectrumValue> >, std::_Select1st<std::pair<unsigned int const, ns3::Ptr<ns3::SpectrumValue> > >, std::less<unsigned int>, std::allocator<std::pair<unsigned int const, ns3::Ptr<ns3::SpectrumValue> > > >::_Alloc_node> (878,011 samples, 0.09%)
__gnu_cxx::__aligned_membuf<std::pair<ns3::Scheduler::EventKey const, ns3::EventImpl*> >::_M_ptr (461,464 samples, 0.05%)
std::_Rb_tree_node<std::pair<unsigned int const, ns3::Ptr<ns3::SpectrumValue> > >* std::_Rb_tree<unsigned int, std::pair<unsigned int const, ns3::Ptr<ns3::SpectrumValue> >, std::_Select1st<std::pair<unsigned int const, ns3::Ptr<ns3::SpectrumValue> > >, std::less<unsigned int>, std::allocator<std::pair<unsigned int const, ns3::Ptr<ns3::SpectrumValue> > > >::_M_copy<false, std::_Rb_tree<unsigned int, std::pair<unsigned int const, ns3::Ptr<ns3::SpectrumValue> >, std::_Select1st<std::pair<unsigned int const, ns3::Ptr<ns3::SpectrumValue> > >, std::less<unsigned int>, std::allocator<std::pair<unsigned int const, ns3::Ptr<ns3::SpectrumValue> > > >::_Alloc_node> (688,048 samples, 0.07%)
std::vector<std::vector<ns3::Ptr<ns3::PacketBurst>, std::allocator<ns3::Ptr<ns3::PacketBurst> > >, std::allocator<std::vector<ns3::Ptr<ns3::PacketBurst>, std::allocator<ns3::Ptr<ns3::PacketBurst> > > > >::at (152,411 samples, 0.02%)
double std::reduce<__gnu_cxx::__normal_iterator<double const*, std::vector<double, std::allocator<double> > >, double, std::plus<void> > (650,475 samples, 0.07%)
ns3::DefaultDeleter<ns3::SpectrumValue>::Delete (189,290 samples, 0.02%)
std::_Rb_tree<unsigned short, std::pair<unsigned short const, ns3::SbMeasResult_s>, std::_Select1st<std::pair<unsigned short const, ns3::SbMeasResult_s> >, std::less<unsigned short>, std::allocator<std::pair<unsigned short const, ns3::SbMeasResult_s> > >::find (231,252 samples, 0.02%)
ns3::PacketBurst::Begin (649,187 samples, 0.07%)
std::_Rb_tree_iterator<std::pair<ns3::TbId_t const, ns3::tbInfo_t> > std::_Rb_tree<ns3::TbId_t, std::pair<ns3::TbId_t const, ns3::tbInfo_t>, std::_Select1st<std::pair<ns3::TbId_t const, ns3::tbInfo_t> >, std::less<ns3::TbId_t>, std::allocator<std::pair<ns3::TbId_t const, ns3::tbInfo_t> > >::_M_emplace_hint_unique<std::pair<ns3::TbId_t, ns3::tbInfo_t> > (2,868,330 samples, 0.30%)
std::vector<unsigned short, std::allocator<unsigned short> >::vector (302,989 samples, 0.03%)
std::_Rb_tree_iterator<std::pair<ns3::LteSpectrumModelId const, ns3::Ptr<ns3::SpectrumModel> > >::operator (234,452 samples, 0.02%)
std::_Bvector_base<std::allocator<bool> >::_Bvector_impl_data::_M_reset (153,274 samples, 0.02%)
std::_Rb_tree<ns3::LteSpectrumModelId, std::pair<ns3::LteSpectrumModelId const, ns3::Ptr<ns3::SpectrumModel> >, std::_Select1st<std::pair<ns3::LteSpectrumModelId const, ns3::Ptr<ns3::SpectrumModel> > >, std::less<ns3::LteSpectrumModelId>, std::allocator<std::pair<ns3::LteSpectrumModelId const, ns3::Ptr<ns3::SpectrumModel> > > >::_S_key (418,561 samples, 0.04%)
ns3::SimpleRefCount<ns3::Object, ns3::ObjectBase, ns3::ObjectDeleter>::GetReferenceCount (169,529 samples, 0.02%)
std::allocator<std::_Rb_tree_node<std::pair<int const, double> > >::allocate (199,176 samples, 0.02%)
std::_Any_data::_M_access (231,298 samples, 0.02%)
__gnu_cxx::__normal_iterator<ns3::MacCeListElement_s*, std::vector<ns3::MacCeListElement_s, std::allocator<ns3::MacCeListElement_s> > > std::vector<ns3::MacCeListElement_s, std::allocator<ns3::MacCeListElement_s> >::insert<__gnu_cxx::__normal_iterator<ns3::MacCeListElement_s*, std::vector<ns3::MacCeListElement_s, std::allocator<ns3::MacCeListElement_s> > >, void> (2,564,176 samples, 0.26%)
ns3::DefaultSimulatorImpl::Schedule (1,482,842 samples, 0.15%)
ns3::SimpleRefCount<ns3::Object, ns3::ObjectBase, ns3::ObjectDeleter>::Unref (8,236,952 samples, 0.85%)
std::__cxx11::_List_base<ns3::AttributeConstructionList::Item, std::allocator<ns3::AttributeConstructionList::Item> >::~_List_base (248,847 samples, 0.03%)
ns3::Node::GetId (131,119 samples, 0.01%)
ns3::EventImpl::Invoke (2,105,662 samples, 0.22%)
std::_Rb_tree<unsigned short, std::pair<unsigned short const, std::map<unsigned char, ns3::LteMacSapUser*, std::less<unsigned char>, std::allocator<std::pair<unsigned char const, ns3::LteMacSapUser*> > > >, std::_Select1st<std::pair<unsigned short const, std::map<unsigned char, ns3::LteMacSapUser*, std::less<unsigned char>, std::allocator<std::pair<unsigned char const, ns3::LteMacSapUser*> > > > >, std::less<unsigned short>, std::allocator<std::pair<unsigned short const, std::map<unsigned char, ns3::LteMacSapUser*, std::less<unsigned char>, std::allocator<std::pair<unsigned char const, ns3::LteMacSapUser*> > > > > >::_M_mbegin (194,122 samples, 0.02%)
std::enable_if<is_invocable_r_v<void, void (73,085,767 samples, 7.54%) std::e..
std::vector<int, std::allocator<int> >::max_size (128,242 samples, 0.01%)
ns3::ByteTagList::Add (831,259 samples, 0.09%)
void std::__cxx11::list<ns3::Ptr<ns3::LteControlMessage>, std::allocator<ns3::Ptr<ns3::LteControlMessage> > >::_M_insert<ns3::Ptr<ns3::LteControlMessage> const&> (1,452,841 samples, 0.15%)
void std::__cxx11::list<ns3::Ptr<ns3::LteControlMessage>, std::allocator<ns3::Ptr<ns3::LteControlMessage> > >::_M_initialize_dispatch<std::_List_const_iterator<ns3::Ptr<ns3::LteControlMessage> > > (1,343,666 samples, 0.14%)
__gnu_cxx::__normal_iterator<std::__cxx11::list<ns3::Ptr<ns3::LteControlMessage>, std::allocator<ns3::Ptr<ns3::LteControlMessage> > > const*, std::vector<std::__cxx11::list<ns3::Ptr<ns3::LteControlMessage>, std::allocator<ns3::Ptr<ns3::LteControlMessage> > >, std::allocator<std::__cxx11::list<ns3::Ptr<ns3::LteControlMessage>, std::allocator<ns3::Ptr<ns3::LteControlMessage> > > > > >::difference_type __gnu_cxx::operator-<std::__cxx11::list<ns3::Ptr<ns3::LteControlMessage>, std::allocator<ns3::Ptr<ns3::LteControlMessage> > > const*, std::vector<std::__cxx11::list<ns3::Ptr<ns3::LteControlMessage>, std::allocator<ns3::Ptr<ns3::LteControlMessage> > >, std::allocator<std::__cxx11::list<ns3::Ptr<ns3::LteControlMessage>, std::allocator<ns3::Ptr<ns3::LteControlMessage> > > > > > (346,160 samples, 0.04%)
std::_Tuple_impl<2ul, double, ns3::Ptr<ns3::SpectrumSignalParameters>, ns3::Ptr<ns3::SpectrumPhy>, std::map<unsigned int, ns3::Ptr<ns3::SpectrumValue>, std::less<unsigned int>, std::allocator<std::pair<unsigned int const, ns3::Ptr<ns3::SpectrumValue> > > > >::_Tuple_impl (552,616 samples, 0.06%)
ns3::Ptr<ns3::PacketBurst>::operator= (229,336 samples, 0.02%)
std::_Rb_tree_node<std::pair<unsigned short const, std::vector<double, std::allocator<double> > > >* std::_Rb_tree<unsigned short, std::pair<unsigned short const, std::vector<double, std::allocator<double> > >, std::_Select1st<std::pair<unsigned short const, std::vector<double, std::allocator<double> > > >, std::less<unsigned short>, std::allocator<std::pair<unsigned short const, std::vector<double, std::allocator<double> > > > >::_M_copy<false, std::_Rb_tree<unsigned short, std::pair<unsigned short const, std::vector<double, std::allocator<double> > >, std::_Select1st<std::pair<unsigned short const, std::vector<double, std::allocator<double> > > >, std::less<unsigned short>, std::allocator<std::pair<unsigned short const, std::vector<double, std::allocator<double> > > > >::_Alloc_node> (425,223 samples, 0.04%)
std::vector<ns3::FfMacSchedSapProvider::SchedUlCqiInfoReqParameters, std::allocator<ns3::FfMacSchedSapProvider::SchedUlCqiInfoReqParameters> >::clear (1,175,215 samples, 0.12%)
void std::_Destroy<unsigned short*> (155,477 samples, 0.02%)
ns3::MapScheduler::Insert (1,924,172 samples, 0.20%)
std::__new_allocator<ns3::DlInfoListElement_s::HarqStatus_e>::allocate (145,308 samples, 0.01%)
std::__cxx11::list<ns3::Callback<void, ns3::Ptr<ns3::SpectrumPhy const>, ns3::Ptr<ns3::SpectrumPhy const>, double>, std::allocator<ns3::Callback<void, ns3::Ptr<ns3::SpectrumPhy const>, ns3::Ptr<ns3::SpectrumPhy const>, double> > >::end (161,602 samples, 0.02%)
ns3::MultiModelSpectrumChannel::FindAndEventuallyAddTxSpectrumModel (2,239,555 samples, 0.23%)
unsigned short* std::__copy_move_a1<true, unsigned short*, unsigned short*> (140,404 samples, 0.01%)
ns3::SpectrumValue::~SpectrumValue (431,105 samples, 0.04%)
std::_Bit_iterator std::__copy_move_a<false, std::_Bit_iterator, std::_Bit_iterator> (749,593 samples, 0.08%)
ns3::ConstantPositionMobilityModel::DoGetPosition (233,482 samples, 0.02%)
std::_List_iterator<ns3::Ptr<ns3::Packet> >::_List_iterator (155,009 samples, 0.02%)
__dynamic_cast (157,542 samples, 0.02%)
__gnu_cxx::__enable_if<std::__is_scalar<double>::__value, void>::__type std::__fill_a1<double*, double> (229,101 samples, 0.02%)
std::__cxx11::list<ns3::Ptr<ns3::LteControlMessage>, std::allocator<ns3::Ptr<ns3::LteControlMessage> > >::splice (416,066 samples, 0.04%)
ns3::LogComponent::IsEnabled (147,616 samples, 0.02%)
ns3::DlInfoListElement_s::HarqStatus_e* std::copy<__gnu_cxx::__normal_iterator<ns3::DlInfoListElement_s::HarqStatus_e const*, std::vector<ns3::DlInfoListElement_s::HarqStatus_e, std::allocator<ns3::DlInfoListElement_s::HarqStatus_e> > >, ns3::DlInfoListElement_s::HarqStatus_e*> (234,294 samples, 0.02%)
std::__detail::_List_node_header::_List_node_header (627,016 samples, 0.06%)
std::_Vector_base<std::vector<ns3::RlcPduListElement_s, std::allocator<ns3::RlcPduListElement_s> >, std::allocator<std::vector<ns3::RlcPduListElement_s, std::allocator<ns3::RlcPduListElement_s> > > >::_M_allocate (311,673 samples, 0.03%)
ns3::SpectrumValue::operator= (872,797 samples, 0.09%)
double* std::__copy_move_a<false, __gnu_cxx::__normal_iterator<double const*, std::vector<double, std::allocator<double> > >, double*> (433,103 samples, 0.04%)
__gnu_cxx::__normal_iterator<ns3::Callback<void, ns3::SpectrumValue const&>*, std::vector<ns3::Callback<void, ns3::SpectrumValue const&>, std::allocator<ns3::Callback<void, ns3::SpectrumValue const&> > > >::operator* (125,378 samples, 0.01%)
std::vector<unsigned char, std::allocator<unsigned char> >::_S_max_size (166,200 samples, 0.02%)
std::vector<unsigned char, std::allocator<unsigned char> >::_M_check_len (802,727 samples, 0.08%)
ns3::DefaultSimulatorImpl::Now (234,121 samples, 0.02%)
std::_Vector_base<double, std::allocator<double> >::~_Vector_base (233,971 samples, 0.02%)
std::_Vector_base<ns3::DlInfoListElement_s::HarqStatus_e, std::allocator<ns3::DlInfoListElement_s::HarqStatus_e> >::_Vector_impl::_Vector_impl (396,334 samples, 0.04%)
std::_Bind<void (495,402 samples, 0.05%)
std::allocator_traits<std::allocator<std::_List_node<ns3::UlDciLteControlMessage> > >::deallocate (278,972 samples, 0.03%)
std::_Rb_tree<unsigned short, std::pair<unsigned short const, ns3::Ptr<ns3::UeManager> >, std::_Select1st<std::pair<unsigned short const, ns3::Ptr<ns3::UeManager> > >, std::less<unsigned short>, std::allocator<std::pair<unsigned short const, ns3::Ptr<ns3::UeManager> > > >::_M_end (344,004 samples, 0.04%)
ns3::SimpleUeComponentCarrierManager::DoReceivePdu (2,187,838 samples, 0.23%)
std::vector<ns3::Buffer::Data*, std::allocator<ns3::Buffer::Data*> >::push_back (465,302 samples, 0.05%)
ns3::Packet::Copy (174,202 samples, 0.02%)
void std::allocator_traits<std::allocator<std::vector<ns3::HarqProcessInfoElement_t, std::allocator<ns3::HarqProcessInfoElement_t> > > >::construct<std::vector<ns3::HarqProcessInfoElement_t, std::allocator<ns3::HarqProcessInfoElement_t> >, std::vector<ns3::HarqProcessInfoElement_t, std::allocator<ns3::HarqProcessInfoElement_t> > const&> (2,568,842 samples, 0.26%)
std::_Head_base<1ul, ns3::Ptr<ns3::PacketBurst>, false>::~_Head_base (267,500 samples, 0.03%)
unsigned char* std::__uninitialized_copy_a<__gnu_cxx::__normal_iterator<unsigned char const*, std::vector<unsigned char, std::allocator<unsigned char> > >, unsigned char*, unsigned char> (662,282 samples, 0.07%)
std::__cxx11::_List_base<ns3::Ptr<ns3::LteControlMessage>, std::allocator<ns3::Ptr<ns3::LteControlMessage> > >::_M_put_node (124,394 samples, 0.01%)
std::enable_if<is_invocable_r_v<void, void (1,098,325 samples, 0.11%)
__gnu_cxx::__aligned_membuf<std::pair<unsigned short const, unsigned char> >::_M_ptr (154,865 samples, 0.02%)
std::__cxx11::list<ns3::Ptr<ns3::LteControlMessage>, std::allocator<ns3::Ptr<ns3::LteControlMessage> > >::operator= (879,906 samples, 0.09%)
void std::_Destroy<ns3::FfMacSchedSapProvider::SchedUlCqiInfoReqParameters*, ns3::FfMacSchedSapProvider::SchedUlCqiInfoReqParameters> (1,058,935 samples, 0.11%)
void std::allocator_traits<std::allocator<std::_List_node<ns3::Ptr<ns3::LteControlMessage> > > >::construct<ns3::Ptr<ns3::LteControlMessage>, ns3::Ptr<ns3::LteControlMessage> const&> (603,034 samples, 0.06%)
std::_Rb_tree_node<std::pair<unsigned short const, std::vector<double, std::allocator<double> > > >* std::_Rb_tree<unsigned short, std::pair<unsigned short const, std::vector<double, std::allocator<double> > >, std::_Select1st<std::pair<unsigned short const, std::vector<double, std::allocator<double> > > >, std::less<unsigned short>, std::allocator<std::pair<unsigned short const, std::vector<double, std::allocator<double> > > > >::_M_create_node<std::pair<unsigned short const, std::vector<double, std::allocator<double> > > const&> (310,137 samples, 0.03%)
ns3::PhichListElement_s* std::__uninitialized_copy_a<__gnu_cxx::__normal_iterator<ns3::PhichListElement_s const*, std::vector<ns3::PhichListElement_s, std::allocator<ns3::PhichListElement_s> > >, ns3::PhichListElement_s*, ns3::PhichListElement_s> (202,017 samples, 0.02%)
ns3::LteSpectrumSignalParametersDlCtrlFrame::LteSpectrumSignalParametersDlCtrlFrame (729,950 samples, 0.08%)
std::__cxx11::_List_base<ns3::AttributeConstructionList::Item, std::allocator<ns3::AttributeConstructionList::Item> >::~_List_base (194,036 samples, 0.02%)
std::vector<unsigned short, std::allocator<unsigned short> >::end (233,069 samples, 0.02%)
std::tuple<ns3::LteEnbPhy*, ns3::Ptr<ns3::PacketBurst> >::~tuple (384,441 samples, 0.04%)
std::_Rb_tree<unsigned char, std::pair<unsigned char const, ns3::LteMacSapProvider*>, std::_Select1st<std::pair<unsigned char const, ns3::LteMacSapProvider*> >, std::less<unsigned char>, std::allocator<std::pair<unsigned char const, ns3::LteMacSapProvider*> > >::_M_lower_bound (741,372 samples, 0.08%)
ns3::LteUeMac::DoReceiveLteControlMessage (45,310,234 samples, 4.67%) ns3..
std::map<unsigned int, ns3::Ptr<ns3::SpectrumValue>, std::less<unsigned int>, std::allocator<std::pair<unsigned int const, ns3::Ptr<ns3::SpectrumValue> > > >::map (155,456 samples, 0.02%)
std::__cxx11::list<ns3::Ptr<ns3::LteControlMessage>, std::allocator<ns3::Ptr<ns3::LteControlMessage> > >::~list (757,885 samples, 0.08%)
std::_Rb_tree<unsigned char, std::pair<unsigned char const, ns3::LteMacSapUser*>, std::_Select1st<std::pair<unsigned char const, ns3::LteMacSapUser*> >, std::less<unsigned char>, std::allocator<std::pair<unsigned char const, ns3::LteMacSapUser*> > >::_S_right (160,926 samples, 0.02%)
std::__cxx11::_List_base<ns3::Ptr<ns3::Packet>, std::allocator<ns3::Ptr<ns3::Packet> > >::_M_put_node (503,112 samples, 0.05%)
ns3::LteSpectrumPhy::StartTxDlCtrlFrame (5,343,400 samples, 0.55%)
std::map<unsigned int, ns3::RxSpectrumModelInfo, std::less<unsigned int>, std::allocator<std::pair<unsigned int const, ns3::RxSpectrumModelInfo> > >::begin (295,643 samples, 0.03%)
ns3::MacCeValue_u::MacCeValue_u (300,339 samples, 0.03%)
ns3::HarqProcessInfoElement_t* std::__copy_move_a1<false, ns3::HarqProcessInfoElement_t const*, ns3::HarqProcessInfoElement_t*> (124,767 samples, 0.01%)
std::_Function_handler<void (488,113 samples, 0.05%)
unsigned short* std::__miter_base<unsigned short*> (233,316 samples, 0.02%)
double* std::__uninitialized_default_n_a<double*, unsigned long, double> (267,489 samples, 0.03%)
ns3::Simulator::Run (22,443,594 samples, 2.31%)
ns3::LteInterference::EndRx (38,592,765 samples, 3.98%) ns..
std::__is_constant_evaluated (235,304 samples, 0.02%)
ns3::MakeEvent<void (8,821,901 samples, 0.91%)
ns3::EventId::operator= (817,259 samples, 0.08%)
std::function<void (563,988 samples, 0.06%)
std::_Vector_base<ns3::BuildRarListElement_s, std::allocator<ns3::BuildRarListElement_s> >::_Vector_base (274,244 samples, 0.03%)
ns3::LteEnbMac::DoSubframeIndication (20,436,391 samples, 2.11%)
std::_Bit_iterator std::__copy_move_a1<false, std::_Bit_const_iterator, std::_Bit_iterator> (419,348 samples, 0.04%)
void std::_Rb_tree<unsigned short, std::pair<unsigned short const, std::vector<double, std::allocator<double> > >, std::_Select1st<std::pair<unsigned short const, std::vector<double, std::allocator<double> > > >, std::less<unsigned short>, std::allocator<std::pair<unsigned short const, std::vector<double, std::allocator<double> > > > >::_M_construct_node<std::pair<unsigned short const, std::vector<double, std::allocator<double> > > const&> (2,970,837 samples, 0.31%)
std::_List_node<ns3::Ptr<ns3::LteControlMessage> >* std::__cxx11::list<ns3::Ptr<ns3::LteControlMessage>, std::allocator<ns3::Ptr<ns3::LteControlMessage> > >::_M_create_node<ns3::Ptr<ns3::LteControlMessage> const&> (186,142 samples, 0.02%)
std::_Rb_tree<unsigned short, std::pair<unsigned short const, std::vector<double, std::allocator<double> > >, std::_Select1st<std::pair<unsigned short const, std::vector<double, std::allocator<double> > > >, std::less<unsigned short>, std::allocator<std::pair<unsigned short const, std::vector<double, std::allocator<double> > > > >::_M_drop_node (239,459 samples, 0.02%)
std::_Tuple_impl<3ul, ns3::Ptr<ns3::SpectrumSignalParameters>, ns3::Ptr<ns3::SpectrumPhy>, std::map<unsigned int, ns3::Ptr<ns3::SpectrumValue>, std::less<unsigned int>, std::allocator<std::pair<unsigned int const, ns3::Ptr<ns3::SpectrumValue> > > > >::_Tuple_impl (340,851 samples, 0.04%)
double* std::__fill_n_a<double*, unsigned long, double> (203,543 samples, 0.02%)
std::_Rb_tree<unsigned short, unsigned short, std::_Identity<unsigned short>, std::less<unsigned short>, std::allocator<unsigned short> >::find (417,874 samples, 0.04%)
std::map<unsigned int, ns3::Ptr<ns3::SpectrumValue>, std::less<unsigned int>, std::allocator<std::pair<unsigned int const, ns3::Ptr<ns3::SpectrumValue> > > >::map (510,421 samples, 0.05%)
ns3::Time::GetMilliSeconds (370,485 samples, 0.04%)
void ns3::Simulator::ScheduleWithContext<void (302,319 samples, 0.03%)
ns3::Ptr<ns3::SpectrumSignalParameters>::operator (158,234 samples, 0.02%)
ns3::Ptr<ns3::PacketBurst>::~Ptr (1,871,525 samples, 0.19%)
ns3::Simulator::Now (232,342 samples, 0.02%)
ns3::Ptr<ns3::SpectrumValue const>& std::__get_helper<1ul, ns3::Ptr<ns3::SpectrumValue const>, unsigned int> (437,377 samples, 0.05%)
ns3::Ptr<ns3::SpectrumValue>::Ptr (158,937 samples, 0.02%)
std::_Rb_tree<ns3::Scheduler::EventKey, std::pair<ns3::Scheduler::EventKey const, ns3::EventImpl*>, std::_Select1st<std::pair<ns3::Scheduler::EventKey const, ns3::EventImpl*> >, std::less<ns3::Scheduler::EventKey>, std::allocator<std::pair<ns3::Scheduler::EventKey const, ns3::EventImpl*> > >::_Auto_node::_Auto_node<std::pair<ns3::Scheduler::EventKey, ns3::EventImpl*> > (461,688 samples, 0.05%)
std::allocator<std::_Rb_tree_node<std::pair<ns3::Scheduler::EventKey const, ns3::EventImpl*> > >::allocate (258,278 samples, 0.03%)
std::vector<bool, std::allocator<bool> >::begin (144,500 samples, 0.01%)
ns3::LteHelper::InstallEnbDevice (397,186 samples, 0.04%)
std::_Rb_tree<unsigned short, std::pair<unsigned short const, ns3::pfsFlowPerf_t>, std::_Select1st<std::pair<unsigned short const, ns3::pfsFlowPerf_t> >, std::less<unsigned short>, std::allocator<std::pair<unsigned short const, ns3::pfsFlowPerf_t> > >::_M_lower_bound (1,161,944 samples, 0.12%)
signed char& std::vector<signed char, std::allocator<signed char> >::emplace_back<signed char> (645,216 samples, 0.07%)
ns3::MemberSchedSapProvider<ns3::PfFfMacScheduler>::SchedUlMacCtrlInfoReq (867,311 samples, 0.09%)
unsigned char* std::__uninitialized_copy_a<__gnu_cxx::__normal_iterator<unsigned char const*, std::vector<unsigned char, std::allocator<unsigned char> > >, unsigned char*, unsigned char> (190,052 samples, 0.02%)
ns3::EnbMacMemberFfMacSchedSapUser::SchedUlConfigInd (5,236,229 samples, 0.54%)
std::vector<ns3::BuildBroadcastListElement_s, std::allocator<ns3::BuildBroadcastListElement_s> >::vector (853,778 samples, 0.09%)
std::_Tuple_impl<0ul, double const&, double const&, double const&>::_Tuple_impl (1,012,471 samples, 0.10%)
std::vector<bool, std::allocator<bool> >::begin (264,203 samples, 0.03%)
std::_Vector_base<ns3::Ptr<ns3::Object>, std::allocator<ns3::Ptr<ns3::Object> > >::_Vector_base (386,549 samples, 0.04%)
std::_Rb_tree_node<std::pair<unsigned short const, std::vector<double, std::allocator<double> > > >* std::_Rb_tree<unsigned short, std::pair<unsigned short const, std::vector<double, std::allocator<double> > >, std::_Select1st<std::pair<unsigned short const, std::vector<double, std::allocator<double> > > >, std::less<unsigned short>, std::allocator<std::pair<unsigned short const, std::vector<double, std::allocator<double> > > > >::_M_clone_node<false, std::_Rb_tree<unsigned short, std::pair<unsigned short const, std::vector<double, std::allocator<double> > >, std::_Select1st<std::pair<unsigned short const, std::vector<double, std::allocator<double> > > >, std::less<unsigned short>, std::allocator<std::pair<unsigned short const, std::vector<double, std::allocator<double> > > > >::_Alloc_node> (3,678,586 samples, 0.38%)
double* std::__uninitialized_copy_a<__gnu_cxx::__normal_iterator<double const*, std::vector<double, std::allocator<double> > >, double*, double> (1,019,777 samples, 0.11%)
std::__cxx11::list<ns3::UlDciLteControlMessage, std::allocator<ns3::UlDciLteControlMessage> >::~list (1,583,725 samples, 0.16%)
ns3::PfFfMacScheduler::RefreshHarqProcesses (2,902,711 samples, 0.30%)
ns3::LtePhy::SetControlMessages (654,203 samples, 0.07%)
ns3::LteSpectrumSignalParametersDlCtrlFrame::LteSpectrumSignalParametersDlCtrlFrame (1,452,066 samples, 0.15%)
std::enable_if<std::is_constructible<std::pair<ns3::Scheduler::EventKey const, ns3::EventImpl*>, std::pair<ns3::Scheduler::EventKey, ns3::EventImpl*> >::value, std::pair<std::_Rb_tree_iterator<std::pair<ns3::Scheduler::EventKey const, ns3::EventImpl*> >, bool> >::type std::map<ns3::Scheduler::EventKey, ns3::EventImpl*, std::less<ns3::Scheduler::EventKey>, std::allocator<std::pair<ns3::Scheduler::EventKey const, ns3::EventImpl*> > >::insert<std::pair<ns3::Scheduler::EventKey, ns3::EventImpl*> > (153,997 samples, 0.02%)
ns3::Object::Check (252,008 samples, 0.03%)
std::_Rb_tree<unsigned short, std::pair<unsigned short const, std::map<unsigned char, ns3::LteMacSapUser*, std::less<unsigned char>, std::allocator<std::pair<unsigned char const, ns3::LteMacSapUser*> > > >, std::_Select1st<std::pair<unsigned short const, std::map<unsigned char, ns3::LteMacSapUser*, std::less<unsigned char>, std::allocator<std::pair<unsigned char const, ns3::LteMacSapUser*> > > > >, std::less<unsigned short>, std::allocator<std::pair<unsigned short const, std::map<unsigned char, ns3::LteMacSapUser*, std::less<unsigned char>, std::allocator<std::pair<unsigned char const, ns3::LteMacSapUser*> > > > > >::_M_begin (466,586 samples, 0.05%)
std::allocator<std::_List_node<ns3::Ptr<ns3::LteControlMessage> > >::deallocate (229,384 samples, 0.02%)
ns3::TypeId::GetAttributeN (1,401,356 samples, 0.14%)
ns3::BuildDataListElement_s* std::uninitialized_copy<__gnu_cxx::__normal_iterator<ns3::BuildDataListElement_s const*, std::vector<ns3::BuildDataListElement_s, std::allocator<ns3::BuildDataListElement_s> > >, ns3::BuildDataListElement_s*> (515,194 samples, 0.05%)
void ns3::Callback<void, unsigned short, ns3::Ptr<ns3::SpectrumValue> >::Callback<void (1,074,961 samples, 0.11%)
ns3::DlInfoListElement_s::HarqStatus_e* std::__copy_move_a<false, __gnu_cxx::__normal_iterator<ns3::DlInfoListElement_s::HarqStatus_e const*, std::vector<ns3::DlInfoListElement_s::HarqStatus_e, std::allocator<ns3::DlInfoListElement_s::HarqStatus_e> > >, ns3::DlInfoListElement_s::HarqStatus_e*> (1,354,907 samples, 0.14%)
ns3::LteControlMessage::LteControlMessage (383,602 samples, 0.04%)
ns3::Ptr<ns3::Packet> ns3::Create<ns3::Packet, unsigned int&> (1,604,788 samples, 0.17%)
std::_Vector_base<unsigned char, std::allocator<unsigned char> >::_Vector_impl::_Vector_impl (157,826 samples, 0.02%)
unsigned short const* std::__niter_base<unsigned short const*, std::vector<unsigned short, std::allocator<unsigned short> > > (245,405 samples, 0.03%)
std::enable_if<is_member_pointer_v<void (1,068,378 samples, 0.11%)
std::_Function_base::~_Function_base (183,222 samples, 0.02%)
__dynamic_cast (871,347 samples, 0.09%)
ns3::DefaultDeleter<ns3::SpectrumValue>::Delete (896,241 samples, 0.09%)
void std::_Bind<void (885,817,061 samples, 91.34%) void std::_Bind<void
ns3::HigherLayerSelected_s* std::__uninitialized_copy<false>::__uninit_copy<__gnu_cxx::__normal_iterator<ns3::HigherLayerSelected_s const*, std::vector<ns3::HigherLayerSelected_s, std::allocator<ns3::HigherLayerSelected_s> > >, ns3::HigherLayerSelected_s*> (749,843 samples, 0.08%)
std::vector<ns3::DlInfoListElement_s, std::allocator<ns3::DlInfoListElement_s> >::_M_range_check (201,283 samples, 0.02%)
ns3::Packet::GetSize (289,398 samples, 0.03%)
__gnu_cxx::__normal_iterator<std::__cxx11::list<ns3::Ptr<ns3::LteControlMessage>, std::allocator<ns3::Ptr<ns3::LteControlMessage> > >*, std::vector<std::__cxx11::list<ns3::Ptr<ns3::LteControlMessage>, std::allocator<ns3::Ptr<ns3::LteControlMessage> > >, std::allocator<std::__cxx11::list<ns3::Ptr<ns3::LteControlMessage>, std::allocator<ns3::Ptr<ns3::LteControlMessage> > > > > >::base (188,865 samples, 0.02%)
std::tuple_element<0ul, std::tuple<ns3::LteUePhy*, unsigned int, unsigned int> >::type& std::get<0ul, ns3::LteUePhy*, unsigned int, unsigned int> (225,116 samples, 0.02%)
std::vector<int, std::allocator<int> >::operator= (725,734 samples, 0.07%)
operator new (195,774 samples, 0.02%)
std::_Rb_tree<unsigned short, std::pair<unsigned short const, std::vector<unsigned short, std::allocator<unsigned short> > >, std::_Select1st<std::pair<unsigned short const, std::vector<unsigned short, std::allocator<unsigned short> > > >, std::less<unsigned short>, std::allocator<std::pair<unsigned short const, std::vector<unsigned short, std::allocator<unsigned short> > > > >::_M_begin (157,856 samples, 0.02%)
ns3::Ptr<ns3::LteUePhy> ns3::CreateObject<ns3::LteUePhy, ns3::Ptr<ns3::LteSpectrumPhy>&, ns3::Ptr<ns3::LteSpectrumPhy>&> (126,589 samples, 0.01%)
std::_Rb_tree<ns3::LteSpectrumModelId, std::pair<ns3::LteSpectrumModelId const, ns3::Ptr<ns3::SpectrumModel> >, std::_Select1st<std::pair<ns3::LteSpectrumModelId const, ns3::Ptr<ns3::SpectrumModel> > >, std::less<ns3::LteSpectrumModelId>, std::allocator<std::pair<ns3::LteSpectrumModelId const, ns3::Ptr<ns3::SpectrumModel> > > >::_M_lower_bound (729,846 samples, 0.08%)
ns3::SpectrumValue::Copy (1,952,922 samples, 0.20%)
std::move_iterator<ns3::MacCeListElement_s*>::move_iterator (159,225 samples, 0.02%)
ns3::Ptr<ns3::LteSpectrumSignalParametersUlSrsFrame>::~Ptr (198,752 samples, 0.02%)
std::__new_allocator<std::_List_node<ns3::Ptr<ns3::Packet> > >::allocate (380,371 samples, 0.04%)
ns3::Ptr<ns3::SpectrumModel const>::Ptr (356,299 samples, 0.04%)
double* std::uninitialized_copy<__gnu_cxx::__normal_iterator<double const*, std::vector<double, std::allocator<double> > >, double*> (583,431 samples, 0.06%)
ns3::LogComponent::IsEnabled (323,506 samples, 0.03%)
std::allocator<double>::allocate (187,232 samples, 0.02%)
ns3::Ptr<ns3::Packet const>::Acquire (156,632 samples, 0.02%)
std::allocator_traits<std::allocator<double> >::deallocate (164,716 samples, 0.02%)
std::enable_if<std::is_constructible<std::pair<unsigned short const, ns3::DlInfoListElement_s>, std::pair<unsigned short, ns3::DlInfoListElement_s> >::value, std::pair<std::_Rb_tree_iterator<std::pair<unsigned short const, ns3::DlInfoListElement_s> >, bool> >::type std::map<unsigned short, ns3::DlInfoListElement_s, std::less<unsigned short>, std::allocator<std::pair<unsigned short const, ns3::DlInfoListElement_s> > >::insert<std::pair<unsigned short, ns3::DlInfoListElement_s> > (2,356,316 samples, 0.24%)
std::_Rb_tree<unsigned short, std::pair<unsigned short const, ns3::pfsFlowPerf_t>, std::_Select1st<std::pair<unsigned short const, ns3::pfsFlowPerf_t> >, std::less<unsigned short>, std::allocator<std::pair<unsigned short const, ns3::pfsFlowPerf_t> > >::_M_lower_bound (159,330 samples, 0.02%)
ns3::Seconds (322,115 samples, 0.03%)
std::__cxx11::_List_base<ns3::Ptr<ns3::LteControlMessage>, std::allocator<ns3::Ptr<ns3::LteControlMessage> > >::_List_impl::_List_impl (313,999 samples, 0.03%)
double* std::__uninitialized_copy<true>::__uninit_copy<__gnu_cxx::__normal_iterator<double const*, std::vector<double, std::allocator<double> > >, double*> (156,421 samples, 0.02%)
std::vector<ns3::HarqProcessInfoElement_t, std::allocator<ns3::HarqProcessInfoElement_t> >::vector (3,232,067 samples, 0.33%)
ns3::Ptr<ns3::LteChunkProcessor>::operator (151,530 samples, 0.02%)
std::vector<unsigned short, std::allocator<unsigned short> >::max_size (408,133 samples, 0.04%)
void std::allocator_traits<std::allocator<std::_List_node<ns3::Ptr<ns3::LteControlMessage> > > >::construct<ns3::Ptr<ns3::LteControlMessage>, ns3::Ptr<ns3::LteControlMessage>&> (232,855 samples, 0.02%)
std::_Rb_tree<unsigned char, std::pair<unsigned char const, ns3::LteMacSapProvider*>, std::_Select1st<std::pair<unsigned char const, ns3::LteMacSapProvider*> >, std::less<unsigned char>, std::allocator<std::pair<unsigned char const, ns3::LteMacSapProvider*> > >::_M_lower_bound (592,305 samples, 0.06%)
int* std::__uninitialized_copy<true>::__uninit_copy<__gnu_cxx::__normal_iterator<int const*, std::vector<int, std::allocator<int> > >, int*> (711,242 samples, 0.07%)
ns3::Callback<void, ns3::SpectrumValue const&>::operator (324,769 samples, 0.03%)
ns3::RlcTag::Deserialize (396,822 samples, 0.04%)
std::_Rb_tree<unsigned short, std::pair<unsigned short const, std::vector<unsigned short, std::allocator<unsigned short> > >, std::_Select1st<std::pair<unsigned short const, std::vector<unsigned short, std::allocator<unsigned short> > > >, std::less<unsigned short>, std::allocator<std::pair<unsigned short const, std::vector<unsigned short, std::allocator<unsigned short> > > > >::find (727,246 samples, 0.07%)
ns3::NoOpComponentCarrierManager::DoTransmitPdu (1,327,529 samples, 0.14%)
std::enable_if<is_invocable_r_v<void, void (15,223,770 samples, 1.57%)
std::vector<ns3::Ptr<ns3::Object>, std::allocator<ns3::Ptr<ns3::Object> > >::~vector (146,330 samples, 0.02%)
malloc (598,171 samples, 0.06%)
std::vector<std::vector<ns3::RlcPduListElement_s, std::allocator<ns3::RlcPduListElement_s> >, std::allocator<std::vector<ns3::RlcPduListElement_s, std::allocator<ns3::RlcPduListElement_s> > > >::_S_max_size (312,752 samples, 0.03%)
std::_Rb_tree<ns3::Scheduler::EventKey, std::pair<ns3::Scheduler::EventKey const, ns3::EventImpl*>, std::_Select1st<std::pair<ns3::Scheduler::EventKey const, ns3::EventImpl*> >, std::less<ns3::Scheduler::EventKey>, std::allocator<std::pair<ns3::Scheduler::EventKey const, ns3::EventImpl*> > >::_S_key (126,450 samples, 0.01%)
std::_List_node<ns3::Ptr<ns3::PacketBurst> >* std::__cxx11::list<ns3::Ptr<ns3::PacketBurst>, std::allocator<ns3::Ptr<ns3::PacketBurst> > >::_M_create_node<ns3::Ptr<ns3::PacketBurst> const&> (2,282,165 samples, 0.24%)
ns3::Ptr<ns3::SpectrumModel const>::Acquire (219,194 samples, 0.02%)
std::_Rb_tree<unsigned short, std::pair<unsigned short const, std::vector<unsigned short, std::allocator<unsigned short> > >, std::_Select1st<std::pair<unsigned short const, std::vector<unsigned short, std::allocator<unsigned short> > > >, std::less<unsigned short>, std::allocator<std::pair<unsigned short const, std::vector<unsigned short, std::allocator<unsigned short> > > > >::_Auto_node::_M_insert (235,870 samples, 0.02%)
decltype (620,289 samples, 0.06%)
void std::destroy_at<ns3::MacCeListElement_s> (679,734 samples, 0.07%)
std::set<unsigned short, std::less<unsigned short>, std::allocator<unsigned short> >::end (241,739 samples, 0.02%)
ns3::PacketMetadata::PacketMetadata (1,833,242 samples, 0.19%)
ns3::Object::~Object (1,513,714 samples, 0.16%)
ns3::DefaultDeleter<ns3::SpectrumValue>::Delete (127,422 samples, 0.01%)
std::_Bvector_base<std::allocator<bool> >::_M_deallocate (464,044 samples, 0.05%)
void std::_Destroy<ns3::Ptr<ns3::Object>*, ns3::Ptr<ns3::Object> > (194,998 samples, 0.02%)
ns3::Ptr<ns3::PacketBurst> ns3::CreateObject<ns3::PacketBurst> (375,534 samples, 0.04%)
void std::allocator_traits<std::allocator<std::__cxx11::list<ns3::Ptr<ns3::LteControlMessage>, std::allocator<ns3::Ptr<ns3::LteControlMessage> > > > >::construct<std::__cxx11::list<ns3::Ptr<ns3::LteControlMessage>, std::allocator<ns3::Ptr<ns3::LteControlMessage> > >, std::__cxx11::list<ns3::Ptr<ns3::LteControlMessage>, std::allocator<ns3::Ptr<ns3::LteControlMessage> > > const&> (228,459 samples, 0.02%)
(316,802 samples, 0.03%)
ns3::MakeEvent<void (597,366 samples, 0.06%)
unsigned char* std::__uninitialized_default_n_1<true>::__uninit_default_n<unsigned char*, unsigned long> (918,885 samples, 0.09%)
void std::__fill_a<unsigned char*, unsigned char> (539,616 samples, 0.06%)
ns3::Ptr<ns3::Scheduler>::operator (200,105 samples, 0.02%)
std::map<unsigned short, unsigned char, std::less<unsigned short>, std::allocator<std::pair<unsigned short const, unsigned char> > >::find (1,200,654 samples, 0.12%)
ns3::FfMacSchedSapProvider::SchedUlTriggerReqParameters::~SchedUlTriggerReqParameters (511,776 samples, 0.05%)
void std::_Destroy<ns3::VendorSpecificListElement_s*, ns3::VendorSpecificListElement_s> (198,417 samples, 0.02%)
void std::_Construct<ns3::MacCeListElement_s, ns3::MacCeListElement_s&> (432,867 samples, 0.04%)
std::_Rb_tree<unsigned short, std::pair<unsigned short const, std::vector<double, std::allocator<double> > >, std::_Select1st<std::pair<unsigned short const, std::vector<double, std::allocator<double> > > >, std::less<unsigned short>, std::allocator<std::pair<unsigned short const, std::vector<double, std::allocator<double> > > > >::_S_maximum (155,370 samples, 0.02%)
ns3::PfFfMacScheduler::DoSchedUlCqiInfoReq (6,622,886 samples, 0.68%)
std::_Vector_base<unsigned char, std::allocator<unsigned char> >::_Vector_base (495,697 samples, 0.05%)
ns3::NoOpComponentCarrierManager::DoTransmitPdu (5,821,892 samples, 0.60%)
ns3::EventImpl*&& std::forward<ns3::EventImpl*> (126,251 samples, 0.01%)
ns3::LteEnbPhy::StartFrame (2,983,151 samples, 0.31%)
std::_Bind<void (825,096 samples, 0.09%)
ns3::SpectrumConverter::Convert (1,680,933 samples, 0.17%)
std::_Function_handler<void (3,263,000 samples, 0.34%)
int* std::__uninitialized_copy_a<__gnu_cxx::__normal_iterator<int const*, std::vector<int, std::allocator<int> > >, int*, int> (831,586 samples, 0.09%)
std::_Vector_base<double, std::allocator<double> >::_M_create_storage (768,784 samples, 0.08%)
std::vector<bool, std::allocator<bool> >::resize (276,956 samples, 0.03%)
ns3::PacketBurst::GetSize (4,408,653 samples, 0.45%)
void std::destroy_at<ns3::CqiListElement_s> (416,767 samples, 0.04%)
ns3::Ptr<ns3::LteSpectrumPhy>::Ptr (660,447 samples, 0.07%)
std::allocator<unsigned char>::allocate (352,577 samples, 0.04%)
std::_Tuple_impl<0ul, ns3::LteEnbPhy*>::_M_head (231,471 samples, 0.02%)
std::__new_allocator<std::_List_node<ns3::Ptr<ns3::LteControlMessage> > >::allocate (185,442 samples, 0.02%)
std::vector<ns3::Buffer::Data*, std::allocator<ns3::Buffer::Data*> >::end (310,746 samples, 0.03%)
ns3::Ptr<ns3::DlHarqFeedbackLteControlMessage> ns3::DynamicCast<ns3::DlHarqFeedbackLteControlMessage, ns3::LteControlMessage> (124,981 samples, 0.01%)
std::_Rb_tree<ns3::Scheduler::EventKey, std::pair<ns3::Scheduler::EventKey const, ns3::EventImpl*>, std::_Select1st<std::pair<ns3::Scheduler::EventKey const, ns3::EventImpl*> >, std::less<ns3::Scheduler::EventKey>, std::allocator<std::pair<ns3::Scheduler::EventKey const, ns3::EventImpl*> > >::_S_key (153,333 samples, 0.02%)
int* std::__copy_move_a2<false, int const*, int*> (275,574 samples, 0.03%)
int* std::uninitialized_copy<__gnu_cxx::__normal_iterator<int const*, std::vector<int, std::allocator<int> > >, int*> (909,481 samples, 0.09%)
ns3::TimeStep (193,847 samples, 0.02%)
ns3::MultiModelSpectrumChannel::StartTx (4,243,524 samples, 0.44%)
unsigned char* std::__uninitialized_copy<true>::__uninit_copy<__gnu_cxx::__normal_iterator<unsigned char const*, std::vector<unsigned char, std::allocator<unsigned char> > >, unsigned char*> (459,117 samples, 0.05%)
ns3::Simulator::DoScheduleNow (382,100 samples, 0.04%)
void std::allocator_traits<std::allocator<std::_List_node<ns3::Ptr<ns3::Packet> > > >::destroy<ns3::Ptr<ns3::Packet> > (2,881,652 samples, 0.30%)
std::vector<unsigned int, std::allocator<unsigned int> >::~vector (686,206 samples, 0.07%)
malloc (158,423 samples, 0.02%)
std::tuple_element<4ul, std::tuple<ns3::MultiModelSpectrumChannel*, ns3::Ptr<ns3::SpectrumValue>, double, ns3::Ptr<ns3::SpectrumSignalParameters>, ns3::Ptr<ns3::SpectrumPhy>, std::map<unsigned int, ns3::Ptr<ns3::SpectrumValue>, std::less<unsigned int>, std::allocator<std::pair<unsigned int const, ns3::Ptr<ns3::SpectrumValue> > > > > >::type& std::get<4ul, ns3::MultiModelSpectrumChannel*, ns3::Ptr<ns3::SpectrumValue>, double, ns3::Ptr<ns3::SpectrumSignalParameters>, ns3::Ptr<ns3::SpectrumPhy>, std::map<unsigned int, ns3::Ptr<ns3::SpectrumValue>, std::less<unsigned int>, std::allocator<std::pair<unsigned int const, ns3::Ptr<ns3::SpectrumValue> > > > > (350,980 samples, 0.04%)
std::tuple_element<0ul, std::tuple<double const&, double const&, double const&> >::type const& std::get<0ul, double const&, double const&, double const&> (744,395 samples, 0.08%)
ns3::DefaultDeleter<ns3::EventImpl>::Delete (489,663 samples, 0.05%)
std::vector<ns3::HigherLayerSelected_s, std::allocator<ns3::HigherLayerSelected_s> >::vector (1,538,877 samples, 0.16%)
std::map<unsigned char, ns3::LteMacSapUser*, std::less<unsigned char>, std::allocator<std::pair<unsigned char const, ns3::LteMacSapUser*> > >::lower_bound (305,767 samples, 0.03%)
ns3::LteEnbMac::DoSubframeIndication (2,983,151 samples, 0.31%)
std::_Vector_base<ns3::VendorSpecificListElement_s, std::allocator<ns3::VendorSpecificListElement_s> >::_M_create_storage (156,029 samples, 0.02%)
ns3::LteChunkProcessor::End (324,769 samples, 0.03%)
unsigned short* std::__uninitialized_copy_a<std::move_iterator<unsigned short*>, unsigned short*, unsigned short> (154,651 samples, 0.02%)
std::function<void (1,212,692 samples, 0.13%)
ns3::DefaultDeleter<ns3::Packet>::Delete (4,346,874 samples, 0.45%)
__gnu_cxx::__normal_iterator<double const*, std::vector<double, std::allocator<double> > >::operator* (162,772 samples, 0.02%)
void std::allocator_traits<std::allocator<ns3::CqiListElement_s> >::construct<ns3::CqiListElement_s, ns3::CqiListElement_s const&> (234,240 samples, 0.02%)
void std::__cxx11::list<ns3::Ptr<ns3::LteControlMessage>, std::allocator<ns3::Ptr<ns3::LteControlMessage> > >::_M_initialize_dispatch<std::_List_const_iterator<ns3::Ptr<ns3::LteControlMessage> > > (798,843 samples, 0.08%)
std::tuple<ns3::MultiModelSpectrumChannel*, ns3::Ptr<ns3::SpectrumValue>, double, ns3::Ptr<ns3::SpectrumSignalParameters>, ns3::Ptr<ns3::SpectrumPhy>, std::map<unsigned int, ns3::Ptr<ns3::SpectrumValue>, std::less<unsigned int>, std::allocator<std::pair<unsigned int const, ns3::Ptr<ns3::SpectrumValue> > > > >::tuple<ns3::MultiModelSpectrumChannel*&, ns3::Ptr<ns3::SpectrumValue>&, double&, ns3::Ptr<ns3::SpectrumSignalParameters>&, ns3::Ptr<ns3::SpectrumPhy>&, std::map<unsigned int, ns3::Ptr<ns3::SpectrumValue>, std::less<unsigned int>, std::allocator<std::pair<unsigned int const, ns3::Ptr<ns3::SpectrumValue> > > >&, true, true> (245,362 samples, 0.03%)
ns3::operator+ (598,044 samples, 0.06%)
std::_Rb_tree<unsigned char, std::pair<unsigned char const, ns3::LteMacSapProvider*>, std::_Select1st<std::pair<unsigned char const, ns3::LteMacSapProvider*> >, std::less<unsigned char>, std::allocator<std::pair<unsigned char const, ns3::LteMacSapProvider*> > >::find (323,190 samples, 0.03%)
ns3::PacketMetadata::Recycle (849,631 samples, 0.09%)
std::_Rb_tree<unsigned short, std::pair<unsigned short const, std::vector<unsigned short, std::allocator<unsigned short> > >, std::_Select1st<std::pair<unsigned short const, std::vector<unsigned short, std::allocator<unsigned short> > > >, std::less<unsigned short>, std::allocator<std::pair<unsigned short const, std::vector<unsigned short, std::allocator<unsigned short> > > > >::_M_insert_node (154,048 samples, 0.02%)
std::__cxx11::list<ns3::Callback<void, ns3::Ptr<ns3::SpectrumSignalParameters> >, std::allocator<ns3::Callback<void, ns3::Ptr<ns3::SpectrumSignalParameters> > > >::end (163,732 samples, 0.02%)
std::_Vector_base<ns3::DlInfoListElement_s::HarqStatus_e, std::allocator<ns3::DlInfoListElement_s::HarqStatus_e> >::_Vector_base (341,838 samples, 0.04%)
ns3::UlDciListElement_s* std::__uninitialized_copy<false>::__uninit_copy<__gnu_cxx::__normal_iterator<ns3::UlDciListElement_s const*, std::vector<ns3::UlDciListElement_s, std::allocator<ns3::UlDciListElement_s> > >, ns3::UlDciListElement_s*> (160,843 samples, 0.02%)
std::_Rb_tree_node<std::pair<unsigned short const, ns3::DlInfoListElement_s> >* std::_Rb_tree<unsigned short, std::pair<unsigned short const, ns3::DlInfoListElement_s>, std::_Select1st<std::pair<unsigned short const, ns3::DlInfoListElement_s> >, std::less<unsigned short>, std::allocator<std::pair<unsigned short const, ns3::DlInfoListElement_s> > >::_M_create_node<std::pair<unsigned short, ns3::DlInfoListElement_s> > (1,129,994 samples, 0.12%)
ns3::LogComponent::IsEnabled (201,088 samples, 0.02%)
ns3::ObjectBase::~ObjectBase (422,911 samples, 0.04%)
std::_Tuple_impl<4ul, ns3::Ptr<ns3::SpectrumPhy>, std::map<unsigned int, ns3::Ptr<ns3::SpectrumValue>, std::less<unsigned int>, std::allocator<std::pair<unsigned int const, ns3::Ptr<ns3::SpectrumValue> > > > >::~_Tuple_impl (1,013,985 samples, 0.10%)
int* std::copy<__gnu_cxx::__normal_iterator<int const*, std::vector<int, std::allocator<int> > >, int*> (730,011 samples, 0.08%)
std::vector<double, std::allocator<double> >::vector (2,271,955 samples, 0.23%)
std::_List_node<ns3::UlDciLteControlMessage>* std::__cxx11::list<ns3::UlDciLteControlMessage, std::allocator<ns3::UlDciLteControlMessage> >::_M_create_node<ns3::UlDciLteControlMessage const&> (1,556,182 samples, 0.16%)
unsigned char* std::__niter_base<unsigned char*> (154,843 samples, 0.02%)
void std::_Rb_tree<ns3::Scheduler::EventKey, std::pair<ns3::Scheduler::EventKey const, ns3::EventImpl*>, std::_Select1st<std::pair<ns3::Scheduler::EventKey const, ns3::EventImpl*> >, std::less<ns3::Scheduler::EventKey>, std::allocator<std::pair<ns3::Scheduler::EventKey const, ns3::EventImpl*> > >::_M_construct_node<std::pair<ns3::Scheduler::EventKey, ns3::EventImpl*> > (695,882 samples, 0.07%)
std::_Vector_base<unsigned short, std::allocator<unsigned short> >::_M_allocate (417,726 samples, 0.04%)
std::_Rb_tree<ns3::LteFlowId_t, std::pair<ns3::LteFlowId_t const, ns3::FfMacSchedSapProvider::SchedDlRlcBufferReqParameters>, std::_Select1st<std::pair<ns3::LteFlowId_t const, ns3::FfMacSchedSapProvider::SchedDlRlcBufferReqParameters> >, std::less<ns3::LteFlowId_t>, std::allocator<std::pair<ns3::LteFlowId_t const, ns3::FfMacSchedSapProvider::SchedDlRlcBufferReqParameters> > >::_M_lower_bound (856,900 samples, 0.09%)
ns3::HigherLayerSelected_s::~HigherLayerSelected_s (200,884 samples, 0.02%)
std::vector<unsigned short, std::allocator<unsigned short> >::~vector (460,931 samples, 0.05%)
ns3::LteEnbMac::DoSubframeIndication (178,609,510 samples, 18.42%) ns3::LteEnbMac::Do..
ns3::LteRadioBearerTag::~LteRadioBearerTag (271,006 samples, 0.03%)
ns3::LteEnbPhy::DoSendMacPdu (663,786 samples, 0.07%)
std::vector<double, std::allocator<double> >::~vector (127,422 samples, 0.01%)
ns3::EventId ns3::Simulator::Schedule<void (2,769,515 samples, 0.29%)
void std::allocator_traits<std::allocator<std::_List_node<ns3::Ptr<ns3::Packet> > > >::destroy<ns3::Ptr<ns3::Packet> > (827,732 samples, 0.09%)
ns3::Ptr<ns3::SpectrumModel const>::Ptr (155,450 samples, 0.02%)
std::vector<ns3::CqiListElement_s, std::allocator<ns3::CqiListElement_s> >::_M_erase_at_end (1,008,706 samples, 0.10%)
std::vector<ns3::HigherLayerSelected_s, std::allocator<ns3::HigherLayerSelected_s> >::~vector (264,265 samples, 0.03%)
std::_Rb_tree<unsigned short, std::pair<unsigned short const, unsigned char>, std::_Select1st<std::pair<unsigned short const, unsigned char> >, std::less<unsigned short>, std::allocator<std::pair<unsigned short const, unsigned char> > >::_M_lower_bound (577,659 samples, 0.06%)
void std::_Destroy<ns3::DlInfoListElement_s*> (886,663 samples, 0.09%)
ns3::TypeId::GetAttributeN (231,508 samples, 0.02%)
void std::_Bind<void (22,443,594 samples, 2.31%)
decltype (241,010 samples, 0.02%)
void std::allocator_traits<std::allocator<ns3::Buffer::Data*> >::construct<ns3::Buffer::Data*, ns3::Buffer::Data* const&> (315,007 samples, 0.03%)
std::_Rb_tree<unsigned short, std::pair<unsigned short const, std::vector<double, std::allocator<double> > >, std::_Select1st<std::pair<unsigned short const, std::vector<double, std::allocator<double> > > >, std::less<unsigned short>, std::allocator<std::pair<unsigned short const, std::vector<double, std::allocator<double> > > > >::~_Rb_tree (231,712 samples, 0.02%)
std::_Rb_tree<unsigned char, std::pair<unsigned char const, ns3::LteMacSapProvider*>, std::_Select1st<std::pair<unsigned char const, ns3::LteMacSapProvider*> >, std::less<unsigned char>, std::allocator<std::pair<unsigned char const, ns3::LteMacSapProvider*> > >::_M_lower_bound (280,068 samples, 0.03%)
[libc.so.6] (161,543 samples, 0.02%)
std::_Rb_tree_node<std::pair<unsigned char const, ns3::LteUeMac::LcInfo> >::_M_valptr (240,927 samples, 0.02%)
ns3::PfFfMacScheduler::DoSchedUlTriggerReq (34,427,946 samples, 3.55%) n..
std::_Rb_tree<unsigned short, std::pair<unsigned short const, std::vector<unsigned char, std::allocator<unsigned char> > >, std::_Select1st<std::pair<unsigned short const, std::vector<unsigned char, std::allocator<unsigned char> > > >, std::less<unsigned short>, std::allocator<std::pair<unsigned short const, std::vector<unsigned char, std::allocator<unsigned char> > > > >::find (1,004,495 samples, 0.10%)
std::map<unsigned short, std::vector<unsigned short, std::allocator<unsigned short> >, std::less<unsigned short>, std::allocator<std::pair<unsigned short const, std::vector<unsigned short, std::allocator<unsigned short> > > > >::~map (916,115 samples, 0.09%)
std::isnan (190,930 samples, 0.02%)
std::vector<int, std::allocator<int> >::operator= (904,852 samples, 0.09%)
void std::allocator_traits<std::allocator<std::_List_node<ns3::Ptr<ns3::LteControlMessage> > > >::construct<ns3::Ptr<ns3::LteControlMessage>, ns3::Ptr<ns3::LteControlMessage> const&> (240,418 samples, 0.02%)
ns3::MemberLteCcmMacSapUser<ns3::NoOpComponentCarrierManager>::UlReceiveMacCe (4,588,238 samples, 0.47%)
std::map<ns3::LteSpectrumModelId, ns3::Ptr<ns3::SpectrumModel>, std::less<ns3::LteSpectrumModelId>, std::allocator<std::pair<ns3::LteSpectrumModelId const, ns3::Ptr<ns3::SpectrumModel> > > >::find (1,471,073 samples, 0.15%)
std::_Rb_tree_iterator<std::pair<unsigned short const, ns3::DlInfoListElement_s> > std::map<unsigned short, ns3::DlInfoListElement_s, std::less<unsigned short>, std::allocator<std::pair<unsigned short const, ns3::DlInfoListElement_s> > >::emplace_hint<std::pair<unsigned short, ns3::DlInfoListElement_s> > (2,130,125 samples, 0.22%)
int* std::copy<__gnu_cxx::__normal_iterator<int const*, std::vector<int, std::allocator<int> > >, int*> (798,977 samples, 0.08%)
std::_Rb_tree<ns3::LteSpectrumModelId, std::pair<ns3::LteSpectrumModelId const, ns3::Ptr<ns3::SpectrumModel> >, std::_Select1st<std::pair<ns3::LteSpectrumModelId const, ns3::Ptr<ns3::SpectrumModel> > >, std::less<ns3::LteSpectrumModelId>, std::allocator<std::pair<ns3::LteSpectrumModelId const, ns3::Ptr<ns3::SpectrumModel> > > >::_M_mbegin (165,062 samples, 0.02%)
std::_List_node<ns3::Ptr<ns3::Packet> >* std::__cxx11::list<ns3::Ptr<ns3::Packet>, std::allocator<ns3::Ptr<ns3::Packet> > >::_M_create_node<ns3::Ptr<ns3::Packet> const&> (191,353 samples, 0.02%)
std::vector<ns3::HarqProcessInfoElement_t, std::allocator<ns3::HarqProcessInfoElement_t> >::vector (710,293 samples, 0.07%)
std::vector<ns3::DlInfoListElement_s::HarqStatus_e, std::allocator<ns3::DlInfoListElement_s::HarqStatus_e> >::vector (4,008,340 samples, 0.41%)
std::vector<ns3::CeBitmap_e, std::allocator<ns3::CeBitmap_e> >::vector (1,179,363 samples, 0.12%)
ns3::CalculateDistance (630,060 samples, 0.06%)
[libm.so.6] (270,399 samples, 0.03%)
__gnu_cxx::__aligned_membuf<std::pair<unsigned short const, ns3::pfsFlowPerf_t> >::_M_ptr (317,676 samples, 0.03%)
std::_Function_handler<void (4,103,031 samples, 0.42%)
decltype (426,539 samples, 0.04%)
ns3::Ptr<ns3::SpectrumValue>::Ptr (205,997 samples, 0.02%)
double* std::__uninitialized_default_n_a<double*, unsigned long, double> (363,863 samples, 0.04%)
std::_Rb_tree<unsigned short, std::pair<unsigned short const, std::map<unsigned char, ns3::LteMacSapUser*, std::less<unsigned char>, std::allocator<std::pair<unsigned char const, ns3::LteMacSapUser*> > > >, std::_Select1st<std::pair<unsigned short const, std::map<unsigned char, ns3::LteMacSapUser*, std::less<unsigned char>, std::allocator<std::pair<unsigned char const, ns3::LteMacSapUser*> > > > >, std::less<unsigned short>, std::allocator<std::pair<unsigned short const, std::map<unsigned char, ns3::LteMacSapUser*, std::less<unsigned char>, std::allocator<std::pair<unsigned char const, ns3::LteMacSapUser*> > > > > >::_M_mbegin (279,426 samples, 0.03%)
std::_Vector_base<double, std::allocator<double> >::_M_deallocate (163,066 samples, 0.02%)
decltype (523,193 samples, 0.05%)
std::tuple_element<0ul, std::pair<unsigned int const&, ns3::Ptr<ns3::SpectrumValue>&> >::type&& std::get<0ul, unsigned int const&, ns3::Ptr<ns3::SpectrumValue>&> (187,049 samples, 0.02%)
ns3::ByteTagList::Add (192,525 samples, 0.02%)
malloc (195,119 samples, 0.02%)
__gnu_cxx::__normal_iterator<double*, std::vector<double, std::allocator<double> > >::__normal_iterator (221,184 samples, 0.02%)
std::_Vector_base<ns3::PhichListElement_s, std::allocator<ns3::PhichListElement_s> >::_M_create_storage (228,237 samples, 0.02%)
ns3::RlcTag::RlcTag (497,992 samples, 0.05%)
ns3::Ptr<ns3::SpectrumModel const>::Ptr (510,728 samples, 0.05%)
ns3::PfFfMacScheduler::UpdateUlRlcBufferInfo (315,273 samples, 0.03%)
void std::allocator_traits<std::allocator<std::_Rb_tree_node<std::pair<unsigned int const, ns3::Ptr<ns3::SpectrumValue> > > > >::construct<std::pair<unsigned int const, ns3::Ptr<ns3::SpectrumValue> >, unsigned int const&, ns3::Ptr<ns3::SpectrumValue>&> (466,275 samples, 0.05%)
ns3::SimpleRefCount<ns3::Object, ns3::ObjectBase, ns3::ObjectDeleter>::GetReferenceCount (169,090 samples, 0.02%)
std::_Tuple_impl<0ul, ns3::LteInterference*, ns3::Ptr<ns3::SpectrumValue const>, unsigned int>::_Tuple_impl (927,227 samples, 0.10%)
std::__cxx11::_List_base<ns3::Ptr<ns3::LteControlMessage>, std::allocator<ns3::Ptr<ns3::LteControlMessage> > >::_List_base (611,762 samples, 0.06%)
ns3::SpectrumValue::Divide (328,607 samples, 0.03%)
std::less<unsigned int>::operator (139,969 samples, 0.01%)
ns3::Angles::Angles (1,300,079 samples, 0.13%)
std::__cxx11::_List_base<ns3::UlDciLteControlMessage, std::allocator<ns3::UlDciLteControlMessage> >::_List_impl::_List_impl (264,942 samples, 0.03%)
ns3::SpectrumSignalParameters::~SpectrumSignalParameters (209,441 samples, 0.02%)
std::__cxx11::_List_base<ns3::Ptr<ns3::Packet>, std::allocator<ns3::Ptr<ns3::Packet> > >::~_List_base (199,131 samples, 0.02%)
std::__cxx11::_List_base<ns3::Ptr<ns3::LteControlMessage>, std::allocator<ns3::Ptr<ns3::LteControlMessage> > >::_M_clear (277,280 samples, 0.03%)
std::_Rb_tree_node<std::pair<ns3::Scheduler::EventKey const, ns3::EventImpl*> >* std::_Rb_tree<ns3::Scheduler::EventKey, std::pair<ns3::Scheduler::EventKey const, ns3::EventImpl*>, std::_Select1st<std::pair<ns3::Scheduler::EventKey const, ns3::EventImpl*> >, std::less<ns3::Scheduler::EventKey>, std::allocator<std::pair<ns3::Scheduler::EventKey const, ns3::EventImpl*> > >::_M_create_node<std::pair<ns3::Scheduler::EventKey, ns3::EventImpl*> > (403,625 samples, 0.04%)
std::vector<std::__cxx11::list<ns3::Ptr<ns3::LteControlMessage>, std::allocator<ns3::Ptr<ns3::LteControlMessage> > >, std::allocator<std::__cxx11::list<ns3::Ptr<ns3::LteControlMessage>, std::allocator<ns3::Ptr<ns3::LteControlMessage> > > > >::_M_range_check (157,947 samples, 0.02%)
std::vector<std::vector<ns3::Ptr<ns3::PacketBurst>, std::allocator<ns3::Ptr<ns3::PacketBurst> > >, std::allocator<std::vector<ns3::Ptr<ns3::PacketBurst>, std::allocator<ns3::Ptr<ns3::PacketBurst> > > > >::_M_range_check (125,858 samples, 0.01%)
std::_Rb_tree<unsigned short, std::pair<unsigned short const, ns3::SbMeasResult_s>, std::_Select1st<std::pair<unsigned short const, ns3::SbMeasResult_s> >, std::less<unsigned short>, std::allocator<std::pair<unsigned short const, ns3::SbMeasResult_s> > >::_M_begin (155,977 samples, 0.02%)
std::_Rb_tree<unsigned int, std::pair<unsigned int const, ns3::Ptr<ns3::SpectrumValue> >, std::_Select1st<std::pair<unsigned int const, ns3::Ptr<ns3::SpectrumValue> > >, std::less<unsigned int>, std::allocator<std::pair<unsigned int const, ns3::Ptr<ns3::SpectrumValue> > > >::_S_key (198,414 samples, 0.02%)
ns3::Packet::Packet (229,600 samples, 0.02%)
ns3::Ptr<ns3::SpectrumValue const>::Ptr (156,961 samples, 0.02%)
ns3::CqiListElement_s* std::__do_uninit_copy<__gnu_cxx::__normal_iterator<ns3::CqiListElement_s*, std::vector<ns3::CqiListElement_s, std::allocator<ns3::CqiListElement_s> > >, ns3::CqiListElement_s*> (3,635,299 samples, 0.37%)
double* std::__copy_move_a2<false, double const*, double*> (193,414 samples, 0.02%)
ns3::Ptr<ns3::PacketBurst>::operator= (707,699 samples, 0.07%)
ns3::DefaultDeleter<ns3::LteControlMessage>::Delete (269,841 samples, 0.03%)
std::pair<std::_Rb_tree_iterator<std::pair<ns3::Scheduler::EventKey const, ns3::EventImpl*> >, bool>::pair (270,035 samples, 0.03%)
ns3::HarqProcessInfoElement_t* std::copy<__gnu_cxx::__normal_iterator<ns3::HarqProcessInfoElement_t const*, std::vector<ns3::HarqProcessInfoElement_t, std::allocator<ns3::HarqProcessInfoElement_t> > >, ns3::HarqProcessInfoElement_t*> (1,442,310 samples, 0.15%)
std::vector<ns3::Ptr<ns3::PacketBurst>, std::allocator<ns3::Ptr<ns3::PacketBurst> > >::_M_erase (576,036 samples, 0.06%)
std::_Tuple_impl<5ul, std::map<unsigned int, ns3::Ptr<ns3::SpectrumValue>, std::less<unsigned int>, std::allocator<std::pair<unsigned int const, ns3::Ptr<ns3::SpectrumValue> > > > >::_M_head (542,473 samples, 0.06%)
ns3::Ptr<ns3::DlDciLteControlMessage> ns3::Create<ns3::DlDciLteControlMessage> (1,498,907 samples, 0.15%)
std::_Vector_base<double, std::allocator<double> >::~_Vector_base (195,505 samples, 0.02%)
decltype (460,852 samples, 0.05%)
ns3::FfMacSchedSapProvider::SchedDlRlcBufferReqParameters::~SchedDlRlcBufferReqParameters (747,290 samples, 0.08%)
std::_Rb_tree<ns3::Scheduler::EventKey, std::pair<ns3::Scheduler::EventKey const, ns3::EventImpl*>, std::_Select1st<std::pair<ns3::Scheduler::EventKey const, ns3::EventImpl*> >, std::less<ns3::Scheduler::EventKey>, std::allocator<std::pair<ns3::Scheduler::EventKey const, ns3::EventImpl*> > >::_M_lower_bound (446,361 samples, 0.05%)
ns3::DefaultSimulatorImpl::Run (5,321,712 samples, 0.55%)
std::map<unsigned short, ns3::SbMeasResult_s, std::less<unsigned short>, std::allocator<std::pair<unsigned short const, ns3::SbMeasResult_s> > >::find (231,252 samples, 0.02%)
ns3::ByteTagList::Iterator::HasNext (195,833 samples, 0.02%)
ns3::EventImpl* ns3::PeekPointer<ns3::EventImpl> (342,386 samples, 0.04%)
std::map<unsigned int, ns3::Ptr<ns3::SpectrumValue>, std::less<unsigned int>, std::allocator<std::pair<unsigned int const, ns3::Ptr<ns3::SpectrumValue> > > >::map (196,880 samples, 0.02%)
std::_Rb_tree<unsigned char, std::pair<unsigned char const, ns3::LteMacSapProvider*>, std::_Select1st<std::pair<unsigned char const, ns3::LteMacSapProvider*> >, std::less<unsigned char>, std::allocator<std::pair<unsigned char const, ns3::LteMacSapProvider*> > >::_S_key (490,279 samples, 0.05%)
ns3::UlCqi_s::UlCqi_s (409,983 samples, 0.04%)
std::_Rb_tree<unsigned int, std::pair<unsigned int const, ns3::TxSpectrumModelInfo>, std::_Select1st<std::pair<unsigned int const, ns3::TxSpectrumModelInfo> >, std::less<unsigned int>, std::allocator<std::pair<unsigned int const, ns3::TxSpectrumModelInfo> > >::_M_end (160,556 samples, 0.02%)
std::_Rb_tree<unsigned int, std::pair<unsigned int const, ns3::TxSpectrumModelInfo>, std::_Select1st<std::pair<unsigned int const, ns3::TxSpectrumModelInfo> >, std::less<unsigned int>, std::allocator<std::pair<unsigned int const, ns3::TxSpectrumModelInfo> > >::_M_begin (529,260 samples, 0.05%)
ns3::Ptr<ns3::PacketBurst>::Acquire (155,703 samples, 0.02%)
ns3::RlcPduListElement_s* std::uninitialized_copy<__gnu_cxx::__normal_iterator<ns3::RlcPduListElement_s const*, std::vector<ns3::RlcPduListElement_s, std::allocator<ns3::RlcPduListElement_s> > >, ns3::RlcPduListElement_s*> (214,687 samples, 0.02%)
std::allocator_traits<std::allocator<std::_Rb_tree_node<std::pair<ns3::Scheduler::EventKey const, ns3::EventImpl*> > > >::allocate (270,834 samples, 0.03%)
ns3::HarqProcessInfoElement_t* std::__copy_move<false, true, std::random_access_iterator_tag>::__copy_m<ns3::HarqProcessInfoElement_t const, ns3::HarqProcessInfoElement_t> (219,081 samples, 0.02%)
std::_Rb_tree<unsigned char, std::pair<unsigned char const, ns3::LteMacSapProvider*>, std::_Select1st<std::pair<unsigned char const, ns3::LteMacSapProvider*> >, std::less<unsigned char>, std::allocator<std::pair<unsigned char const, ns3::LteMacSapProvider*> > >::_S_key (234,707 samples, 0.02%)
__gnu_cxx::__aligned_membuf<std::pair<unsigned int const, ns3::RxSpectrumModelInfo> >::_M_ptr (218,859 samples, 0.02%)
std::__cxx11::_List_base<ns3::Ptr<ns3::LteControlMessage>, std::allocator<ns3::Ptr<ns3::LteControlMessage> > >::_M_get_Node_allocator (129,372 samples, 0.01%)
ns3::DefaultSimulatorImpl::ProcessOneEvent (2,105,662 samples, 0.22%)
std::__detail::_List_node_header::_List_node_header (266,882 samples, 0.03%)
std::_Rb_tree_node<unsigned short>::_M_valptr (317,657 samples, 0.03%)
std::__new_allocator<unsigned long>::allocate (271,783 samples, 0.03%)
ns3::MakeEvent<void (2,347,913 samples, 0.24%)
ns3::TagBuffer::Write (152,668 samples, 0.02%)
ns3::Ptr<ns3::PacketBurst> ns3::CompleteConstruct<ns3::PacketBurst> (4,272,760 samples, 0.44%)
unsigned char* std::uninitialized_copy<__gnu_cxx::__normal_iterator<unsigned char const*, std::vector<unsigned char, std::allocator<unsigned char> > >, unsigned char*> (500,842 samples, 0.05%)
void std::_Destroy_aux<true>::__destroy<int*> (161,562 samples, 0.02%)
std::vector<bool, std::allocator<bool> >::size (396,527 samples, 0.04%)
ns3::UlCqi_s::UlCqi_s (234,034 samples, 0.02%)
ns3::DlInfoListElement_s::DlInfoListElement_s (285,025 samples, 0.03%)
void std::__fill_a<unsigned short*, unsigned short> (375,815 samples, 0.04%)
ns3::Ptr<ns3::Packet>::Ptr (235,499 samples, 0.02%)
std::_Bind<void (411,266 samples, 0.04%)
std::_Rb_tree<unsigned short, std::pair<unsigned short const, double>, std::_Select1st<std::pair<unsigned short const, double> >, std::less<unsigned short>, std::allocator<std::pair<unsigned short const, double> > >::_M_lower_bound (1,329,957 samples, 0.14%)
ns3::HarqProcessInfoElement_t* std::__uninitialized_copy<true>::__uninit_copy<__gnu_cxx::__normal_iterator<ns3::HarqProcessInfoElement_t const*, std::vector<ns3::HarqProcessInfoElement_t, std::allocator<ns3::HarqProcessInfoElement_t> > >, ns3::HarqProcessInfoElement_t*> (489,523 samples, 0.05%)
ns3::Packet::RemovePacketTag (390,797 samples, 0.04%)
ns3::operator/ (819,512 samples, 0.08%)
std::__cxx11::_List_base<ns3::UlDciLteControlMessage, std::allocator<ns3::UlDciLteControlMessage> >::_M_clear (151,843 samples, 0.02%)
ns3::PacketBurst::DoDispose (1,317,063 samples, 0.14%)
ns3::Ptr<ns3::EventImpl>::~Ptr (234,471 samples, 0.02%)
std::vector<unsigned short, std::allocator<unsigned short> >::_M_check_len (230,064 samples, 0.02%)
std::_Vector_base<unsigned short, std::allocator<unsigned short> >::_M_get_Tp_allocator (246,077 samples, 0.03%)
[libc.so.6] (278,891 samples, 0.03%)
ns3::HarqProcessInfoElement_t* std::__uninitialized_copy_a<__gnu_cxx::__normal_iterator<ns3::HarqProcessInfoElement_t const*, std::vector<ns3::HarqProcessInfoElement_t, std::allocator<ns3::HarqProcessInfoElement_t> > >, ns3::HarqProcessInfoElement_t*, ns3::HarqProcessInfoElement_t> (185,369 samples, 0.02%)
std::vector<bool, std::allocator<bool> >::_M_range_check (163,820 samples, 0.02%)
std::vector<double, std::allocator<double> >::_S_check_init_len (173,024 samples, 0.02%)
ns3::Ptr<ns3::Packet>::~Ptr (1,114,557 samples, 0.11%)
cfree (311,874 samples, 0.03%)
__gnu_cxx::__aligned_membuf<std::pair<ns3::TbId_t const, ns3::tbInfo_t> >::_M_ptr (164,853 samples, 0.02%)
ns3::PfFfMacScheduler::DoSchedDlTriggerReq (9,997,060 samples, 1.03%)
ns3::Simulator::GetSystemId (350,974 samples, 0.04%)
std::vector<unsigned short, std::allocator<unsigned short> >::at (220,871 samples, 0.02%)
void std::_Destroy<ns3::DlInfoListElement_s> (734,784 samples, 0.08%)
std::__cxx11::list<ns3::Ptr<ns3::LteControlMessage>, std::allocator<ns3::Ptr<ns3::LteControlMessage> > >::~list (200,616 samples, 0.02%)
std::_Rb_tree<int, std::pair<int const, double>, std::_Select1st<std::pair<int const, double> >, std::less<int>, std::allocator<std::pair<int const, double> > >::_M_erase (474,320 samples, 0.05%)
decltype (292,988 samples, 0.03%)
std::vector<ns3::HarqProcessInfoElement_t, std::allocator<ns3::HarqProcessInfoElement_t> >* std::__copy_move_a2<true, std::vector<ns3::HarqProcessInfoElement_t, std::allocator<ns3::HarqProcessInfoElement_t> >*, std::vector<ns3::HarqProcessInfoElement_t, std::allocator<ns3::HarqProcessInfoElement_t> >*> (148,381 samples, 0.02%)
std::_Tuple_impl<0ul, ns3::LteEnbPhy*, ns3::Ptr<ns3::PacketBurst> >::_Tuple_impl<ns3::LteEnbPhy*&, ns3::Ptr<ns3::PacketBurst>&, void> (814,172 samples, 0.08%)
std::pair<std::__strip_reference_wrapper<std::decay<ns3::Scheduler::EventKey const&>::type>::__type, std::__strip_reference_wrapper<std::decay<ns3::EventImpl* const&>::type>::__type> std::make_pair<ns3::Scheduler::EventKey const&, ns3::EventImpl* const&> (240,322 samples, 0.02%)
std::__cxx11::list<ns3::Ptr<ns3::LteControlMessage>, std::allocator<ns3::Ptr<ns3::LteControlMessage> > >::push_back (696,056 samples, 0.07%)
ns3::LteUePhy::SetSubChannelsForReception (725,734 samples, 0.07%)
std::vector<double, std::allocator<double> >::_M_default_initialize (267,489 samples, 0.03%)
std::vector<int, std::allocator<int> >::push_back (1,055,032 samples, 0.11%)
std::_Rb_tree<ns3::TbId_t, std::pair<ns3::TbId_t const, ns3::tbInfo_t>, std::_Select1st<std::pair<ns3::TbId_t const, ns3::tbInfo_t> >, std::less<ns3::TbId_t>, std::allocator<std::pair<ns3::TbId_t const, ns3::tbInfo_t> > >::_S_right (157,484 samples, 0.02%)
ns3::Simulator::Now (240,092 samples, 0.02%)
ns3::HarqProcessInfoElement_t* std::__uninitialized_copy<true>::__uninit_copy<__gnu_cxx::__normal_iterator<ns3::HarqProcessInfoElement_t const*, std::vector<ns3::HarqProcessInfoElement_t, std::allocator<ns3::HarqProcessInfoElement_t> > >, ns3::HarqProcessInfoElement_t*> (1,522,938 samples, 0.16%)
std::_Rb_tree_node<std::pair<unsigned int const, ns3::Ptr<ns3::SpectrumValue> > >* std::_Rb_tree<unsigned int, std::pair<unsigned int const, ns3::Ptr<ns3::SpectrumValue> >, std::_Select1st<std::pair<unsigned int const, ns3::Ptr<ns3::SpectrumValue> > >, std::less<unsigned int>, std::allocator<std::pair<unsigned int const, ns3::Ptr<ns3::SpectrumValue> > > >::_M_copy<false, std::_Rb_tree<unsigned int, std::pair<unsigned int const, ns3::Ptr<ns3::SpectrumValue> >, std::_Select1st<std::pair<unsigned int const, ns3::Ptr<ns3::SpectrumValue> > >, std::less<unsigned int>, std::allocator<std::pair<unsigned int const, ns3::Ptr<ns3::SpectrumValue> > > >::_Alloc_node> (458,139 samples, 0.05%)
std::_List_node<ns3::UlDciLteControlMessage>::_M_valptr (437,168 samples, 0.05%)
ns3::Simulator::ScheduleWithContext (475,136 samples, 0.05%)
std::map<unsigned int, ns3::RxSpectrumModelInfo, std::less<unsigned int>, std::allocator<std::pair<unsigned int const, ns3::RxSpectrumModelInfo> > >::begin (243,486 samples, 0.03%)
ns3::NoOpComponentCarrierManager::DoNotifyTxOpportunity (2,715,978 samples, 0.28%)
ns3::LteRlcSm::DoNotifyTxOpportunity (192,143 samples, 0.02%)
ns3::Object::SetTypeId (397,305 samples, 0.04%)
ns3::HigherLayerSelected_s* std::__relocate_a_1<ns3::HigherLayerSelected_s*, ns3::HigherLayerSelected_s*, std::allocator<ns3::HigherLayerSelected_s> > (1,090,256 samples, 0.11%)
ns3::SpectrumValue::SpectrumValue (3,551,632 samples, 0.37%)
std::_Rb_tree<unsigned short, std::pair<unsigned short const, std::vector<ns3::UlDciListElement_s, std::allocator<ns3::UlDciListElement_s> > >, std::_Select1st<std::pair<unsigned short const, std::vector<ns3::UlDciListElement_s, std::allocator<ns3::UlDciListElement_s> > > >, std::less<unsigned short>, std::allocator<std::pair<unsigned short const, std::vector<ns3::UlDciListElement_s, std::allocator<ns3::UlDciListElement_s> > > > >::_M_begin (429,634 samples, 0.04%)
std::vector<ns3::VendorSpecificListElement_s, std::allocator<ns3::VendorSpecificListElement_s> >::size (195,796 samples, 0.02%)
unsigned short& std::vector<unsigned short, std::allocator<unsigned short> >::emplace_back<unsigned short> (3,153,700 samples, 0.33%)
std::_Function_base::~_Function_base (194,457 samples, 0.02%)
ns3::EnbMemberLteEnbPhySapProvider::SendLteControlMessage (851,386 samples, 0.09%)
ns3::Ptr<ns3::LteSpectrumSignalParametersDlCtrlFrame> ns3::Create<ns3::LteSpectrumSignalParametersDlCtrlFrame, ns3::LteSpectrumSignalParametersDlCtrlFrame const&> (729,950 samples, 0.08%)
ns3::LteRadioBearerTag::~LteRadioBearerTag (181,554 samples, 0.02%)
ns3::DlDciListElement_s::DlDciListElement_s (964,763 samples, 0.10%)
std::vector<signed char, std::allocator<signed char> >::push_back (934,973 samples, 0.10%)
std::_Rb_tree<unsigned char, std::pair<unsigned char const, ns3::LteMacSapProvider*>, std::_Select1st<std::pair<unsigned char const, ns3::LteMacSapProvider*> >, std::less<unsigned char>, std::allocator<std::pair<unsigned char const, ns3::LteMacSapProvider*> > >::find (270,008 samples, 0.03%)
modff64x (194,496 samples, 0.02%)
pthread_self (192,757 samples, 0.02%)
std::map<ns3::Scheduler::EventKey, ns3::EventImpl*, std::less<ns3::Scheduler::EventKey>, std::allocator<std::pair<ns3::Scheduler::EventKey const, ns3::EventImpl*> > >::lower_bound (152,705 samples, 0.02%)
ns3::LteSpectrumSignalParametersDataFrame::LteSpectrumSignalParametersDataFrame (1,650,971 samples, 0.17%)
ns3::Object::~Object (853,448 samples, 0.09%)
ns3::NoOpComponentCarrierManager::DoTransmitPdu (549,181 samples, 0.06%)
std::_Rb_tree<unsigned short, std::pair<unsigned short const, std::vector<unsigned short, std::allocator<unsigned short> > >, std::_Select1st<std::pair<unsigned short const, std::vector<unsigned short, std::allocator<unsigned short> > > >, std::less<unsigned short>, std::allocator<std::pair<unsigned short const, std::vector<unsigned short, std::allocator<unsigned short> > > > >::_Rb_tree_impl<std::less<unsigned short>, true>::_Rb_tree_impl (893,299 samples, 0.09%)
ns3::LteEnbMac::DoDlInfoListElementHarqFeedback (13,820,039 samples, 1.43%)
int* std::__uninitialized_copy<true>::__uninit_copy<__gnu_cxx::__normal_iterator<int const*, std::vector<int, std::allocator<int> > >, int*> (268,424 samples, 0.03%)
ns3::Ptr<ns3::MobilityModel>::Acquire (151,917 samples, 0.02%)
std::vector<double, std::allocator<double> >::vector (2,848,710 samples, 0.29%)
unsigned long* std::__copy_move_a1<false, unsigned long*, unsigned long*> (267,936 samples, 0.03%)
std::_Head_base<0ul, ns3::LteEnbPhy*, false>::_M_head (157,244 samples, 0.02%)
std::_Rb_tree_node<std::pair<unsigned short const, std::vector<double, std::allocator<double> > > >* std::_Rb_tree<unsigned short, std::pair<unsigned short const, std::vector<double, std::allocator<double> > >, std::_Select1st<std::pair<unsigned short const, std::vector<double, std::allocator<double> > > >, std::less<unsigned short>, std::allocator<std::pair<unsigned short const, std::vector<double, std::allocator<double> > > > >::_M_clone_node<false, std::_Rb_tree<unsigned short, std::pair<unsigned short const, std::vector<double, std::allocator<double> > >, std::_Select1st<std::pair<unsigned short const, std::vector<double, std::allocator<double> > > >, std::less<unsigned short>, std::allocator<std::pair<unsigned short const, std::vector<double, std::allocator<double> > > > >::_Alloc_node> (282,988 samples, 0.03%)
ns3::CqiListElement_s::CqiListElement_s (874,922 samples, 0.09%)
ns3::Ptr<ns3::SpectrumSignalParameters>::Ptr (148,039 samples, 0.02%)
std::_Rb_tree_node<std::pair<unsigned int const, ns3::Ptr<ns3::SpectrumValue> > >* std::_Rb_tree<unsigned int, std::pair<unsigned int const, ns3::Ptr<ns3::SpectrumValue> >, std::_Select1st<std::pair<unsigned int const, ns3::Ptr<ns3::SpectrumValue> > >, std::less<unsigned int>, std::allocator<std::pair<unsigned int const, ns3::Ptr<ns3::SpectrumValue> > > >::_M_copy<false, std::_Rb_tree<unsigned int, std::pair<unsigned int const, ns3::Ptr<ns3::SpectrumValue> >, std::_Select1st<std::pair<unsigned int const, ns3::Ptr<ns3::SpectrumValue> > >, std::less<unsigned int>, std::allocator<std::pair<unsigned int const, ns3::Ptr<ns3::SpectrumValue> > > >::_Alloc_node> (155,456 samples, 0.02%)
std::__cxx11::_List_base<ns3::Ptr<ns3::LteControlMessage>, std::allocator<ns3::Ptr<ns3::LteControlMessage> > >::_M_clear (429,433 samples, 0.04%)
ns3::SimpleRefCount<ns3::EventImpl, ns3::Empty, ns3::DefaultDeleter<ns3::EventImpl> >::Unref (572,810 samples, 0.06%)
std::_Rb_tree_node<std::pair<unsigned short const, std::vector<unsigned short, std::allocator<unsigned short> > > >::_M_valptr (148,167 samples, 0.02%)
ns3::SimpleRefCount<ns3::LteControlMessage, ns3::Empty, ns3::DefaultDeleter<ns3::LteControlMessage> >::Unref (611,218 samples, 0.06%)
std::map<unsigned char, ns3::LteMacSapUser*, std::less<unsigned char>, std::allocator<std::pair<unsigned char const, ns3::LteMacSapUser*> > >::find (1,045,530 samples, 0.11%)
std::vector<ns3::MacCeListElement_s, std::allocator<ns3::MacCeListElement_s> >::begin (193,759 samples, 0.02%)
ns3::MacCeListElement_s* std::__uninitialized_copy_a<__gnu_cxx::__normal_iterator<ns3::MacCeListElement_s*, std::vector<ns3::MacCeListElement_s, std::allocator<ns3::MacCeListElement_s> > >, ns3::MacCeListElement_s*, ns3::MacCeListElement_s> (996,997 samples, 0.10%)
std::_Rb_tree<unsigned short, std::pair<unsigned short const, std::vector<double, std::allocator<double> > >, std::_Select1st<std::pair<unsigned short const, std::vector<double, std::allocator<double> > > >, std::less<unsigned short>, std::allocator<std::pair<unsigned short const, std::vector<double, std::allocator<double> > > > >::find (1,211,425 samples, 0.12%)
ns3::Ptr<ns3::SpectrumValue>& std::__pair_get<1ul>::__move_get<unsigned int const&, ns3::Ptr<ns3::SpectrumValue>&> (152,590 samples, 0.02%)
std::vector<bool, std::allocator<bool> >::~vector (827,864 samples, 0.09%)
ns3::Ptr<ns3::LteControlMessage>& std::__cxx11::list<ns3::Ptr<ns3::LteControlMessage>, std::allocator<ns3::Ptr<ns3::LteControlMessage> > >::emplace_back<ns3::Ptr<ns3::Sib1LteControlMessage>&> (149,493 samples, 0.02%)
std::_Vector_base<double, std::allocator<double> >::_M_allocate (707,146 samples, 0.07%)
ns3::MemberSchedSapProvider<ns3::PfFfMacScheduler>::SchedUlCqiInfoReq (821,265 samples, 0.08%)
std::__new_allocator<std::_Rb_tree_node<std::pair<unsigned short const, std::vector<double, std::allocator<double> > > > >::allocate (393,182 samples, 0.04%)
ns3::MemberSchedSapProvider<ns3::PfFfMacScheduler>::SchedUlTriggerReq (3,881,896 samples, 0.40%)
std::allocator_traits<std::allocator<std::_Rb_tree_node<std::pair<ns3::Scheduler::EventKey const, ns3::EventImpl*> > > >::deallocate (887,233 samples, 0.09%)
ns3::SpectrumValue::operator= (345,577 samples, 0.04%)
void std::_Destroy<ns3::HigherLayerSelected_s*, ns3::HigherLayerSelected_s> (151,525 samples, 0.02%)
void std::allocator_traits<std::allocator<std::vector<ns3::RlcPduListElement_s, std::allocator<ns3::RlcPduListElement_s> > > >::construct<std::vector<ns3::RlcPduListElement_s, std::allocator<ns3::RlcPduListElement_s> >, std::vector<ns3::RlcPduListElement_s, std::allocator<ns3::RlcPduListElement_s> > const&> (1,840,875 samples, 0.19%)
void std::allocator_traits<std::allocator<ns3::HigherLayerSelected_s> >::construct<ns3::HigherLayerSelected_s, ns3::HigherLayerSelected_s const&> (366,550 samples, 0.04%)
ns3::MakeEvent<void (2,859,606 samples, 0.29%)
__gnu_cxx::__normal_iterator<std::__cxx11::list<ns3::Ptr<ns3::LteControlMessage>, std::allocator<ns3::Ptr<ns3::LteControlMessage> > >*, std::vector<std::__cxx11::list<ns3::Ptr<ns3::LteControlMessage>, std::allocator<ns3::Ptr<ns3::LteControlMessage> > >, std::allocator<std::__cxx11::list<ns3::Ptr<ns3::LteControlMessage>, std::allocator<ns3::Ptr<ns3::LteControlMessage> > > > > > std::move<__gnu_cxx::__normal_iterator<std::__cxx11::list<ns3::Ptr<ns3::LteControlMessage>, std::allocator<ns3::Ptr<ns3::LteControlMessage> > >*, std::vector<std::__cxx11::list<ns3::Ptr<ns3::LteControlMessage>, std::allocator<ns3::Ptr<ns3::LteControlMessage> > >, std::allocator<std::__cxx11::list<ns3::Ptr<ns3::LteControlMessage>, std::allocator<ns3::Ptr<ns3::LteControlMessage> > > > > >, __gnu_cxx::__normal_iterator<std::__cxx11::list<ns3::Ptr<ns3::LteControlMessage>, std::allocator<ns3::Ptr<ns3::LteControlMessage> > >*, std::vector<std::__cxx11::list<ns3::Ptr<ns3::LteControlMessage>, std::allocator<ns3::Ptr<ns3::LteControlMessage> > >, std::allocator<std::__cxx11::list<ns3::Ptr<ns3::LteControlMessage>, std::allocator<ns3::Ptr<ns3::LteControlMessage> > > > > > > (1,552,993 samples, 0.16%)
ns3::Time::GetNanoSeconds (204,211 samples, 0.02%)
ns3::VendorSpecificListElement_s* std::__uninitialized_copy<false>::__uninit_copy<__gnu_cxx::__normal_iterator<ns3::VendorSpecificListElement_s const*, std::vector<ns3::VendorSpecificListElement_s, std::allocator<ns3::VendorSpecificListElement_s> > >, ns3::VendorSpecificListElement_s*> (386,345 samples, 0.04%)
std::vector<ns3::ByteTagListData*, std::allocator<ns3::ByteTagListData*> >::begin (200,950 samples, 0.02%)
std::vector<ns3::VendorSpecificListElement_s, std::allocator<ns3::VendorSpecificListElement_s> >::vector (183,894 samples, 0.02%)
ns3::LteEnbPhy::ReportInterference (992,797 samples, 0.10%)
std::_Rb_tree<unsigned short, std::pair<unsigned short const, std::vector<ns3::DlDciListElement_s, std::allocator<ns3::DlDciListElement_s> > >, std::_Select1st<std::pair<unsigned short const, std::vector<ns3::DlDciListElement_s, std::allocator<ns3::DlDciListElement_s> > > >, std::less<unsigned short>, std::allocator<std::pair<unsigned short const, std::vector<ns3::DlDciListElement_s, std::allocator<ns3::DlDciListElement_s> > > > >::find (966,324 samples, 0.10%)
std::allocator<double>::allocate (150,187 samples, 0.02%)
ns3::Angles::NormalizeAngles (468,955 samples, 0.05%)
ns3::LteUePhy::SendSrs (1,152,023 samples, 0.12%)
std::_Rb_tree<unsigned short, std::pair<unsigned short const, std::vector<double, std::allocator<double> > >, std::_Select1st<std::pair<unsigned short const, std::vector<double, std::allocator<double> > > >, std::less<unsigned short>, std::allocator<std::pair<unsigned short const, std::vector<double, std::allocator<double> > > > >::find (186,790 samples, 0.02%)
std::vector<bool, std::allocator<bool> >::capacity (268,073 samples, 0.03%)
__gnu_cxx::__normal_iterator<int*, std::vector<int, std::allocator<int> > > std::copy<__gnu_cxx::__normal_iterator<int const*, std::vector<int, std::allocator<int> > >, __gnu_cxx::__normal_iterator<int*, std::vector<int, std::allocator<int> > > > (330,607 samples, 0.03%)
void std::__cxx11::list<ns3::Ptr<ns3::PacketBurst>, std::allocator<ns3::Ptr<ns3::PacketBurst> > >::_M_insert<ns3::Ptr<ns3::PacketBurst> const&> (2,723,348 samples, 0.28%)
ns3::CallbackImplBase* ns3::PeekPointer<ns3::CallbackImplBase> (161,766 samples, 0.02%)
ns3::Time::ToInteger (200,806 samples, 0.02%)
std::allocator<double>::allocate (168,940 samples, 0.02%)
std::__cxx11::_List_base<ns3::Ptr<ns3::LteControlMessage>, std::allocator<ns3::Ptr<ns3::LteControlMessage> > >::_List_base (354,467 samples, 0.04%)
std::vector<ns3::VendorSpecificListElement_s, std::allocator<ns3::VendorSpecificListElement_s> >::vector (1,942,143 samples, 0.20%)
std::tuple<ns3::LteSpectrumPhy*>::tuple<ns3::LteSpectrumPhy*&, true, true> (328,207 samples, 0.03%)
int* std::copy<int*, int*> (218,802 samples, 0.02%)
std::_Tuple_impl<2ul, double, ns3::Ptr<ns3::SpectrumSignalParameters>, ns3::Ptr<ns3::SpectrumPhy>, std::map<unsigned int, ns3::Ptr<ns3::SpectrumValue>, std::less<unsigned int>, std::allocator<std::pair<unsigned int const, ns3::Ptr<ns3::SpectrumValue> > > > >::~_Tuple_impl (297,048 samples, 0.03%)
std::_Vector_base<ns3::RlcPduListElement_s, std::allocator<ns3::RlcPduListElement_s> >::_M_create_storage (392,586 samples, 0.04%)
ns3::DlDciListElement_s::DlDciListElement_s (1,019,581 samples, 0.11%)
std::pair<ns3::Scheduler::EventKey const, ns3::EventImpl*>::pair<ns3::Scheduler::EventKey, ns3::EventImpl*> (351,126 samples, 0.04%)
std::vector<std::__cxx11::list<ns3::UlDciLteControlMessage, std::allocator<ns3::UlDciLteControlMessage> >, std::allocator<std::__cxx11::list<ns3::UlDciLteControlMessage, std::allocator<ns3::UlDciLteControlMessage> > > >::at (603,079 samples, 0.06%)
ns3::EventId::EventId (1,141,333 samples, 0.12%)
ns3::NoOpComponentCarrierManager::DoNotifyTxOpportunity (538,351 samples, 0.06%)
ns3::SpectrumSignalParameters::SpectrumSignalParameters (2,427,360 samples, 0.25%)
ns3::Object::GetTypeId (154,300 samples, 0.02%)
ns3::Callback<void, ns3::UlInfoListElement_s>::operator (2,617,045 samples, 0.27%)
ns3::LteRlcSm::DoNotifyTxOpportunity (4,972,136 samples, 0.51%)
std::map<unsigned short, std::map<unsigned char, ns3::LteMacSapUser*, std::less<unsigned char>, std::allocator<std::pair<unsigned char const, ns3::LteMacSapUser*> > >, std::less<unsigned short>, std::allocator<std::pair<unsigned short const, std::map<unsigned char, ns3::LteMacSapUser*, std::less<unsigned char>, std::allocator<std::pair<unsigned char const, ns3::LteMacSapUser*> > > > > >::find (155,011 samples, 0.02%)
std::_Head_base<5ul, std::map<unsigned int, ns3::Ptr<ns3::SpectrumValue>, std::less<unsigned int>, std::allocator<std::pair<unsigned int const, ns3::Ptr<ns3::SpectrumValue> > > >, false>::_Head_base (152,827 samples, 0.02%)
std::vector<unsigned int, std::allocator<unsigned int> >::_S_max_size (385,945 samples, 0.04%)
std::__cxx11::list<ns3::Ptr<ns3::Packet>, std::allocator<ns3::Ptr<ns3::Packet> > >::push_back (1,437,463 samples, 0.15%)
std::__cxx11::list<ns3::Ptr<ns3::LteControlMessage>, std::allocator<ns3::Ptr<ns3::LteControlMessage> > >::list<std::_List_const_iterator<ns3::Ptr<ns3::LteControlMessage> >, void> (296,881 samples, 0.03%)
std::__cxx11::list<ns3::Ptr<ns3::Packet>, std::allocator<ns3::Ptr<ns3::Packet> > >::begin (458,783 samples, 0.05%)
std::vector<ns3::Callback<void, ns3::SpectrumValue const&>, std::allocator<ns3::Callback<void, ns3::SpectrumValue const&> > >::begin (165,292 samples, 0.02%)
[libc.so.6] (197,502 samples, 0.02%)
ns3::LteRlcSpecificLteMacSapUser::NotifyTxOpportunity (2,715,978 samples, 0.28%)
ns3::Object::Object (2,382,251 samples, 0.25%)
std::_Vector_base<unsigned short, std::allocator<unsigned short> >::_Vector_impl_data::_Vector_impl_data (208,562 samples, 0.02%)
std::_Vector_base<double, std::allocator<double> >::_M_deallocate (164,716 samples, 0.02%)
std::__cxx11::_List_base<ns3::Ptr<ns3::LteControlMessage>, std::allocator<ns3::Ptr<ns3::LteControlMessage> > >::~_List_base (148,437 samples, 0.02%)
std::_Rb_tree_node<std::pair<unsigned int const, ns3::Ptr<ns3::SpectrumValue> > >* std::_Rb_tree<unsigned int, std::pair<unsigned int const, ns3::Ptr<ns3::SpectrumValue> >, std::_Select1st<std::pair<unsigned int const, ns3::Ptr<ns3::SpectrumValue> > >, std::less<unsigned int>, std::allocator<std::pair<unsigned int const, ns3::Ptr<ns3::SpectrumValue> > > >::_M_copy<false, std::_Rb_tree<unsigned int, std::pair<unsigned int const, ns3::Ptr<ns3::SpectrumValue> >, std::_Select1st<std::pair<unsigned int const, ns3::Ptr<ns3::SpectrumValue> > >, std::less<unsigned int>, std::allocator<std::pair<unsigned int const, ns3::Ptr<ns3::SpectrumValue> > > >::_Alloc_node> (158,119 samples, 0.02%)
std::_Rb_tree<unsigned char, std::pair<unsigned char const, ns3::LteMacSapProvider*>, std::_Select1st<std::pair<unsigned char const, ns3::LteMacSapProvider*> >, std::less<unsigned char>, std::allocator<std::pair<unsigned char const, ns3::LteMacSapProvider*> > >::find (1,168,142 samples, 0.12%)
std::map<unsigned char, ns3::LteMacSapProvider*, std::less<unsigned char>, std::allocator<std::pair<unsigned char const, ns3::LteMacSapProvider*> > >::find (366,125 samples, 0.04%)
ns3::LteSpectrumSignalParametersDataFrame::~LteSpectrumSignalParametersDataFrame (2,588,254 samples, 0.27%)
decltype (427,457 samples, 0.04%)
ns3::SbMeasResult_s::SbMeasResult_s (1,121,514 samples, 0.12%)
ns3::UeMemberLteUePhySapProvider::SendLteControlMessage (565,879 samples, 0.06%)
std::_Rb_tree<unsigned short, std::pair<unsigned short const, unsigned int>, std::_Select1st<std::pair<unsigned short const, unsigned int> >, std::less<unsigned short>, std::allocator<std::pair<unsigned short const, unsigned int> > >::_S_key (328,502 samples, 0.03%)
ns3::Ptr<ns3::LteHarqPhy>::operator (155,643 samples, 0.02%)
ns3::CallbackImpl<void, ns3::SpectrumValue const&>::operator (34,942,247 samples, 3.60%) n..
ns3::DefaultSimulatorImpl::Now (163,019 samples, 0.02%)
ns3::Packet::AddByteTag (2,931,180 samples, 0.30%)
std::_Rb_tree<ns3::TbId_t, std::pair<ns3::TbId_t const, ns3::tbInfo_t>, std::_Select1st<std::pair<ns3::TbId_t const, ns3::tbInfo_t> >, std::less<ns3::TbId_t>, std::allocator<std::pair<ns3::TbId_t const, ns3::tbInfo_t> > >::_M_begin (495,256 samples, 0.05%)
std::_Rb_tree<unsigned char, std::pair<unsigned char const, ns3::LteUeMac::LcInfo>, std::_Select1st<std::pair<unsigned char const, ns3::LteUeMac::LcInfo> >, std::less<unsigned char>, std::allocator<std::pair<unsigned char const, ns3::LteUeMac::LcInfo> > >::_M_mbegin (150,034 samples, 0.02%)
std::_Bit_iterator std::__copy_move_a<false, std::_Bit_iterator, std::_Bit_iterator> (219,696 samples, 0.02%)
unsigned char& std::vector<unsigned char, std::allocator<unsigned char> >::emplace_back<unsigned char> (2,914,632 samples, 0.30%)
void ns3::Simulator::ScheduleWithContext<void (7,199,277 samples, 0.74%)
std::_Rb_tree<unsigned short, std::pair<unsigned short const, unsigned char>, std::_Select1st<std::pair<unsigned short const, unsigned char> >, std::less<unsigned short>, std::allocator<std::pair<unsigned short const, unsigned char> > >::begin (395,869 samples, 0.04%)
__gnu_cxx::__normal_iterator<ns3::Buffer::Data* const*, std::vector<ns3::Buffer::Data*, std::allocator<ns3::Buffer::Data*> > >::__normal_iterator (372,628 samples, 0.04%)
ns3::SimpleRefCount<ns3::Packet, ns3::Empty, ns3::DefaultDeleter<ns3::Packet> >::Ref (149,428 samples, 0.02%)
ns3::LteEnbPhy::ReceiveLteControlMessageList (27,232,853 samples, 2.81%) n..
std::vector<unsigned char, std::allocator<unsigned char> >::vector (380,581 samples, 0.04%)
std::vector<bool, std::allocator<bool> >::insert (2,500,355 samples, 0.26%)
ns3::LteEnbPhy::SendDataChannels (46,991,739 samples, 4.85%) ns3..
std::_Rb_tree<unsigned short, std::pair<unsigned short const, std::vector<unsigned short, std::allocator<unsigned short> > >, std::_Select1st<std::pair<unsigned short const, std::vector<unsigned short, std::allocator<unsigned short> > > >, std::less<unsigned short>, std::allocator<std::pair<unsigned short const, std::vector<unsigned short, std::allocator<unsigned short> > > > >::_M_erase_aux (671,551 samples, 0.07%)
std::function<void (2,105,662 samples, 0.22%)
std::_Rb_tree<unsigned short, std::pair<unsigned short const, ns3::DlInfoListElement_s>, std::_Select1st<std::pair<unsigned short const, ns3::DlInfoListElement_s> >, std::less<unsigned short>, std::allocator<std::pair<unsigned short const, ns3::DlInfoListElement_s> > >::_S_key (162,159 samples, 0.02%)
std::_Select1st<std::pair<ns3::Scheduler::EventKey const, ns3::EventImpl*> >::operator (151,635 samples, 0.02%)
std::vector<ns3::UlDciListElement_s, std::allocator<ns3::UlDciListElement_s> >::at (232,176 samples, 0.02%)
ns3::IidManager::GetParent (228,334 samples, 0.02%)
std::map<ns3::Scheduler::EventKey, ns3::EventImpl*, std::less<ns3::Scheduler::EventKey>, std::allocator<std::pair<ns3::Scheduler::EventKey const, ns3::EventImpl*> > >::lower_bound (294,424 samples, 0.03%)
std::_Vector_base<ns3::BuildRarListElement_s, std::allocator<ns3::BuildRarListElement_s> >::_M_get_Tp_allocator (191,995 samples, 0.02%)
std::vector<int, std::allocator<int> >::~vector (149,670 samples, 0.02%)
double* std::__uninitialized_default_n<double*, unsigned long> (153,593 samples, 0.02%)
std::_Tuple_impl<2ul, unsigned int>::_Tuple_impl<unsigned int&> (359,595 samples, 0.04%)
std::__detail::_List_node_header::_List_node_header (128,185 samples, 0.01%)
ns3::RlcPduListElement_s* std::uninitialized_copy<__gnu_cxx::__normal_iterator<ns3::RlcPduListElement_s const*, std::vector<ns3::RlcPduListElement_s, std::allocator<ns3::RlcPduListElement_s> > >, ns3::RlcPduListElement_s*> (980,187 samples, 0.10%)
std::_Bit_iterator std::copy<std::_Bit_iterator, std::_Bit_iterator> (219,696 samples, 0.02%)
void std::_Destroy<ns3::BuildDataListElement_s> (677,511 samples, 0.07%)
ns3::SimpleRefCount<ns3::SpectrumValue, ns3::Empty, ns3::DefaultDeleter<ns3::SpectrumValue> >::Unref (896,241 samples, 0.09%)
std::allocator_traits<std::allocator<std::_List_node<ns3::Ptr<ns3::Packet> > > >::deallocate (181,716 samples, 0.02%)
ns3::UlDciLteControlMessage& std::__cxx11::list<ns3::UlDciLteControlMessage, std::allocator<ns3::UlDciLteControlMessage> >::emplace_back<ns3::UlDciLteControlMessage const&> (2,541,961 samples, 0.26%)
unsigned char* std::__uninitialized_fill_n<true>::__uninit_fill_n<unsigned char*, unsigned long, unsigned char> (378,589 samples, 0.04%)
ns3::DefaultSimulatorImpl::ScheduleNow (347,373 samples, 0.04%)
operator new (404,041 samples, 0.04%)
ns3::LteHarqPhy::SubframeIndication (8,381,908 samples, 0.86%)
std::_Rb_tree_iterator<std::pair<unsigned short const, std::vector<ns3::DlDciListElement_s, std::allocator<ns3::DlDciListElement_s> > > >::operator* (194,523 samples, 0.02%)
std::vector<double, std::allocator<double> >::begin (161,967 samples, 0.02%)
std::allocator<int>::deallocate (169,673 samples, 0.02%)
void std::vector<ns3::UlDciListElement_s, std::allocator<ns3::UlDciListElement_s> >::_M_realloc_insert<ns3::UlDciListElement_s const&> (193,533 samples, 0.02%)
ns3::Ptr<ns3::PacketBurst>& std::forward<ns3::Ptr<ns3::PacketBurst>&> (194,813 samples, 0.02%)
ns3::SpectrumValue::~SpectrumValue (209,498 samples, 0.02%)
ns3::MapScheduler::Insert (1,105,472 samples, 0.11%)
std::vector<int, std::allocator<int> >::max_size (476,394 samples, 0.05%)
std::_Rb_tree<unsigned int, std::pair<unsigned int const, ns3::Ptr<ns3::SpectrumValue> >, std::_Select1st<std::pair<unsigned int const, ns3::Ptr<ns3::SpectrumValue> > >, std::less<unsigned int>, std::allocator<std::pair<unsigned int const, ns3::Ptr<ns3::SpectrumValue> > > >::_Rb_tree (164,996 samples, 0.02%)
ns3::PacketBurst::~PacketBurst (1,309,427 samples, 0.14%)
std::allocator_traits<std::allocator<ns3::DlInfoListElement_s::HarqStatus_e> >::allocate (283,919 samples, 0.03%)
ns3::ByteTagList::Iterator::Iterator (944,025 samples, 0.10%)
__gnu_cxx::__enable_if<std::__is_scalar<double>::__value, void>::__type std::__fill_a1<double*, double> (163,001 samples, 0.02%)
ns3::MapScheduler::Insert (6,361,819 samples, 0.66%)
int* std::copy<__gnu_cxx::__normal_iterator<int const*, std::vector<int, std::allocator<int> > >, int*> (268,424 samples, 0.03%)
ns3::LteEnbPhy::StartSubFrame (345,416,065 samples, 35.62%) ns3::LteEnbPhy::StartSubFrame
ns3::NodeListPriv::Delete (238,924 samples, 0.02%)
std::__new_allocator<int>::deallocate (169,673 samples, 0.02%)
ns3::ObjectDeleter::Delete (384,276 samples, 0.04%)
std::function<void (416,320 samples, 0.04%)
std::vector<ns3::BuildDataListElement_s, std::allocator<ns3::BuildDataListElement_s> >::at (572,518 samples, 0.06%)
ns3::BuildDataListElement_s* std::__uninitialized_copy_a<__gnu_cxx::__normal_iterator<ns3::BuildDataListElement_s const*, std::vector<ns3::BuildDataListElement_s, std::allocator<ns3::BuildDataListElement_s> > >, ns3::BuildDataListElement_s*, ns3::BuildDataListElement_s> (143,073 samples, 0.01%)
std::_Rb_tree_node<std::pair<unsigned char const, ns3::LteMacSapUser*> >::_M_valptr (165,214 samples, 0.02%)
__gnu_cxx::__aligned_membuf<std::pair<ns3::TbId_t const, ns3::tbInfo_t> >::_M_ptr (163,699 samples, 0.02%)
ns3::PacketMetadata::PacketMetadata (473,227 samples, 0.05%)
std::_Tuple_impl<0ul, ns3::LteInterference*, ns3::Ptr<ns3::SpectrumValue const>, unsigned int>::_Tuple_impl<ns3::LteInterference*&, ns3::Ptr<ns3::SpectrumValue const>&, unsigned int&, void> (1,419,200 samples, 0.15%)
std::__cxx11::_List_base<ns3::Ptr<ns3::Packet>, std::allocator<ns3::Ptr<ns3::Packet> > >::_M_get_node (163,447 samples, 0.02%)
(126,576 samples, 0.01%)
void ns3::Callback<void, ns3::SpectrumValue const&>::Callback<void (33,827,307 samples, 3.49%) v..
std::vector<std::vector<ns3::HarqProcessInfoElement_t, std::allocator<ns3::HarqProcessInfoElement_t> >, std::allocator<std::vector<ns3::HarqProcessInfoElement_t, std::allocator<ns3::HarqProcessInfoElement_t> > > >::erase (213,559 samples, 0.02%)
ns3::ByteTagList::Allocate (1,324,752 samples, 0.14%)
std::vector<int, std::allocator<int> >::_S_relocate (163,713 samples, 0.02%)
ns3::LteUePowerControl::CalculatePuschTxPower (1,080,040 samples, 0.11%)
ns3::PacketMetadata::DoAddHeader (167,176 samples, 0.02%)
std::vector<double, std::allocator<double> >::begin (444,735 samples, 0.05%)
std::_Rb_tree<ns3::LteFlowId_t, std::pair<ns3::LteFlowId_t const, ns3::FfMacSchedSapProvider::SchedDlRlcBufferReqParameters>, std::_Select1st<std::pair<ns3::LteFlowId_t const, ns3::FfMacSchedSapProvider::SchedDlRlcBufferReqParameters> >, std::less<ns3::LteFlowId_t>, std::allocator<std::pair<ns3::LteFlowId_t const, ns3::FfMacSchedSapProvider::SchedDlRlcBufferReqParameters> > >::find (652,951 samples, 0.07%)
ns3::LteEnbMac::DoSchedDlConfigInd (4,972,136 samples, 0.51%)
std::_Rb_tree<ns3::Scheduler::EventKey, std::pair<ns3::Scheduler::EventKey const, ns3::EventImpl*>, std::_Select1st<std::pair<ns3::Scheduler::EventKey const, ns3::EventImpl*> >, std::less<ns3::Scheduler::EventKey>, std::allocator<std::pair<ns3::Scheduler::EventKey const, ns3::EventImpl*> > >::lower_bound (1,730,701 samples, 0.18%)
void std::destroy_at<ns3::Ptr<ns3::LteControlMessage> > (652,707 samples, 0.07%)
std::_List_iterator<ns3::Ptr<ns3::Packet> >::_List_iterator (150,899 samples, 0.02%)
ns3::Packet::AddByteTag (557,108 samples, 0.06%)
std::vector<double, std::allocator<double> >::vector (382,560 samples, 0.04%)
std::allocator_traits<std::allocator<double> >::allocate (187,232 samples, 0.02%)
ns3::TypeId::GetParent (669,393 samples, 0.07%)
ns3::SimpleRefCount<ns3::SpectrumValue, ns3::Empty, ns3::DefaultDeleter<ns3::SpectrumValue> >::Unref (401,883 samples, 0.04%)
void std::__cxx11::list<ns3::Ptr<ns3::LteControlMessage>, std::allocator<ns3::Ptr<ns3::LteControlMessage> > >::_M_initialize_dispatch<std::_List_iterator<ns3::Ptr<ns3::LteControlMessage> > > (1,008,998 samples, 0.10%)
std::_Vector_base<ns3::VendorSpecificListElement_s, std::allocator<ns3::VendorSpecificListElement_s> >::_Vector_base (272,688 samples, 0.03%)
std::vector<unsigned char, std::allocator<unsigned char> >::back (228,016 samples, 0.02%)
ns3::Packet::AddByteTag (356,272 samples, 0.04%)
void std::_Destroy<ns3::Ptr<ns3::Object>*, ns3::Ptr<ns3::Object> > (283,533 samples, 0.03%)
std::_Head_base<0ul, ns3::LteEnbPhy*, false>::_M_head (165,500 samples, 0.02%)
std::_Rb_tree<unsigned short, std::pair<unsigned short const, std::vector<unsigned short, std::allocator<unsigned short> > >, std::_Select1st<std::pair<unsigned short const, std::vector<unsigned short, std::allocator<unsigned short> > > >, std::less<unsigned short>, std::allocator<std::pair<unsigned short const, std::vector<unsigned short, std::allocator<unsigned short> > > > >::_Auto_node::_Auto_node<std::piecewise_construct_t const&, std::tuple<unsigned short const&>, std::tuple<> > (264,662 samples, 0.03%)
void std::_Function_base::_Base_manager<std::_Bind<void (819,716 samples, 0.08%)
std::__cxx11::list<ns3::Ptr<ns3::LteControlMessage>, std::allocator<ns3::Ptr<ns3::LteControlMessage> > >::clear (391,980 samples, 0.04%)
std::_Rb_tree<unsigned short, std::pair<unsigned short const, ns3::LteEnbComponentCarrierManager::UeInfo>, std::_Select1st<std::pair<unsigned short const, ns3::LteEnbComponentCarrierManager::UeInfo> >, std::less<unsigned short>, std::allocator<std::pair<unsigned short const, ns3::LteEnbComponentCarrierManager::UeInfo> > >::lower_bound (1,723,216 samples, 0.18%)
void std::__fill_a<unsigned int*, unsigned int> (567,534 samples, 0.06%)
ns3::PacketTagList::RemoveAll (244,626 samples, 0.03%)
ns3::CqiListElement_s::CqiListElement_s (2,022,367 samples, 0.21%)
double* std::__fill_n_a<double*, unsigned long, double> (423,425 samples, 0.04%)
std::_Rb_tree_node<std::pair<unsigned short const, std::vector<std::vector<ns3::HarqProcessInfoElement_t, std::allocator<ns3::HarqProcessInfoElement_t> >, std::allocator<std::vector<ns3::HarqProcessInfoElement_t, std::allocator<ns3::HarqProcessInfoElement_t> > > > > >::_M_valptr (532,897 samples, 0.05%)
ns3::PacketBurst::PacketBurst (1,593,239 samples, 0.16%)
ns3::SpectrumValue::ConstValuesEnd (157,751 samples, 0.02%)
void std::allocator_traits<std::allocator<std::_Rb_tree_node<std::pair<ns3::Scheduler::EventKey const, ns3::EventImpl*> > > >::construct<std::pair<ns3::Scheduler::EventKey const, ns3::EventImpl*>, std::pair<ns3::Scheduler::EventKey, ns3::EventImpl*> > (482,063 samples, 0.05%)
ns3::PacketMetadata::Allocate (495,360 samples, 0.05%)
std::_Rb_tree<unsigned short, std::pair<unsigned short const, unsigned char>, std::_Select1st<std::pair<unsigned short const, unsigned char> >, std::less<unsigned short>, std::allocator<std::pair<unsigned short const, unsigned char> > >::_M_lower_bound (722,107 samples, 0.07%)
ns3::RlcTag::RlcTag (277,392 samples, 0.03%)
ns3::LteInterference::ConditionallyEvaluateChunk (281,840 samples, 0.03%)
std::__cxx11::list<ns3::Ptr<ns3::LteControlMessage>, std::allocator<ns3::Ptr<ns3::LteControlMessage> > >::_M_move_assign (879,906 samples, 0.09%)
(155,643 samples, 0.02%)
std::_Function_base::_Base_manager<void (242,907 samples, 0.03%)
ns3::Object::~Object (423,388 samples, 0.04%)
std::_Rb_tree_node<std::pair<unsigned char const, ns3::LteUeMac::LcInfo> >::_M_valptr (354,247 samples, 0.04%)
ns3::Object::~Object (190,190 samples, 0.02%)
ns3::EnbMacMemberFfMacSchedSapUser::SchedDlConfigInd (4,972,136 samples, 0.51%)
ns3::Ptr<ns3::PacketBurst> ns3::CompleteConstruct<ns3::PacketBurst> (2,205,090 samples, 0.23%)
std::__new_allocator<double>::allocate (525,645 samples, 0.05%)
std::_Rb_tree_node<std::pair<ns3::Scheduler::EventKey const, ns3::EventImpl*> >* std::_Rb_tree<ns3::Scheduler::EventKey, std::pair<ns3::Scheduler::EventKey const, ns3::EventImpl*>, std::_Select1st<std::pair<ns3::Scheduler::EventKey const, ns3::EventImpl*> >, std::less<ns3::Scheduler::EventKey>, std::allocator<std::pair<ns3::Scheduler::EventKey const, ns3::EventImpl*> > >::_M_create_node<std::pair<ns3::Scheduler::EventKey, ns3::EventImpl*> > (382,281 samples, 0.04%)
ns3::Simulator::Now (287,971 samples, 0.03%)
ns3::MemberLteCcmMacSapUser<ns3::NoOpComponentCarrierManager>::NotifyTxOpportunity (4,972,136 samples, 0.51%)
ns3::Ptr<ns3::SpectrumSignalParameters>::~Ptr (3,402,650 samples, 0.35%)
ns3::PacketBurst::AddPacket (1,515,978 samples, 0.16%)
std::pair<std::_Rb_tree_node_base*, std::_Rb_tree_node_base*>::pair<std::_Rb_tree_node<std::pair<ns3::TbId_t const, ns3::tbInfo_t> >*&, std::_Rb_tree_node_base*&> (199,710 samples, 0.02%)
std::vector<ns3::HarqProcessInfoElement_t, std::allocator<ns3::HarqProcessInfoElement_t> >::~vector (196,954 samples, 0.02%)
std::_Bit_iterator_base::_Bit_iterator_base (157,638 samples, 0.02%)
std::vector<ns3::ByteTagListData*, std::allocator<ns3::ByteTagListData*> >::end (256,004 samples, 0.03%)
ns3::LteHarqPhy::ResetDlHarqProcessStatus (597,412 samples, 0.06%)
std::vector<double, std::allocator<double> >::_S_max_size (204,572 samples, 0.02%)
unsigned short* std::__fill_n_a<unsigned short*, unsigned long, unsigned short> (459,034 samples, 0.05%)
std::_Vector_base<int, std::allocator<int> >::_Vector_impl::_Vector_impl (166,957 samples, 0.02%)
ns3::LtePhy::GetDevice (325,125 samples, 0.03%)
ns3::PacketBurst::~PacketBurst (650,228 samples, 0.07%)
ns3::Ptr<ns3::MobilityModel>::Acquire (190,764 samples, 0.02%)
ns3::DlInfoListElement_s::HarqStatus_e* std::uninitialized_copy<__gnu_cxx::__normal_iterator<ns3::DlInfoListElement_s::HarqStatus_e const*, std::vector<ns3::DlInfoListElement_s::HarqStatus_e, std::allocator<ns3::DlInfoListElement_s::HarqStatus_e> > >, ns3::DlInfoListElement_s::HarqStatus_e*> (234,294 samples, 0.02%)
std::_Vector_base<ns3::DlInfoListElement_s, std::allocator<ns3::DlInfoListElement_s> >::_Vector_impl::_Vector_impl (431,145 samples, 0.04%)
void std::allocator_traits<std::allocator<std::vector<ns3::HarqProcessInfoElement_t, std::allocator<ns3::HarqProcessInfoElement_t> > > >::construct<std::vector<ns3::HarqProcessInfoElement_t, std::allocator<ns3::HarqProcessInfoElement_t> >, std::vector<ns3::HarqProcessInfoElement_t, std::allocator<ns3::HarqProcessInfoElement_t> > const&> (338,177 samples, 0.03%)
ns3::Ptr<ns3::Packet>::~Ptr (439,896 samples, 0.05%)
std::_List_node<ns3::Ptr<ns3::LteControlMessage> >* std::__cxx11::list<ns3::Ptr<ns3::LteControlMessage>, std::allocator<ns3::Ptr<ns3::LteControlMessage> > >::_M_create_node<ns3::Ptr<ns3::MibLteControlMessage>&> (190,229 samples, 0.02%)
std::function<void (1,320,674 samples, 0.14%)
ns3::SpectrumValue::operator+= (1,512,778 samples, 0.16%)
std::_Rb_tree<unsigned short, std::pair<unsigned short const, std::vector<double, std::allocator<double> > >, std::_Select1st<std::pair<unsigned short const, std::vector<double, std::allocator<double> > > >, std::less<unsigned short>, std::allocator<std::pair<unsigned short const, std::vector<double, std::allocator<double> > > > >::~_Rb_tree (1,100,157 samples, 0.11%)
std::_Vector_base<double, std::allocator<double> >::~_Vector_base (206,667 samples, 0.02%)
ns3::LteEnbPhy::EndSubFrame (1,332,546 samples, 0.14%)
ns3::Ptr<ns3::SpectrumModel const>::operator (311,768 samples, 0.03%)
std::_Rb_tree<unsigned short, std::pair<unsigned short const, ns3::DlInfoListElement_s>, std::_Select1st<std::pair<unsigned short const, ns3::DlInfoListElement_s> >, std::less<unsigned short>, std::allocator<std::pair<unsigned short const, ns3::DlInfoListElement_s> > >::_M_mbegin (153,550 samples, 0.02%)
std::_Rb_tree<unsigned short, std::pair<unsigned short const, std::vector<unsigned char, std::allocator<unsigned char> > >, std::_Select1st<std::pair<unsigned short const, std::vector<unsigned char, std::allocator<unsigned char> > > >, std::less<unsigned short>, std::allocator<std::pair<unsigned short const, std::vector<unsigned char, std::allocator<unsigned char> > > > >::_M_begin (556,533 samples, 0.06%)
__gnu_cxx::__aligned_membuf<std::pair<unsigned char const, ns3::LteMacSapProvider::ReportBufferStatusParameters> >::_M_ptr (148,477 samples, 0.02%)
std::_Rb_tree_node<std::pair<unsigned short const, std::vector<double, std::allocator<double> > > >* std::_Rb_tree<unsigned short, std::pair<unsigned short const, std::vector<double, std::allocator<double> > >, std::_Select1st<std::pair<unsigned short const, std::vector<double, std::allocator<double> > > >, std::less<unsigned short>, std::allocator<std::pair<unsigned short const, std::vector<double, std::allocator<double> > > > >::_M_copy<false, std::_Rb_tree<unsigned short, std::pair<unsigned short const, std::vector<double, std::allocator<double> > >, std::_Select1st<std::pair<unsigned short const, std::vector<double, std::allocator<double> > > >, std::less<unsigned short>, std::allocator<std::pair<unsigned short const, std::vector<double, std::allocator<double> > > > >::_Alloc_node> (361,417 samples, 0.04%)
ns3::PacketBurst::AddPacket (729,577 samples, 0.08%)
std::operator== (159,203 samples, 0.02%)
void std::allocator_traits<std::allocator<ns3::DlInfoListElement_s> >::construct<ns3::DlInfoListElement_s, ns3::DlInfoListElement_s const&> (233,530 samples, 0.02%)
ns3::Ptr<ns3::SpectrumValue const>::operator (353,348 samples, 0.04%)
std::_Rb_tree<unsigned short, std::pair<unsigned short const, std::vector<unsigned short, std::allocator<unsigned short> > >, std::_Select1st<std::pair<unsigned short const, std::vector<unsigned short, std::allocator<unsigned short> > > >, std::less<unsigned short>, std::allocator<std::pair<unsigned short const, std::vector<unsigned short, std::allocator<unsigned short> > > > >::~_Rb_tree (148,912 samples, 0.02%)
double* std::__copy_move_a2<false, double const*, double*> (158,087 samples, 0.02%)
ns3::MultiModelSpectrumChannel::FindAndEventuallyAddTxSpectrumModel (3,241,661 samples, 0.33%)
std::_Vector_base<ns3::DlInfoListElement_s::HarqStatus_e, std::allocator<ns3::DlInfoListElement_s::HarqStatus_e> >::~_Vector_base (187,024 samples, 0.02%)
ns3::DlInfoListElement_s* std::__do_uninit_copy<__gnu_cxx::__normal_iterator<ns3::DlInfoListElement_s const*, std::vector<ns3::DlInfoListElement_s, std::allocator<ns3::DlInfoListElement_s> > >, ns3::DlInfoListElement_s*> (4,706,249 samples, 0.49%)
ns3::DlInfoListElement_s* std::__uninitialized_copy_a<ns3::DlInfoListElement_s*, ns3::DlInfoListElement_s*, ns3::DlInfoListElement_s> (632,143 samples, 0.07%)
std::map<unsigned int, ns3::TxSpectrumModelInfo, std::less<unsigned int>, std::allocator<std::pair<unsigned int const, ns3::TxSpectrumModelInfo> > >::find (188,402 samples, 0.02%)
__gnu_cxx::__normal_iterator<int*, std::vector<int, std::allocator<int> > > std::__copy_move_a<false, __gnu_cxx::__normal_iterator<int const*, std::vector<int, std::allocator<int> > >, __gnu_cxx::__normal_iterator<int*, std::vector<int, std::allocator<int> > > > (489,292 samples, 0.05%)
std::_Rb_tree_node<std::pair<unsigned int const, ns3::Ptr<ns3::SpectrumValue> > >* std::_Rb_tree<unsigned int, std::pair<unsigned int const, ns3::Ptr<ns3::SpectrumValue> >, std::_Select1st<std::pair<unsigned int const, ns3::Ptr<ns3::SpectrumValue> > >, std::less<unsigned int>, std::allocator<std::pair<unsigned int const, ns3::Ptr<ns3::SpectrumValue> > > >::_M_copy<false, std::_Rb_tree<unsigned int, std::pair<unsigned int const, ns3::Ptr<ns3::SpectrumValue> >, std::_Select1st<std::pair<unsigned int const, ns3::Ptr<ns3::SpectrumValue> > >, std::less<unsigned int>, std::allocator<std::pair<unsigned int const, ns3::Ptr<ns3::SpectrumValue> > > >::_Alloc_node> (156,128 samples, 0.02%)
ns3::Time::FromInteger (159,767 samples, 0.02%)
ns3::LteNetDevice::GetNode (153,775 samples, 0.02%)
double* std::__uninitialized_default_n_1<true>::__uninit_default_n<double*, unsigned long> (455,698 samples, 0.05%)
std::_Bind<void (624,065 samples, 0.06%)
operator new (169,720 samples, 0.02%)
std::_Rb_tree_node<std::pair<unsigned short const, unsigned char> >::_M_valptr (226,643 samples, 0.02%)
std::_Rb_tree_node<std::pair<ns3::Scheduler::EventKey const, ns3::EventImpl*> >::_M_valptr (320,775 samples, 0.03%)
ns3::MemberLteCcmMacSapUser<ns3::NoOpComponentCarrierManager>::NotifyTxOpportunity (17,080,246 samples, 1.76%)
std::map<int, double, std::less<int>, std::allocator<std::pair<int const, double> > >::clear (1,170,710 samples, 0.12%)
void std::allocator_traits<std::allocator<std::_Rb_tree_node<std::pair<int const, double> > > >::construct<std::pair<int const, double>, std::pair<int, double> > (184,474 samples, 0.02%)
ns3::Ptr<ns3::LteUePhy>::Acquire (125,424 samples, 0.01%)
ns3::UeMemberLteUePhySapUser::SubframeIndication (16,576,198 samples, 1.71%)
std::_Rb_tree<unsigned short, std::pair<unsigned short const, std::vector<double, std::allocator<double> > >, std::_Select1st<std::pair<unsigned short const, std::vector<double, std::allocator<double> > > >, std::less<unsigned short>, std::allocator<std::pair<unsigned short const, std::vector<double, std::allocator<double> > > > >::_Rb_tree_impl<std::less<unsigned short>, true>::_Rb_tree_impl (160,812 samples, 0.02%)
__gnu_cxx::__aligned_membuf<std::pair<unsigned char const, ns3::LteUeMac::LcInfo> >::_M_ptr (158,124 samples, 0.02%)
ns3::LteEnbRrc::DoAllocateTemporaryCellRnti (285,958 samples, 0.03%)
bool std::operator==<ns3::MacCeListElement_s*> (157,395 samples, 0.02%)
(368,315 samples, 0.04%)
std::_Tuple_impl<1ul, ns3::Ptr<ns3::SpectrumValue>, double, ns3::Ptr<ns3::SpectrumSignalParameters>, ns3::Ptr<ns3::SpectrumPhy>, std::map<unsigned int, ns3::Ptr<ns3::SpectrumValue>, std::less<unsigned int>, std::allocator<std::pair<unsigned int const, ns3::Ptr<ns3::SpectrumValue> > > > >::_Tuple_impl<ns3::Ptr<ns3::SpectrumValue>&, double&, ns3::Ptr<ns3::SpectrumSignalParameters>&, ns3::Ptr<ns3::SpectrumPhy>&, std::map<unsigned int, ns3::Ptr<ns3::SpectrumValue>, std::less<unsigned int>, std::allocator<std::pair<unsigned int const, ns3::Ptr<ns3::SpectrumValue> > > >&, void> (433,048 samples, 0.04%)
std::enable_if<is_invocable_r_v<void, ns3::Callback<void, ns3::SpectrumValue const&>::Callback<void (19,222,845 samples, 1.98%)
double* std::__uninitialized_copy<true>::__uninit_copy<__gnu_cxx::__normal_iterator<double const*, std::vector<double, std::allocator<double> > >, double*> (381,898 samples, 0.04%)
std::__new_allocator<double>::allocate (168,940 samples, 0.02%)
void std::_Destroy<ns3::Ptr<ns3::Object>*, ns3::Ptr<ns3::Object> > (209,811 samples, 0.02%)
std::_Vector_base<ns3::HigherLayerSelected_s, std::allocator<ns3::HigherLayerSelected_s> >::_M_create_storage (226,584 samples, 0.02%)
ns3::Ptr<ns3::DlDciLteControlMessage>::Acquire (148,949 samples, 0.02%)
void std::_Function_base::_Base_manager<std::_Bind<void (635,851 samples, 0.07%)
void std::vector<std::vector<ns3::RlcPduListElement_s, std::allocator<ns3::RlcPduListElement_s> >, std::allocator<std::vector<ns3::RlcPduListElement_s, std::allocator<ns3::RlcPduListElement_s> > > >::_M_realloc_insert<std::vector<ns3::RlcPduListElement_s, std::allocator<ns3::RlcPduListElement_s> > const&> (290,247 samples, 0.03%)
std::vector<unsigned char, std::allocator<unsigned char> >::_S_max_size (200,229 samples, 0.02%)
std::_Rb_tree_iterator<std::pair<unsigned short const, std::vector<std::vector<std::vector<ns3::RlcPduListElement_s, std::allocator<ns3::RlcPduListElement_s> >, std::allocator<std::vector<ns3::RlcPduListElement_s, std::allocator<ns3::RlcPduListElement_s> > > >, std::allocator<std::vector<std::vector<ns3::RlcPduListElement_s, std::allocator<ns3::RlcPduListElement_s> >, std::allocator<std::vector<ns3::RlcPduListElement_s, std::allocator<ns3::RlcPduListElement_s> > > > > > > >::operator* (194,762 samples, 0.02%)
ns3::DlInfoListElement_s::DlInfoListElement_s (158,074 samples, 0.02%)
std::__detail::_List_node_header::_M_move_nodes (255,202 samples, 0.03%)
std::_Rb_tree<unsigned short, std::pair<unsigned short const, ns3::DlInfoListElement_s>, std::_Select1st<std::pair<unsigned short const, ns3::DlInfoListElement_s> >, std::less<unsigned short>, std::allocator<std::pair<unsigned short const, ns3::DlInfoListElement_s> > >::_M_insert_node (177,353 samples, 0.02%)
std::_Vector_base<ns3::HarqProcessInfoElement_t, std::allocator<ns3::HarqProcessInfoElement_t> >::_M_create_storage (390,330 samples, 0.04%)
std::vector<ns3::HigherLayerSelected_s, std::allocator<ns3::HigherLayerSelected_s> >::_M_range_check (238,739 samples, 0.02%)
std::_Vector_base<double, std::allocator<double> >::_M_allocate (525,645 samples, 0.05%)
ns3::HigherLayerSelected_s* std::__relocate_a<ns3::HigherLayerSelected_s*, ns3::HigherLayerSelected_s*, std::allocator<ns3::HigherLayerSelected_s> > (1,169,244 samples, 0.12%)
ns3::MakeEvent<void (1,764,218 samples, 0.18%)
ns3::PfFfMacScheduler::UpdateHarqProcessId (239,156 samples, 0.02%)
std::_Rb_tree<unsigned short, unsigned short, std::_Identity<unsigned short>, std::less<unsigned short>, std::allocator<unsigned short> >::_S_key (358,882 samples, 0.04%)
std::vector<ns3::HigherLayerSelected_s, std::allocator<ns3::HigherLayerSelected_s> >::~vector (374,665 samples, 0.04%)
void std::allocator_traits<std::allocator<std::_List_node<ns3::Ptr<ns3::Packet> > > >::destroy<ns3::Ptr<ns3::Packet> > (4,680,368 samples, 0.48%)
ns3::CeBitmap_e* std::__uninitialized_copy_a<__gnu_cxx::__normal_iterator<ns3::CeBitmap_e const*, std::vector<ns3::CeBitmap_e, std::allocator<ns3::CeBitmap_e> > >, ns3::CeBitmap_e*, ns3::CeBitmap_e> (492,021 samples, 0.05%)
std::vector<double, std::allocator<double> >::vector (2,627,460 samples, 0.27%)
ns3::Ptr<ns3::Node>::operator (199,807 samples, 0.02%)
ns3::CallbackImpl<void, std::__cxx11::list<ns3::Ptr<ns3::LteControlMessage>, std::allocator<ns3::Ptr<ns3::LteControlMessage> > > >::operator (28,473,128 samples, 2.94%) n..
ns3::Ptr<ns3::LteSpectrumSignalParametersDlCtrlFrame>::operator (233,577 samples, 0.02%)
std::_Rb_tree<unsigned char, std::pair<unsigned char const, ns3::LteUeMac::LcInfo>, std::_Select1st<std::pair<unsigned char const, ns3::LteUeMac::LcInfo> >, std::less<unsigned char>, std::allocator<std::pair<unsigned char const, ns3::LteUeMac::LcInfo> > >::find (1,422,685 samples, 0.15%)
ns3::DefaultSimulatorImpl::Schedule (273,170 samples, 0.03%)
unsigned short* std::uninitialized_copy<__gnu_cxx::__normal_iterator<unsigned short const*, std::vector<unsigned short, std::allocator<unsigned short> > >, unsigned short*> (584,765 samples, 0.06%)
std::allocator_traits<std::allocator<int> >::allocate (127,251 samples, 0.01%)
std::vector<ns3::FfMacSchedSapProvider::SchedUlCqiInfoReqParameters, std::allocator<ns3::FfMacSchedSapProvider::SchedUlCqiInfoReqParameters> >::size (152,504 samples, 0.02%)
ns3::BuildDataListElement_s::~BuildDataListElement_s (871,986 samples, 0.09%)
ns3::PacketBurst::DoDispose (1,332,739 samples, 0.14%)
ns3::Object::GetTypeId (626,440 samples, 0.06%)
double* std::__uninitialized_default_n_1<true>::__uninit_default_n<double*, unsigned long> (854,790 samples, 0.09%)
ns3::Seconds (1,997,083 samples, 0.21%)
std::vector<ns3::Ptr<ns3::PacketBurst>, std::allocator<ns3::Ptr<ns3::PacketBurst> > >::at (190,464 samples, 0.02%)
std::_Rb_tree<unsigned short, std::pair<unsigned short const, std::vector<unsigned char, std::allocator<unsigned char> > >, std::_Select1st<std::pair<unsigned short const, std::vector<unsigned char, std::allocator<unsigned char> > > >, std::less<unsigned short>, std::allocator<std::pair<unsigned short const, std::vector<unsigned char, std::allocator<unsigned char> > > > >::end (163,346 samples, 0.02%)
std::__cxx11::_List_base<ns3::Ptr<ns3::LteControlMessage>, std::allocator<ns3::Ptr<ns3::LteControlMessage> > >::_M_move_nodes (220,549 samples, 0.02%)
std::operator== (384,996 samples, 0.04%)
__gnu_cxx::__normal_iterator<ns3::Callback<void, ns3::SpectrumValue const&>*, std::vector<ns3::Callback<void, ns3::SpectrumValue const&>, std::allocator<ns3::Callback<void, ns3::SpectrumValue const&> > > >::operator* (196,136 samples, 0.02%)
void std::_Destroy<ns3::CqiListElement_s*> (183,284 samples, 0.02%)
ns3::LteUePhy::GetSubChannelsForTransmission (198,351 samples, 0.02%)
std::vector<double, std::allocator<double> >::~vector (190,332 samples, 0.02%)
std::_Vector_base<unsigned short, std::allocator<unsigned short> >::_M_allocate (565,924 samples, 0.06%)
std::_Vector_base<ns3::HarqProcessInfoElement_t, std::allocator<ns3::HarqProcessInfoElement_t> >::_Vector_impl_data::_Vector_impl_data (274,833 samples, 0.03%)
ns3::MemberSchedSapProvider<ns3::PfFfMacScheduler>::SchedDlCqiInfoReq (4,461,995 samples, 0.46%)
ns3::TagBuffer::WriteU32 (368,447 samples, 0.04%)
std::_Rb_tree<unsigned short, std::pair<unsigned short const, ns3::DlInfoListElement_s>, std::_Select1st<std::pair<unsigned short const, ns3::DlInfoListElement_s> >, std::less<unsigned short>, std::allocator<std::pair<unsigned short const, ns3::DlInfoListElement_s> > >::_M_get_node (205,320 samples, 0.02%)
std::_Rb_tree_node<std::pair<int const, double> >* std::_Rb_tree<int, std::pair<int const, double>, std::_Select1st<std::pair<int const, double> >, std::less<int>, std::allocator<std::pair<int const, double> > >::_M_copy<false, std::_Rb_tree<int, std::pair<int const, double>, std::_Select1st<std::pair<int const, double> >, std::less<int>, std::allocator<std::pair<int const, double> > >::_Alloc_node> (254,628 samples, 0.03%)
std::_Vector_base<int, std::allocator<int> >::_M_create_storage (336,936 samples, 0.03%)
ns3::PacketBurst::PacketBurst (3,093,540 samples, 0.32%)
std::_Vector_base<unsigned char, std::allocator<unsigned char> >::_Vector_base (448,289 samples, 0.05%)
std::allocator<std::_List_node<ns3::Ptr<ns3::Packet> > >::deallocate (181,716 samples, 0.02%)
std::allocator<double>::allocate (126,483 samples, 0.01%)
ns3::Ptr<ns3::NixVector>::Acquire (185,459 samples, 0.02%)
double* std::__uninitialized_copy_a<__gnu_cxx::__normal_iterator<double const*, std::vector<double, std::allocator<double> > >, double*, double> (1,091,128 samples, 0.11%)
ns3::Ptr<ns3::SpectrumModel>::Ptr (197,437 samples, 0.02%)
std::vector<bool, std::allocator<bool> >::end (200,433 samples, 0.02%)
ns3::DlInfoListElement_s::DlInfoListElement_s (485,819 samples, 0.05%)
std::vector<unsigned char, std::allocator<unsigned char> >::~vector (190,389 samples, 0.02%)
std::__new_allocator<unsigned int>::deallocate (227,074 samples, 0.02%)
ns3::LogComponent::IsEnabled (145,431 samples, 0.01%)
std::__cxx11::list<ns3::Ptr<ns3::Packet>, std::allocator<ns3::Ptr<ns3::Packet> > >::clear (5,452,785 samples, 0.56%)
ns3::Packet::FindFirstMatchingByteTag (3,774,692 samples, 0.39%)
ns3::Time::~Time (269,324 samples, 0.03%)
ns3::PacketMetadata::Create (987,265 samples, 0.10%)
std::__new_allocator<ns3::RlcPduListElement_s>::allocate (190,161 samples, 0.02%)
ns3::HarqProcessInfoElement_t* std::__niter_wrap<ns3::HarqProcessInfoElement_t*> (124,684 samples, 0.01%)
double* std::__fill_n_a<double*, unsigned long, double> (248,267 samples, 0.03%)
void std::_Rb_tree<int, std::pair<int const, double>, std::_Select1st<std::pair<int const, double> >, std::less<int>, std::allocator<std::pair<int const, double> > >::_M_construct_node<std::pair<int, double> > (224,432 samples, 0.02%)
std::map<unsigned short, std::vector<double, std::allocator<double> >, std::less<unsigned short>, std::allocator<std::pair<unsigned short const, std::vector<double, std::allocator<double> > > > >::map (400,356 samples, 0.04%)
ns3::Ptr<ns3::SpectrumValue const>::operator (124,716 samples, 0.01%)
std::__cxx11::list<ns3::Ptr<ns3::LteControlMessage>, std::allocator<ns3::Ptr<ns3::LteControlMessage> > >::list (214,722 samples, 0.02%)
std::_Tuple_impl<0ul, ns3::LteEnbPhy*, ns3::Ptr<ns3::PacketBurst> >::~_Tuple_impl (343,746 samples, 0.04%)
unsigned char* std::__uninitialized_fill_n_a<unsigned char*, unsigned long, unsigned char, unsigned char> (189,712 samples, 0.02%)
__gnu_cxx::__normal_iterator<std::__cxx11::list<ns3::UlDciLteControlMessage, std::allocator<ns3::UlDciLteControlMessage> > const*, std::vector<std::__cxx11::list<ns3::UlDciLteControlMessage, std::allocator<ns3::UlDciLteControlMessage> >, std::allocator<std::__cxx11::list<ns3::UlDciLteControlMessage, std::allocator<ns3::UlDciLteControlMessage> > > > >::difference_type __gnu_cxx::operator-<std::__cxx11::list<ns3::UlDciLteControlMessage, std::allocator<ns3::UlDciLteControlMessage> > const*, std::vector<std::__cxx11::list<ns3::UlDciLteControlMessage, std::allocator<ns3::UlDciLteControlMessage> >, std::allocator<std::__cxx11::list<ns3::UlDciLteControlMessage, std::allocator<ns3::UlDciLteControlMessage> > > > > (232,766 samples, 0.02%)
std::_Rb_tree<ns3::Scheduler::EventKey, std::pair<ns3::Scheduler::EventKey const, ns3::EventImpl*>, std::_Select1st<std::pair<ns3::Scheduler::EventKey const, ns3::EventImpl*> >, std::less<ns3::Scheduler::EventKey>, std::allocator<std::pair<ns3::Scheduler::EventKey const, ns3::EventImpl*> > >::_M_lower_bound (257,394 samples, 0.03%)
__gnu_cxx::__normal_iterator<unsigned char*, std::vector<unsigned char, std::allocator<unsigned char> > > std::copy<__gnu_cxx::__normal_iterator<unsigned char const*, std::vector<unsigned char, std::allocator<unsigned char> > >, __gnu_cxx::__normal_iterator<unsigned char*, std::vector<unsigned char, std::allocator<unsigned char> > > > (155,513 samples, 0.02%)
std::vector<int, std::allocator<int> >::push_back (2,004,725 samples, 0.21%)
void std::__cxx11::list<ns3::Ptr<ns3::LteControlMessage>, std::allocator<ns3::Ptr<ns3::LteControlMessage> > >::_M_insert<ns3::Ptr<ns3::LteControlMessage> const&> (1,464,277 samples, 0.15%)
ns3::operator- (384,216 samples, 0.04%)
__gnu_cxx::__normal_iterator<std::__cxx11::list<ns3::Ptr<ns3::LteControlMessage>, std::allocator<ns3::Ptr<ns3::LteControlMessage> > > const*, std::vector<std::__cxx11::list<ns3::Ptr<ns3::LteControlMessage>, std::allocator<ns3::Ptr<ns3::LteControlMessage> > >, std::allocator<std::__cxx11::list<ns3::Ptr<ns3::LteControlMessage>, std::allocator<ns3::Ptr<ns3::LteControlMessage> > > > > >::__normal_iterator<std::__cxx11::list<ns3::Ptr<ns3::LteControlMessage>, std::allocator<ns3::Ptr<ns3::LteControlMessage> > >*, void> (177,392 samples, 0.02%)
ns3::Buffer::Buffer (424,494 samples, 0.04%)
std::vector<double, std::allocator<double> >::_M_default_initialize (197,197 samples, 0.02%)
void std::_Function_base::_Base_manager<std::_Bind<void (494,131 samples, 0.05%)
ns3::Ptr<ns3::SpectrumValue const>::~Ptr (896,241 samples, 0.09%)
double* std::__uninitialized_default_n_a<double*, unsigned long, double> (396,416 samples, 0.04%)
std::less<unsigned char>::operator (261,389 samples, 0.03%)
ns3::LteEnbPhy::StartSubFrame (1,650,854 samples, 0.17%)
std::_Rb_tree<unsigned char, std::pair<unsigned char const, ns3::LteMacSapProvider::ReportBufferStatusParameters>, std::_Select1st<std::pair<unsigned char const, ns3::LteMacSapProvider::ReportBufferStatusParameters> >, std::less<unsigned char>, std::allocator<std::pair<unsigned char const, ns3::LteMacSapProvider::ReportBufferStatusParameters> > >::_S_left (126,198 samples, 0.01%)
std::vector<ns3::DlInfoListElement_s::HarqStatus_e, std::allocator<ns3::DlInfoListElement_s::HarqStatus_e> >::vector (247,613 samples, 0.03%)
ns3::LteEnbPhy*& std::__get_helper<0ul, ns3::LteEnbPhy*, ns3::Ptr<ns3::PacketBurst> > (368,229 samples, 0.04%)
std::__cxx11::list<ns3::UlDciLteControlMessage, std::allocator<ns3::UlDciLteControlMessage> >::push_back (279,441 samples, 0.03%)
ns3::Ptr<ns3::DlDciLteControlMessage>::Acquire (124,599 samples, 0.01%)
ns3::MakeEvent<> (238,924 samples, 0.02%)
std::_Rb_tree_node<std::pair<int const, double> >* std::_Rb_tree<int, std::pair<int const, double>, std::_Select1st<std::pair<int const, double> >, std::less<int>, std::allocator<std::pair<int const, double> > >::_M_copy<false, std::_Rb_tree<int, std::pair<int const, double>, std::_Select1st<std::pair<int const, double> >, std::less<int>, std::allocator<std::pair<int const, double> > >::_Alloc_node> (1,456,622 samples, 0.15%)
ns3::HarqProcessInfoElement_t* std::__uninitialized_copy_a<__gnu_cxx::__normal_iterator<ns3::HarqProcessInfoElement_t const*, std::vector<ns3::HarqProcessInfoElement_t, std::allocator<ns3::HarqProcessInfoElement_t> > >, ns3::HarqProcessInfoElement_t*, ns3::HarqProcessInfoElement_t> (1,606,901 samples, 0.17%)
ns3::HarqProcessInfoElement_t* std::__copy_move_a<false, __gnu_cxx::__normal_iterator<ns3::HarqProcessInfoElement_t const*, std::vector<ns3::HarqProcessInfoElement_t, std::allocator<ns3::HarqProcessInfoElement_t> > >, ns3::HarqProcessInfoElement_t*> (368,668 samples, 0.04%)
std::vector<unsigned char, std::allocator<unsigned char> >::vector (1,820,097 samples, 0.19%)
void std::_Destroy<ns3::DlInfoListElement_s::HarqStatus_e*> (305,928 samples, 0.03%)
ns3::PacketBurst::End (439,641 samples, 0.05%)
std::map<unsigned short, unsigned int, std::less<unsigned short>, std::allocator<std::pair<unsigned short const, unsigned int> > >::find (147,114 samples, 0.02%)
std::vector<ns3::DlInfoListElement_s, std::allocator<ns3::DlInfoListElement_s> >::size (156,294 samples, 0.02%)
std::_Rb_tree<unsigned int, std::pair<unsigned int const, ns3::Ptr<ns3::SpectrumValue> >, std::_Select1st<std::pair<unsigned int const, ns3::Ptr<ns3::SpectrumValue> > >, std::less<unsigned int>, std::allocator<std::pair<unsigned int const, ns3::Ptr<ns3::SpectrumValue> > > >::_Auto_node::_M_key (314,000 samples, 0.03%)
void std::_Construct<ns3::UlInfoListElement_s, ns3::UlInfoListElement_s const&> (496,472 samples, 0.05%)
ns3::SpectrumValue::Multiply (372,175 samples, 0.04%)
std::__cxx11::_List_base<ns3::UlDciLteControlMessage, std::allocator<ns3::UlDciLteControlMessage> >::_M_get_node (539,388 samples, 0.06%)
__gnu_cxx::__normal_iterator<ns3::Buffer::Data**, std::vector<ns3::Buffer::Data*, std::allocator<ns3::Buffer::Data*> > >::operator- (234,189 samples, 0.02%)
std::_Rb_tree_node<std::pair<unsigned int const, ns3::TxSpectrumModelInfo> >::_M_valptr (407,755 samples, 0.04%)
ns3::Ptr<ns3::SpectrumPhy>::Ptr (158,076 samples, 0.02%)
ns3::Singleton<ns3::IidManager>::Get (156,696 samples, 0.02%)
atan2f32x (411,872 samples, 0.04%)
ns3::EnbMacMemberLteMacSapProvider<ns3::NoOpComponentCarrierManager>::TransmitPdu (886,429 samples, 0.09%)
ns3::SbMeasResult_s::SbMeasResult_s (321,656 samples, 0.03%)
std::vector<double, std::allocator<double> >::vector (1,066,574 samples, 0.11%)
std::_Bind_helper<std::__or_<std::is_integral<std::decay<void (1,915,952 samples, 0.20%)
std::_Tuple_impl<2ul, double, ns3::Ptr<ns3::SpectrumSignalParameters>, ns3::Ptr<ns3::SpectrumPhy>, std::map<unsigned int, ns3::Ptr<ns3::SpectrumValue>, std::less<unsigned int>, std::allocator<std::pair<unsigned int const, ns3::Ptr<ns3::SpectrumValue> > > > >::_M_head (241,699 samples, 0.02%)
std::vector<unsigned short, std::allocator<unsigned short> >::_M_fill_insert (3,063,118 samples, 0.32%)
std::enable_if<is_invocable_r_v<void, ns3::Callback<void, std::__cxx11::list<ns3::Ptr<ns3::LteControlMessage>, std::allocator<ns3::Ptr<ns3::LteControlMessage> > > >::Callback<void (75,064,377 samples, 7.74%) std::e..
std::_Tuple_impl<1ul, unsigned int, unsigned int>::_M_head (151,872 samples, 0.02%)
void std::_Function_base::_Base_manager<std::_Bind<void (411,266 samples, 0.04%)
std::__cxx11::list<ns3::Ptr<ns3::LteControlMessage>, std::allocator<ns3::Ptr<ns3::LteControlMessage> > >::list<std::_List_const_iterator<ns3::Ptr<ns3::LteControlMessage> >, void> (214,595 samples, 0.02%)
ns3::LteEnbPhy::QueueUlDci (398,861 samples, 0.04%)
int& std::vector<int, std::allocator<int> >::emplace_back<int> (463,033 samples, 0.05%)
std::vector<int, std::allocator<int> >::vector (234,309 samples, 0.02%)
std::allocator_traits<std::allocator<int> >::allocate (152,677 samples, 0.02%)
ns3::Ptr<ns3::LteSpectrumSignalParametersDataFrame> ns3::Create<ns3::LteSpectrumSignalParametersDataFrame> (1,650,971 samples, 0.17%)
ns3::LteInterference::EndRx (324,769 samples, 0.03%)
double* std::__copy_move<false, true, std::random_access_iterator_tag>::__copy_m<double const, double> (242,020 samples, 0.02%)
ns3::ObjectDeleter::Delete (191,238 samples, 0.02%)
double* std::__copy_move_a2<false, double const*, double*> (326,485 samples, 0.03%)
operator new (249,753 samples, 0.03%)
ns3::SpectrumValue::Copy (3,250,861 samples, 0.34%)
std::_Rb_tree_iterator<std::pair<int const, double> > std::map<int, double, std::less<int>, std::allocator<std::pair<int const, double> > >::emplace_hint<std::pair<int, double> > (385,367 samples, 0.04%)
void std::_Destroy<ns3::FfMacSchedSapProvider::SchedUlCqiInfoReqParameters> (745,848 samples, 0.08%)
std::map<unsigned short, ns3::LteUePhy::UeMeasurementsElement, std::less<unsigned short>, std::allocator<std::pair<unsigned short const, ns3::LteUePhy::UeMeasurementsElement> > >::find (162,761 samples, 0.02%)
std::_Vector_base<ns3::VendorSpecificListElement_s, std::allocator<ns3::VendorSpecificListElement_s> >::_M_deallocate (157,246 samples, 0.02%)
__gnu_cxx::__aligned_membuf<std::pair<ns3::Scheduler::EventKey const, ns3::EventImpl*> >::_M_ptr (158,716 samples, 0.02%)
ns3::SpectrumValue::operator= (248,954 samples, 0.03%)
ns3::PacketBurst::~PacketBurst (776,679 samples, 0.08%)
decltype (564,633 samples, 0.06%)
int* std::copy<__gnu_cxx::__normal_iterator<int const*, std::vector<int, std::allocator<int> > >, int*> (627,364 samples, 0.06%)
ns3::HarqProcessInfoElement_t* std::__copy_move_a2<false, ns3::HarqProcessInfoElement_t const*, ns3::HarqProcessInfoElement_t*> (437,467 samples, 0.05%)
ns3::SpectrumValue::operator[] (524,698 samples, 0.05%)
ns3::TracedCallback<ns3::Ptr<ns3::PacketBurst const> >::operator (283,255 samples, 0.03%)
ns3::DlDciListElement_s::operator= (501,657 samples, 0.05%)
ns3::Vector3D::Vector3D (126,463 samples, 0.01%)
void std::_Destroy<ns3::Ptr<ns3::Object>*> (158,025 samples, 0.02%)
std::map<ns3::TbId_t, ns3::tbInfo_t, std::less<ns3::TbId_t>, std::allocator<std::pair<ns3::TbId_t const, ns3::tbInfo_t> > >::find (930,818 samples, 0.10%)
ns3::Ptr<ns3::LteHarqPhy>::operator (199,830 samples, 0.02%)
__gnu_cxx::__aligned_membuf<std::pair<unsigned short const, std::vector<double, std::allocator<double> > > >::_M_ptr (164,453 samples, 0.02%)
std::vector<int, std::allocator<int> >::vector (1,886,775 samples, 0.19%)
ns3::SimpleRefCount<ns3::Object, ns3::ObjectBase, ns3::ObjectDeleter>::~SimpleRefCount (491,149 samples, 0.05%)
std::vector<ns3::PacketMetadata::Data*, std::allocator<ns3::PacketMetadata::Data*> >::empty (561,769 samples, 0.06%)
[libc.so.6] (2,105,662 samples, 0.22%)
void (160,326 samples, 0.02%)
std::_Rb_tree<unsigned short, std::pair<unsigned short const, std::vector<unsigned short, std::allocator<unsigned short> > >, std::_Select1st<std::pair<unsigned short const, std::vector<unsigned short, std::allocator<unsigned short> > > >, std::less<unsigned short>, std::allocator<std::pair<unsigned short const, std::vector<unsigned short, std::allocator<unsigned short> > > > >::_M_end (236,415 samples, 0.02%)
ns3::Ptr<ns3::SpectrumSignalParameters>::operator (230,158 samples, 0.02%)
(200,105 samples, 0.02%)
std::_Rb_tree<unsigned short, std::pair<unsigned short const, unsigned int>, std::_Select1st<std::pair<unsigned short const, unsigned int> >, std::less<unsigned short>, std::allocator<std::pair<unsigned short const, unsigned int> > >::find (1,368,772 samples, 0.14%)
std::vector<double, std::allocator<double> >::vector (1,044,098 samples, 0.11%)
ns3::BuildDataListElement_s* std::__do_uninit_copy<__gnu_cxx::__normal_iterator<ns3::BuildDataListElement_s const*, std::vector<ns3::BuildDataListElement_s, std::allocator<ns3::BuildDataListElement_s> > >, ns3::BuildDataListElement_s*> (515,194 samples, 0.05%)
std::_Rb_tree<unsigned short, std::pair<unsigned short const, std::vector<unsigned char, std::allocator<unsigned char> > >, std::_Select1st<std::pair<unsigned short const, std::vector<unsigned char, std::allocator<unsigned char> > > >, std::less<unsigned short>, std::allocator<std::pair<unsigned short const, std::vector<unsigned char, std::allocator<unsigned char> > > > >::_S_key (411,593 samples, 0.04%)
ns3::DlInfoListElement_s::HarqStatus_e const* std::__niter_base<ns3::DlInfoListElement_s::HarqStatus_e const*, std::vector<ns3::DlInfoListElement_s::HarqStatus_e, std::allocator<ns3::DlInfoListElement_s::HarqStatus_e> > > (383,145 samples, 0.04%)
std::_Vector_base<unsigned short, std::allocator<unsigned short> >::_Vector_base (204,699 samples, 0.02%)
std::less<unsigned short>::operator (441,975 samples, 0.05%)
ns3::Ptr<ns3::SpectrumModel const>::Ptr (161,203 samples, 0.02%)
std::_Rb_tree<unsigned short, std::pair<unsigned short const, ns3::DlInfoListElement_s>, std::_Select1st<std::pair<unsigned short const, ns3::DlInfoListElement_s> >, std::less<unsigned short>, std::allocator<std::pair<unsigned short const, ns3::DlInfoListElement_s> > >::_M_erase (234,910 samples, 0.02%)
void std::allocator_traits<std::allocator<std::_List_node<ns3::Ptr<ns3::Packet> > > >::construct<ns3::Ptr<ns3::Packet>, ns3::Ptr<ns3::Packet> const&> (274,733 samples, 0.03%)
__gnu_cxx::__normal_iterator<ns3::VendorSpecificListElement_s*, std::vector<ns3::VendorSpecificListElement_s, std::allocator<ns3::VendorSpecificListElement_s> > > std::__niter_wrap<__gnu_cxx::__normal_iterator<ns3::VendorSpecificListElement_s*, std::vector<ns3::VendorSpecificListElement_s, std::allocator<ns3::VendorSpecificListElement_s> > >, ns3::VendorSpecificListElement_s*> (150,740 samples, 0.02%)
std::vector<std::__cxx11::list<ns3::UlDciLteControlMessage, std::allocator<ns3::UlDciLteControlMessage> >, std::allocator<std::__cxx11::list<ns3::UlDciLteControlMessage, std::allocator<ns3::UlDciLteControlMessage> > > >::erase (483,013 samples, 0.05%)
void std::vector<ns3::RlcPduListElement_s, std::allocator<ns3::RlcPduListElement_s> >::_M_realloc_insert<ns3::RlcPduListElement_s const&> (943,698 samples, 0.10%)
void std::__cxx11::list<ns3::Ptr<ns3::LteControlMessage>, std::allocator<ns3::Ptr<ns3::LteControlMessage> > >::_M_assign_dispatch<std::_List_const_iterator<ns3::Ptr<ns3::LteControlMessage> > > (804,377 samples, 0.08%)
ns3::SimpleRefCount<ns3::SpectrumValue, ns3::Empty, ns3::DefaultDeleter<ns3::SpectrumValue> >::Ref (201,883 samples, 0.02%)
std::__cxx11::list<ns3::Ptr<ns3::LteControlMessage>, std::allocator<ns3::Ptr<ns3::LteControlMessage> > >::~list (221,766 samples, 0.02%)
ns3::MakeEvent<void (8,388,558 samples, 0.87%)
malloc (195,774 samples, 0.02%)
ns3::EventImpl::EventImpl (513,449 samples, 0.05%)
ns3::Ptr<ns3::Packet>::Ptr (267,680 samples, 0.03%)
std::map<unsigned short, std::vector<std::vector<ns3::HarqProcessInfoElement_t, std::allocator<ns3::HarqProcessInfoElement_t> >, std::allocator<std::vector<ns3::HarqProcessInfoElement_t, std::allocator<ns3::HarqProcessInfoElement_t> > > >, std::less<unsigned short>, std::allocator<std::pair<unsigned short const, std::vector<std::vector<ns3::HarqProcessInfoElement_t, std::allocator<ns3::HarqProcessInfoElement_t> >, std::allocator<std::vector<ns3::HarqProcessInfoElement_t, std::allocator<ns3::HarqProcessInfoElement_t> > > > > > >::end (265,362 samples, 0.03%)
ns3::DefaultDeleter<ns3::SpectrumSignalParameters>::Delete (601,254 samples, 0.06%)
std::_List_node<ns3::Ptr<ns3::Packet> >* std::__cxx11::list<ns3::Ptr<ns3::Packet>, std::allocator<ns3::Ptr<ns3::Packet> > >::_M_create_node<ns3::Ptr<ns3::Packet> const&> (1,367,896 samples, 0.14%)
std::vector<bool, std::allocator<bool> >::_M_fill_insert (533,523 samples, 0.06%)
std::_Rb_tree<unsigned int, std::pair<unsigned int const, ns3::Ptr<ns3::SpectrumValue> >, std::_Select1st<std::pair<unsigned int const, ns3::Ptr<ns3::SpectrumValue> > >, std::less<unsigned int>, std::allocator<std::pair<unsigned int const, ns3::Ptr<ns3::SpectrumValue> > > >::_M_copy (158,119 samples, 0.02%)
ns3::SpectrumSignalParameters::SpectrumSignalParameters (821,477 samples, 0.08%)
ns3::Ptr<ns3::AntennaModel> ns3::DynamicCast<ns3::AntennaModel, ns3::Object> (814,268 samples, 0.08%)
ns3::SimpleRefCount<ns3::Packet, ns3::Empty, ns3::DefaultDeleter<ns3::Packet> >::Unref (4,472,125 samples, 0.46%)
ns3::LteInterference*& std::__get_helper<0ul, ns3::LteInterference*, ns3::Ptr<ns3::SpectrumValue const>, unsigned int> (491,189 samples, 0.05%)
ns3::Ptr<ns3::Packet> ns3::Create<ns3::Packet, unsigned int&> (229,600 samples, 0.02%)
std::_Rb_tree_insert_and_rebalance (153,387 samples, 0.02%)
std::_Tuple_impl<4ul, ns3::Ptr<ns3::SpectrumPhy>, std::map<unsigned int, ns3::Ptr<ns3::SpectrumValue>, std::less<unsigned int>, std::allocator<std::pair<unsigned int const, ns3::Ptr<ns3::SpectrumValue> > > > >::~_Tuple_impl (258,906 samples, 0.03%)
std::_Vector_base<ns3::HigherLayerSelected_s, std::allocator<ns3::HigherLayerSelected_s> >::_Vector_impl::_Vector_impl (227,726 samples, 0.02%)
decltype (194,069 samples, 0.02%)
std::vector<unsigned short, std::allocator<unsigned short> >::at (127,693 samples, 0.01%)
ns3::LteUePhy* ns3::PeekPointer<ns3::LteUePhy> (477,176 samples, 0.05%)
decltype (323,441 samples, 0.03%)
ns3::Ptr<ns3::Packet>::operator (367,419 samples, 0.04%)
void std::allocator_traits<std::allocator<std::_List_node<ns3::Ptr<ns3::LteControlMessage> > > >::construct<ns3::Ptr<ns3::LteControlMessage>, ns3::Ptr<ns3::LteControlMessage> const&> (266,180 samples, 0.03%)
ns3::SpectrumValue::Add (367,754 samples, 0.04%)
[ld-linux-x86-64.so.2] (147,352 samples, 0.02%)
std::enable_if<std::is_constructible<std::pair<ns3::Scheduler::EventKey const, ns3::EventImpl*>, std::pair<ns3::Scheduler::EventKey, ns3::EventImpl*> >::value, std::pair<std::_Rb_tree_iterator<std::pair<ns3::Scheduler::EventKey const, ns3::EventImpl*> >, bool> >::type std::map<ns3::Scheduler::EventKey, ns3::EventImpl*, std::less<ns3::Scheduler::EventKey>, std::allocator<std::pair<ns3::Scheduler::EventKey const, ns3::EventImpl*> > >::insert<std::pair<ns3::Scheduler::EventKey, ns3::EventImpl*> > (4,750,006 samples, 0.49%)
ns3::tbInfo_t::~tbInfo_t (865,871 samples, 0.09%)
std::_Rb_tree<unsigned char, std::pair<unsigned char const, ns3::LteUeMac::LcInfo>, std::_Select1st<std::pair<unsigned char const, ns3::LteUeMac::LcInfo> >, std::less<unsigned char>, std::allocator<std::pair<unsigned char const, ns3::LteUeMac::LcInfo> > >::end (200,190 samples, 0.02%)
ns3::Ptr<ns3::SpectrumChannel>::operator (153,603 samples, 0.02%)
bool __gnu_cxx::operator==<double*, std::vector<double, std::allocator<double> > > (361,717 samples, 0.04%)
std::vector<ns3::Ptr<ns3::Object>, std::allocator<ns3::Ptr<ns3::Object> > >::~vector (893,699 samples, 0.09%)
std::vector<ns3::FfMacSchedSapProvider::SchedUlCqiInfoReqParameters, std::allocator<ns3::FfMacSchedSapProvider::SchedUlCqiInfoReqParameters> >::at (476,232 samples, 0.05%)
std::vector<double, std::allocator<double> >::end (165,055 samples, 0.02%)
malloc (165,510 samples, 0.02%)
std::_Rb_tree_iterator<std::pair<unsigned char const, ns3::LteMacSapProvider*> >::operator (167,770 samples, 0.02%)
std::_List_const_iterator<ns3::Callback<void, unsigned short, unsigned char, unsigned int> >::_List_const_iterator (127,995 samples, 0.01%)
std::pair<unsigned int const, ns3::Ptr<ns3::SpectrumValue> >::pair<unsigned int const&, ns3::Ptr<ns3::SpectrumValue>&> (151,208 samples, 0.02%)
void std::_Destroy<unsigned char*> (237,950 samples, 0.02%)
std::__cxx11::_List_base<ns3::Ptr<ns3::LteControlMessage>, std::allocator<ns3::Ptr<ns3::LteControlMessage> > >::_M_move_nodes (452,596 samples, 0.05%)
std::vector<unsigned short, std::allocator<unsigned short> >::operator= (528,635 samples, 0.05%)
ns3::MemberSchedSapProvider<ns3::PfFfMacScheduler>::SchedDlTriggerReq (415,834 samples, 0.04%)
std::vector<signed char, std::allocator<signed char> >::at (282,384 samples, 0.03%)
std::__cxx11::_List_base<ns3::UlDciLteControlMessage, std::allocator<ns3::UlDciLteControlMessage> >::_M_clear (1,220,101 samples, 0.13%)
std::allocator_traits<std::allocator<unsigned char> >::allocate (157,055 samples, 0.02%)
void std::destroy_at<std::__cxx11::list<ns3::UlDciLteControlMessage, std::allocator<ns3::UlDciLteControlMessage> > > (234,294 samples, 0.02%)
void std::__invoke_impl<void, ns3::Callback<void, std::__cxx11::list<ns3::Ptr<ns3::LteControlMessage>, std::allocator<ns3::Ptr<ns3::LteControlMessage> > > >::Callback<void (74,776,631 samples, 7.71%) void s..
__gnu_cxx::__aligned_membuf<ns3::Ptr<ns3::Packet> >::_M_ptr (229,970 samples, 0.02%)
std::vector<bool, std::allocator<bool> >::operator= (188,428 samples, 0.02%)
void std::__cxx11::list<ns3::Ptr<ns3::LteControlMessage>, std::allocator<ns3::Ptr<ns3::LteControlMessage> > >::_M_insert<ns3::Ptr<ns3::LteControlMessage> const&> (271,484 samples, 0.03%)
std::vector<ns3::RachListElement_s, std::allocator<ns3::RachListElement_s> >::clear (195,412 samples, 0.02%)
__gnu_cxx::__normal_iterator<double*, std::vector<double, std::allocator<double> > > std::__copy_move_a<false, __gnu_cxx::__normal_iterator<double const*, std::vector<double, std::allocator<double> > >, __gnu_cxx::__normal_iterator<double*, std::vector<double, std::allocator<double> > > > (474,207 samples, 0.05%)
std::vector<std::vector<ns3::RlcPduListElement_s, std::allocator<ns3::RlcPduListElement_s> >, std::allocator<std::vector<ns3::RlcPduListElement_s, std::allocator<ns3::RlcPduListElement_s> > > >::~vector (456,474 samples, 0.05%)
std::__detail::_List_node_header::_List_node_header (190,276 samples, 0.02%)
std::_Rb_tree<unsigned short, std::pair<unsigned short const, unsigned int>, std::_Select1st<std::pair<unsigned short const, unsigned int> >, std::less<unsigned short>, std::allocator<std::pair<unsigned short const, unsigned int> > >::find (201,734 samples, 0.02%)
std::map<unsigned short, std::vector<ns3::UlDciListElement_s, std::allocator<ns3::UlDciListElement_s> >, std::less<unsigned short>, std::allocator<std::pair<unsigned short const, std::vector<ns3::UlDciListElement_s, std::allocator<ns3::UlDciListElement_s> > > > >::find (1,193,975 samples, 0.12%)
std::_Tuple_impl<0ul, ns3::MultiModelSpectrumChannel*, ns3::Ptr<ns3::SpectrumValue>, double, ns3::Ptr<ns3::SpectrumSignalParameters>, ns3::Ptr<ns3::SpectrumPhy>, std::map<unsigned int, ns3::Ptr<ns3::SpectrumValue>, std::less<unsigned int>, std::allocator<std::pair<unsigned int const, ns3::Ptr<ns3::SpectrumValue> > > > >::~_Tuple_impl (361,973 samples, 0.04%)
ns3::MemberLteFfrSapProvider<ns3::LteFrNoOpAlgorithm>::GetAvailableUlRbg (157,176 samples, 0.02%)
std::vector<unsigned char, std::allocator<unsigned char> >::_S_relocate (197,721 samples, 0.02%)
[libm.so.6] (198,109 samples, 0.02%)
[libc.so.6] (276,224 samples, 0.03%)
std::less<unsigned short>::operator (274,669 samples, 0.03%)
ns3::MacCeValue_u::~MacCeValue_u (162,616 samples, 0.02%)
std::_Rb_tree<unsigned short, std::pair<unsigned short const, std::vector<unsigned short, std::allocator<unsigned short> > >, std::_Select1st<std::pair<unsigned short const, std::vector<unsigned short, std::allocator<unsigned short> > > >, std::less<unsigned short>, std::allocator<std::pair<unsigned short const, std::vector<unsigned short, std::allocator<unsigned short> > > > >::_Auto_node::_Auto_node<std::piecewise_construct_t const&, std::tuple<unsigned short const&>, std::tuple<> > (993,807 samples, 0.10%)
ns3::Ptr<ns3::SpectrumPhy>::operator bool (176,535 samples, 0.02%)
std::_Rb_tree<unsigned int, std::pair<unsigned int const, ns3::RxSpectrumModelInfo>, std::_Select1st<std::pair<unsigned int const, ns3::RxSpectrumModelInfo> >, std::less<unsigned int>, std::allocator<std::pair<unsigned int const, ns3::RxSpectrumModelInfo> > >::begin (243,486 samples, 0.03%)
std::function<void (796,462 samples, 0.08%)
int* std::__relocate_a<int*, int*, std::allocator<int> > (192,628 samples, 0.02%)
std::_Bvector_base<std::allocator<bool> >::_Bvector_impl_data::_Bvector_impl_data (154,936 samples, 0.02%)
ns3::PacketBurst::~PacketBurst (815,660 samples, 0.08%)
std::function<void (22,443,594 samples, 2.31%)
__gnu_cxx::__normal_iterator<std::__cxx11::list<ns3::Ptr<ns3::LteControlMessage>, std::allocator<ns3::Ptr<ns3::LteControlMessage> > > const*, std::vector<std::__cxx11::list<ns3::Ptr<ns3::LteControlMessage>, std::allocator<ns3::Ptr<ns3::LteControlMessage> > >, std::allocator<std::__cxx11::list<ns3::Ptr<ns3::LteControlMessage>, std::allocator<ns3::Ptr<ns3::LteControlMessage> > > > > >::difference_type __gnu_cxx::operator-<std::__cxx11::list<ns3::Ptr<ns3::LteControlMessage>, std::allocator<ns3::Ptr<ns3::LteControlMessage> > > const*, std::vector<std::__cxx11::list<ns3::Ptr<ns3::LteControlMessage>, std::allocator<ns3::Ptr<ns3::LteControlMessage> > >, std::allocator<std::__cxx11::list<ns3::Ptr<ns3::LteControlMessage>, std::allocator<ns3::Ptr<ns3::LteControlMessage> > > > > > (150,492 samples, 0.02%)
std::vector<ns3::DlInfoListElement_s::HarqStatus_e, std::allocator<ns3::DlInfoListElement_s::HarqStatus_e> >::vector (1,764,689 samples, 0.18%)
void std::destroy_at<ns3::Ptr<ns3::Packet> > (2,842,730 samples, 0.29%)
ns3::Ptr<ns3::SpectrumValue> ns3::Copy<ns3::SpectrumValue> (1,504,235 samples, 0.16%)
ns3::TracedCallback<unsigned short, unsigned short, double, double, unsigned char>::operator (698,650 samples, 0.07%)
ns3::Ptr<ns3::SpectrumSignalParameters>::Acquire (357,119 samples, 0.04%)
std::this_thread::get_id (258,683 samples, 0.03%)
std::_List_node<ns3::Ptr<ns3::LteControlMessage> >* std::__cxx11::list<ns3::Ptr<ns3::LteControlMessage>, std::allocator<ns3::Ptr<ns3::LteControlMessage> > >::_M_create_node<ns3::Ptr<ns3::LteControlMessage> const&> (441,158 samples, 0.05%)
unsigned int const& std::max<unsigned int> (164,916 samples, 0.02%)
std::_Rb_tree<ns3::Scheduler::EventKey, std::pair<ns3::Scheduler::EventKey const, ns3::EventImpl*>, std::_Select1st<std::pair<ns3::Scheduler::EventKey const, ns3::EventImpl*> >, std::less<ns3::Scheduler::EventKey>, std::allocator<std::pair<ns3::Scheduler::EventKey const, ns3::EventImpl*> > >::_M_drop_node (2,330,463 samples, 0.24%)
std::_Rb_tree<ns3::Scheduler::EventKey, std::pair<ns3::Scheduler::EventKey const, ns3::EventImpl*>, std::_Select1st<std::pair<ns3::Scheduler::EventKey const, ns3::EventImpl*> >, std::less<ns3::Scheduler::EventKey>, std::allocator<std::pair<ns3::Scheduler::EventKey const, ns3::EventImpl*> > >::_Auto_node::_M_insert (278,782 samples, 0.03%)
std::vector<std::vector<int, std::allocator<int> >, std::allocator<std::vector<int, std::allocator<int> > > >::operator[] (205,431 samples, 0.02%)
std::vector<ns3::HigherLayerSelected_s, std::allocator<ns3::HigherLayerSelected_s> >::end (204,400 samples, 0.02%)
ns3::UlInfoListElement_s* std::__uninitialized_copy_a<__gnu_cxx::__normal_iterator<ns3::UlInfoListElement_s const*, std::vector<ns3::UlInfoListElement_s, std::allocator<ns3::UlInfoListElement_s> > >, ns3::UlInfoListElement_s*, ns3::UlInfoListElement_s> (872,914 samples, 0.09%)
std::_Rb_tree<unsigned int, std::pair<unsigned int const, ns3::TxSpectrumModelInfo>, std::_Select1st<std::pair<unsigned int const, ns3::TxSpectrumModelInfo> >, std::less<unsigned int>, std::allocator<std::pair<unsigned int const, ns3::TxSpectrumModelInfo> > >::_S_left (226,586 samples, 0.02%)
ns3::Angles::Angles (1,751,854 samples, 0.18%)
ns3::EnbMacMemberLteMacSapProvider<ns3::NoOpComponentCarrierManager>::TransmitPdu (549,181 samples, 0.06%)
std::__cxx11::_List_base<ns3::Ptr<ns3::LteControlMessage>, std::allocator<ns3::Ptr<ns3::LteControlMessage> > >::~_List_base (221,766 samples, 0.02%)
void std::_Destroy<unsigned char*> (220,248 samples, 0.02%)
ns3::UeSelected_s::~UeSelected_s (190,389 samples, 0.02%)
int* std::copy<int*, int*> (195,561 samples, 0.02%)
double* std::__copy_move_a1<false, double const*, double*> (447,358 samples, 0.05%)
ns3::LteUePhy::ReportDataInterference (740,140 samples, 0.08%)
std::_Bit_iterator std::__copy_move_a<false, std::_Bit_const_iterator, std::_Bit_iterator> (454,947 samples, 0.05%)
ns3::DlCqiLteControlMessage::~DlCqiLteControlMessage (159,078 samples, 0.02%)
ns3::Packet::Packet (5,056,417 samples, 0.52%)
std::vector<ns3::RlcPduListElement_s, std::allocator<ns3::RlcPduListElement_s> >::at (156,958 samples, 0.02%)
ns3::Now (627,315 samples, 0.06%)
std::_Rb_tree_iterator<std::pair<ns3::Scheduler::EventKey const, ns3::EventImpl*> >::_Rb_tree_iterator (125,563 samples, 0.01%)
operator new (277,002 samples, 0.03%)
unsigned short& std::vector<unsigned short, std::allocator<unsigned short> >::emplace_back<unsigned short> (2,449,232 samples, 0.25%)
std::vector<ns3::Ptr<ns3::Object>, std::allocator<ns3::Ptr<ns3::Object> > >::~vector (234,790 samples, 0.02%)
ns3::PacketTagList::~PacketTagList (155,483 samples, 0.02%)
std::__cxx11::_List_base<ns3::Ptr<ns3::Packet>, std::allocator<ns3::Ptr<ns3::Packet> > >::_M_get_node (475,198 samples, 0.05%)
std::vector<ns3::DlInfoListElement_s::HarqStatus_e, std::allocator<ns3::DlInfoListElement_s::HarqStatus_e> >::_M_range_check (156,928 samples, 0.02%)
ns3::SpectrumValue::Add (1,307,991 samples, 0.13%)
__gnu_cxx::__normal_iterator<double*, std::vector<double, std::allocator<double> > >::__normal_iterator (160,055 samples, 0.02%)
std::vector<double, std::allocator<double> >::begin (339,771 samples, 0.04%)
std::_Tuple_impl<2ul, unsigned int>::_M_head (356,195 samples, 0.04%)
ns3::Ptr<ns3::LteControlMessage>& std::__cxx11::list<ns3::Ptr<ns3::LteControlMessage>, std::allocator<ns3::Ptr<ns3::LteControlMessage> > >::emplace_back<ns3::Ptr<ns3::LteControlMessage> const&> (154,939 samples, 0.02%)
(356,060 samples, 0.04%)
std::_Vector_base<unsigned char, std::allocator<unsigned char> >::_M_allocate (158,373 samples, 0.02%)
std::vector<ns3::DlInfoListElement_s, std::allocator<ns3::DlInfoListElement_s> >::at (386,249 samples, 0.04%)
ns3::Ptr<ns3::SpectrumModel const>::Ptr<ns3::SpectrumModel> (168,069 samples, 0.02%)
std::_Rb_tree_node_base::_S_minimum (352,600 samples, 0.04%)
double* std::__copy_move_a1<false, double const*, double*> (238,145 samples, 0.02%)
std::_Rb_tree<unsigned int, std::pair<unsigned int const, ns3::Ptr<ns3::SpectrumValue> >, std::_Select1st<std::pair<unsigned int const, ns3::Ptr<ns3::SpectrumValue> > >, std::less<unsigned int>, std::allocator<std::pair<unsigned int const, ns3::Ptr<ns3::SpectrumValue> > > >::_Rb_tree (326,142 samples, 0.03%)
std::_Rb_tree<ns3::Scheduler::EventKey, std::pair<ns3::Scheduler::EventKey const, ns3::EventImpl*>, std::_Select1st<std::pair<ns3::Scheduler::EventKey const, ns3::EventImpl*> >, std::less<ns3::Scheduler::EventKey>, std::allocator<std::pair<ns3::Scheduler::EventKey const, ns3::EventImpl*> > >::_M_erase_aux (5,384,995 samples, 0.56%)
ns3::Ptr<ns3::NodeListPriv>::operator= (238,924 samples, 0.02%)
std::vector<ns3::VendorSpecificListElement_s, std::allocator<ns3::VendorSpecificListElement_s> >::vector (237,492 samples, 0.02%)
std::_Rb_tree<ns3::TbId_t, std::pair<ns3::TbId_t const, ns3::tbInfo_t>, std::_Select1st<std::pair<ns3::TbId_t const, ns3::tbInfo_t> >, std::less<ns3::TbId_t>, std::allocator<std::pair<ns3::TbId_t const, ns3::tbInfo_t> > >::_M_lower_bound (314,909 samples, 0.03%)
std::_Rb_tree<unsigned short, std::pair<unsigned short const, double>, std::_Select1st<std::pair<unsigned short const, double> >, std::less<unsigned short>, std::allocator<std::pair<unsigned short const, double> > >::_M_begin (263,024 samples, 0.03%)
ns3::DefaultSimulatorImpl::Schedule (1,350,821 samples, 0.14%)
std::vector<ns3::CqiListElement_s, std::allocator<ns3::CqiListElement_s> >::end (162,948 samples, 0.02%)
void std::allocator_traits<std::allocator<std::_Rb_tree_node<std::pair<unsigned short const, std::vector<unsigned short, std::allocator<unsigned short> > > > > >::destroy<std::pair<unsigned short const, std::vector<unsigned short, std::allocator<unsigned short> > > > (266,588 samples, 0.03%)
std::_Rb_tree<unsigned short, unsigned short, std::_Identity<unsigned short>, std::less<unsigned short>, std::allocator<unsigned short> >::find (148,308 samples, 0.02%)
std::_List_node<ns3::Ptr<ns3::Packet> >::_M_valptr (431,355 samples, 0.04%)
ns3::Ptr<ns3::MobilityModel>::Ptr (284,534 samples, 0.03%)
std::__cxx11::list<ns3::Ptr<ns3::Packet>, std::allocator<ns3::Ptr<ns3::Packet> > >::end (161,021 samples, 0.02%)
std::allocator_traits<std::allocator<unsigned int> >::deallocate (227,074 samples, 0.02%)
unsigned char* std::vector<unsigned char, std::allocator<unsigned char> >::_M_allocate_and_copy<__gnu_cxx::__normal_iterator<unsigned char const*, std::vector<unsigned char, std::allocator<unsigned char> > > > (698,551 samples, 0.07%)
std::_Tuple_impl<2ul, double, ns3::Ptr<ns3::SpectrumSignalParameters>, ns3::Ptr<ns3::SpectrumPhy>, std::map<unsigned int, ns3::Ptr<ns3::SpectrumValue>, std::less<unsigned int>, std::allocator<std::pair<unsigned int const, ns3::Ptr<ns3::SpectrumValue> > > > >::_Tuple_impl (326,828 samples, 0.03%)
std::_Rb_tree<unsigned int, std::pair<unsigned int const, ns3::Ptr<ns3::SpectrumValue> >, std::_Select1st<std::pair<unsigned int const, ns3::Ptr<ns3::SpectrumValue> > >, std::less<unsigned int>, std::allocator<std::pair<unsigned int const, ns3::Ptr<ns3::SpectrumValue> > > >::_M_drop_node (197,031 samples, 0.02%)
void std::_Function_base::_Base_manager<std::_Bind<void (489,748 samples, 0.05%)
ns3::Packet::AddByteTag (307,844 samples, 0.03%)
ns3::SimpleRefCount<ns3::SpectrumSignalParameters, ns3::Empty, ns3::DefaultDeleter<ns3::SpectrumSignalParameters> >::Unref (155,066 samples, 0.02%)
std::pair<std::_Rb_tree_iterator<std::pair<unsigned int const, ns3::Ptr<ns3::SpectrumValue> > >, bool> std::map<unsigned int, ns3::Ptr<ns3::SpectrumValue>, std::less<unsigned int>, std::allocator<std::pair<unsigned int const, ns3::Ptr<ns3::SpectrumValue> > > >::emplace<unsigned int const&, ns3::Ptr<ns3::SpectrumValue>&> (157,520 samples, 0.02%)
std::_Rb_tree<unsigned short, std::pair<unsigned short const, ns3::SbMeasResult_s>, std::_Select1st<std::pair<unsigned short const, ns3::SbMeasResult_s> >, std::less<unsigned short>, std::allocator<std::pair<unsigned short const, ns3::SbMeasResult_s> > >::find (452,741 samples, 0.05%)
ns3::Ptr<ns3::SpectrumValue> ns3::Copy<ns3::SpectrumValue> (759,296 samples, 0.08%)
std::_Vector_base<ns3::VendorSpecificListElement_s, std::allocator<ns3::VendorSpecificListElement_s> >::_Vector_base (571,217 samples, 0.06%)
std::_List_const_iterator<ns3::Ptr<ns3::Packet> >::operator* (243,270 samples, 0.03%)
__gnu_cxx::__normal_iterator<int*, std::vector<int, std::allocator<int> > > std::copy<__gnu_cxx::__normal_iterator<int const*, std::vector<int, std::allocator<int> > >, __gnu_cxx::__normal_iterator<int*, std::vector<int, std::allocator<int> > > > (248,988 samples, 0.03%)
std::_Vector_base<int, std::allocator<int> >::_Vector_base (330,983 samples, 0.03%)
ns3::EventImpl::Invoke (238,924 samples, 0.02%)
std::vector<ns3::RlcPduListElement_s, std::allocator<ns3::RlcPduListElement_s> >* std::__uninitialized_copy<false>::__uninit_copy<__gnu_cxx::__normal_iterator<std::vector<ns3::RlcPduListElement_s, std::allocator<ns3::RlcPduListElement_s> > const*, std::vector<std::vector<ns3::RlcPduListElement_s, std::allocator<ns3::RlcPduListElement_s> >, std::allocator<std::vector<ns3::RlcPduListElement_s, std::allocator<ns3::RlcPduListElement_s> > > > >, std::vector<ns3::RlcPduListElement_s, std::allocator<ns3::RlcPduListElement_s> >*> (338,383 samples, 0.03%)
[libm.so.6] (158,134 samples, 0.02%)
ns3::BuildDataListElement_s* std::__uninitialized_copy<false>::__uninit_copy<__gnu_cxx::__normal_iterator<ns3::BuildDataListElement_s const*, std::vector<ns3::BuildDataListElement_s, std::allocator<ns3::BuildDataListElement_s> > >, ns3::BuildDataListElement_s*> (515,194 samples, 0.05%)
std::_Rb_tree<unsigned short, std::pair<unsigned short const, std::vector<double, std::allocator<double> > >, std::_Select1st<std::pair<unsigned short const, std::vector<double, std::allocator<double> > > >, std::less<unsigned short>, std::allocator<std::pair<unsigned short const, std::vector<double, std::allocator<double> > > > >::_M_drop_node (669,961 samples, 0.07%)
ns3::ObjectDeleter::Delete (4,998,634 samples, 0.52%)
ns3::MacCeListElement_s::operator= (1,023,273 samples, 0.11%)
std::_Vector_base<ns3::BuildBroadcastListElement_s, std::allocator<ns3::BuildBroadcastListElement_s> >::~_Vector_base (193,710 samples, 0.02%)
std::_Rb_tree<int, std::pair<int const, double>, std::_Select1st<std::pair<int const, double> >, std::less<int>, std::allocator<std::pair<int const, double> > >::_S_maximum (160,901 samples, 0.02%)
std::_Rb_tree<unsigned short, std::pair<unsigned short const, std::map<unsigned char, ns3::LteMacSapUser*, std::less<unsigned char>, std::allocator<std::pair<unsigned char const, ns3::LteMacSapUser*> > > >, std::_Select1st<std::pair<unsigned short const, std::map<unsigned char, ns3::LteMacSapUser*, std::less<unsigned char>, std::allocator<std::pair<unsigned char const, ns3::LteMacSapUser*> > > > >, std::less<unsigned short>, std::allocator<std::pair<unsigned short const, std::map<unsigned char, ns3::LteMacSapUser*, std::less<unsigned char>, std::allocator<std::pair<unsigned char const, ns3::LteMacSapUser*> > > > > >::_M_end (157,738 samples, 0.02%)
ns3::NoOpComponentCarrierManager::DoNotifyTxOpportunity (10,110,654 samples, 1.04%)
ns3::TracedCallback<unsigned short, unsigned short, double>::operator (430,115 samples, 0.04%)
ns3::Ptr<ns3::SpectrumValue> ns3::Create<ns3::SpectrumValue, ns3::Ptr<ns3::SpectrumModel const> > (3,855,019 samples, 0.40%)
ns3::LteEnbMac::DoSchedDlConfigInd (2,983,151 samples, 0.31%)
std::enable_if<std::is_constructible<std::pair<int const, double>, std::pair<int, double> >::value, std::pair<std::_Rb_tree_iterator<std::pair<int const, double> >, bool> >::type std::map<int, double, std::less<int>, std::allocator<std::pair<int const, double> > >::insert<std::pair<int, double> > (574,148 samples, 0.06%)
ns3::LtePhy::SetControlMessages (378,472 samples, 0.04%)
ns3::Ptr<ns3::PacketBurst>::Ptr (157,831 samples, 0.02%)
ns3::SbMeasResult_s::~SbMeasResult_s (859,795 samples, 0.09%)
ns3::EnbMacMemberLteMacSapProvider<ns3::NoOpComponentCarrierManager>::TransmitPdu (1,327,529 samples, 0.14%)
std::_Bind_helper<std::__or_<std::is_integral<std::decay<void (661,742 samples, 0.07%)
std::_Bind_helper<std::__or_<std::is_integral<std::decay<void (1,023,427 samples, 0.11%)
std::_Rb_tree<unsigned short, std::pair<unsigned short const, ns3::SbMeasResult_s>, std::_Select1st<std::pair<unsigned short const, ns3::SbMeasResult_s> >, std::less<unsigned short>, std::allocator<std::pair<unsigned short const, ns3::SbMeasResult_s> > >::_M_lower_bound (559,810 samples, 0.06%)
std::__new_allocator<std::_List_node<ns3::Ptr<ns3::PacketBurst> > >::deallocate (158,232 samples, 0.02%)
int const* std::__niter_base<int const*, std::vector<int, std::allocator<int> > > (127,383 samples, 0.01%)
std::_Rb_tree<ns3::Scheduler::EventKey, std::pair<ns3::Scheduler::EventKey const, ns3::EventImpl*>, std::_Select1st<std::pair<ns3::Scheduler::EventKey const, ns3::EventImpl*> >, std::less<ns3::Scheduler::EventKey>, std::allocator<std::pair<ns3::Scheduler::EventKey const, ns3::EventImpl*> > >::_S_key (163,045 samples, 0.02%)
ns3::Callback<void, ns3::SpectrumValue const&>::DoPeekImpl (161,766 samples, 0.02%)
std::vector<ns3::DlInfoListElement_s, std::allocator<ns3::DlInfoListElement_s> >::empty (825,740 samples, 0.09%)
ns3::Object::Object (305,763 samples, 0.03%)
__log10_finite (314,933 samples, 0.03%)
ns3::IsotropicAntennaModel::GetGainDb (306,931 samples, 0.03%)
ns3::CqiListElement_s* std::__uninitialized_copy_a<__gnu_cxx::__normal_iterator<ns3::CqiListElement_s*, std::vector<ns3::CqiListElement_s, std::allocator<ns3::CqiListElement_s> > >, ns3::CqiListElement_s*, ns3::CqiListElement_s> (3,635,299 samples, 0.37%)
ns3::SpectrumValue::SpectrumValue (1,413,703 samples, 0.15%)
ns3::PacketMetadata::PacketMetadata (584,751 samples, 0.06%)
ns3::Ptr<ns3::SpectrumModel const>::operator (160,403 samples, 0.02%)
ns3::AttributeConstructionList::AttributeConstructionList (757,136 samples, 0.08%)
std::vector<ns3::DlInfoListElement_s::HarqStatus_e, std::allocator<ns3::DlInfoListElement_s::HarqStatus_e> >::at (156,928 samples, 0.02%)
void std::_Function_base::_Base_manager<std::_Bind<void (414,048 samples, 0.04%)
std::_Rb_tree<unsigned int, std::pair<unsigned int const, ns3::Ptr<ns3::SpectrumValue> >, std::_Select1st<std::pair<unsigned int const, ns3::Ptr<ns3::SpectrumValue> > >, std::less<unsigned int>, std::allocator<std::pair<unsigned int const, ns3::Ptr<ns3::SpectrumValue> > > >::_Auto_node::_Auto_node<unsigned int const&, ns3::Ptr<ns3::SpectrumValue>&> (420,658 samples, 0.04%)
ns3::Time::~Time (269,802 samples, 0.03%)
ns3::SimpleRefCount<ns3::EventImpl, ns3::Empty, ns3::DefaultDeleter<ns3::EventImpl> >::Unref (240,387 samples, 0.02%)
decltype (252,039 samples, 0.03%)
ns3::LteEnbPhy::GenerateDataCqiReport (10,863,791 samples, 1.12%)
std::pair<ns3::Scheduler::EventKey, ns3::EventImpl*>::pair (349,723 samples, 0.04%)
std::_Rb_tree<unsigned char, std::pair<unsigned char const, ns3::LteMacSapUser*>, std::_Select1st<std::pair<unsigned char const, ns3::LteMacSapUser*> >, std::less<unsigned char>, std::allocator<std::pair<unsigned char const, ns3::LteMacSapUser*> > >::find (1,293,049 samples, 0.13%)
double* std::copy<__gnu_cxx::__normal_iterator<double const*, std::vector<double, std::allocator<double> > >, double*> (303,198 samples, 0.03%)
std::_Rb_tree<unsigned int, std::pair<unsigned int const, ns3::Ptr<ns3::SpectrumValue> >, std::_Select1st<std::pair<unsigned int const, ns3::Ptr<ns3::SpectrumValue> > >, std::less<unsigned int>, std::allocator<std::pair<unsigned int const, ns3::Ptr<ns3::SpectrumValue> > > >::_S_key (154,486 samples, 0.02%)
ns3::SpectrumValue::~SpectrumValue (447,563 samples, 0.05%)
__gnu_cxx::__normal_iterator<std::__cxx11::list<ns3::Ptr<ns3::LteControlMessage>, std::allocator<ns3::Ptr<ns3::LteControlMessage> > > const*, std::vector<std::__cxx11::list<ns3::Ptr<ns3::LteControlMessage>, std::allocator<ns3::Ptr<ns3::LteControlMessage> > >, std::allocator<std::__cxx11::list<ns3::Ptr<ns3::LteControlMessage>, std::allocator<ns3::Ptr<ns3::LteControlMessage> > > > > >::base (148,134 samples, 0.02%)
std::_Rb_tree<unsigned int, std::pair<unsigned int const, ns3::Ptr<ns3::SpectrumValue> >, std::_Select1st<std::pair<unsigned int const, ns3::Ptr<ns3::SpectrumValue> > >, std::less<unsigned int>, std::allocator<std::pair<unsigned int const, ns3::Ptr<ns3::SpectrumValue> > > >::_M_erase (270,414 samples, 0.03%)
__gnu_cxx::__normal_iterator<std::__cxx11::list<ns3::Ptr<ns3::LteControlMessage>, std::allocator<ns3::Ptr<ns3::LteControlMessage> > > const*, std::vector<std::__cxx11::list<ns3::Ptr<ns3::LteControlMessage>, std::allocator<ns3::Ptr<ns3::LteControlMessage> > >, std::allocator<std::__cxx11::list<ns3::Ptr<ns3::LteControlMessage>, std::allocator<ns3::Ptr<ns3::LteControlMessage> > > > > >::__normal_iterator<std::__cxx11::list<ns3::Ptr<ns3::LteControlMessage>, std::allocator<ns3::Ptr<ns3::LteControlMessage> > >*, void> (228,797 samples, 0.02%)
std::map<unsigned int, ns3::Ptr<ns3::SpectrumValue>, std::less<unsigned int>, std::allocator<std::pair<unsigned int const, ns3::Ptr<ns3::SpectrumValue> > > >::lower_bound (238,325 samples, 0.02%)
std::_Function_handler<void (891,010,862 samples, 91.88%) std::_Function_handler<void
std::_Function_handler<void (194,457 samples, 0.02%)
std::tuple<ns3::LteSpectrumPhy*>::tuple<ns3::LteSpectrumPhy*&, true, true> (451,930 samples, 0.05%)
std::allocator_traits<std::allocator<std::_List_node<ns3::Ptr<ns3::LteControlMessage> > > >::allocate (124,601 samples, 0.01%)
std::vector<ns3::VendorSpecificListElement_s, std::allocator<ns3::VendorSpecificListElement_s> >::~vector (447,401 samples, 0.05%)
std::vector<ns3::ByteTagListData*, std::allocator<ns3::ByteTagListData*> >::back (538,428 samples, 0.06%)
ns3::Ptr<ns3::EventImpl>::Acquire (243,600 samples, 0.03%)
ns3::LteSpectrumSignalParametersDlCtrlFrame::~LteSpectrumSignalParametersDlCtrlFrame (493,631 samples, 0.05%)
double* std::__copy_move<false, true, std::random_access_iterator_tag>::__copy_m<double const, double> (157,987 samples, 0.02%)
std::vector<std::__cxx11::list<ns3::Ptr<ns3::LteControlMessage>, std::allocator<ns3::Ptr<ns3::LteControlMessage> > >, std::allocator<std::__cxx11::list<ns3::Ptr<ns3::LteControlMessage>, std::allocator<ns3::Ptr<ns3::LteControlMessage> > > > >::push_back (266,576 samples, 0.03%)
std::_List_node<ns3::Ptr<ns3::Packet> >::_M_valptr (268,362 samples, 0.03%)
void std::__invoke_impl<void, ns3::Callback<void, ns3::UlInfoListElement_s>::Callback<void (2,014,597 samples, 0.21%)
void std::__cxx11::list<ns3::Ptr<ns3::Packet>, std::allocator<ns3::Ptr<ns3::Packet> > >::_M_insert<ns3::Ptr<ns3::Packet> const&> (1,698,937 samples, 0.18%)
void std::_Destroy<ns3::DlInfoListElement_s*, ns3::DlInfoListElement_s> (886,663 samples, 0.09%)
__gnu_cxx::__aligned_membuf<std::pair<ns3::Scheduler::EventKey const, ns3::EventImpl*> >::_M_ptr (239,221 samples, 0.02%)
std::function<void (261,260 samples, 0.03%)
std::operator== (197,446 samples, 0.02%)
std::map<int, double, std::less<int>, std::allocator<std::pair<int const, double> > >::lower_bound (147,572 samples, 0.02%)
ns3::UlCqi_s::~UlCqi_s (502,449 samples, 0.05%)
std::vector<ns3::PacketMetadata::Data*, std::allocator<ns3::PacketMetadata::Data*> >::empty (674,989 samples, 0.07%)
std::_Vector_base<double, std::allocator<double> >::_M_deallocate (199,701 samples, 0.02%)
ns3::LteEnbMac::DoSchedDlConfigInd (19,285,336 samples, 1.99%)
std::_Rb_tree_node<std::pair<unsigned int const, ns3::Ptr<ns3::SpectrumValue> > >* std::_Rb_tree<unsigned int, std::pair<unsigned int const, ns3::Ptr<ns3::SpectrumValue> >, std::_Select1st<std::pair<unsigned int const, ns3::Ptr<ns3::SpectrumValue> > >, std::less<unsigned int>, std::allocator<std::pair<unsigned int const, ns3::Ptr<ns3::SpectrumValue> > > >::_M_copy<false, std::_Rb_tree<unsigned int, std::pair<unsigned int const, ns3::Ptr<ns3::SpectrumValue> >, std::_Select1st<std::pair<unsigned int const, ns3::Ptr<ns3::SpectrumValue> > >, std::less<unsigned int>, std::allocator<std::pair<unsigned int const, ns3::Ptr<ns3::SpectrumValue> > > >::_Alloc_node> (158,119 samples, 0.02%)
ns3::SimpleRefCount<ns3::Object, ns3::ObjectBase, ns3::ObjectDeleter>::Unref (707,699 samples, 0.07%)
ns3::FfMacSchedSapProvider::SchedUlCqiInfoReqParameters::~SchedUlCqiInfoReqParameters (949,850 samples, 0.10%)
std::__cxx11::list<ns3::RarLteControlMessage::Rar, std::allocator<ns3::RarLteControlMessage::Rar> >::~list (430,365 samples, 0.04%)
__gnu_cxx::__normal_iterator<ns3::MacCeListElement_s*, std::vector<ns3::MacCeListElement_s, std::allocator<ns3::MacCeListElement_s> > >::operator+ (159,119 samples, 0.02%)
ns3::EventId ns3::Simulator::Schedule<void (3,688,502 samples, 0.38%)
ns3::HarqProcessInfoElement_t* std::__uninitialized_copy_a<__gnu_cxx::__normal_iterator<ns3::HarqProcessInfoElement_t const*, std::vector<ns3::HarqProcessInfoElement_t, std::allocator<ns3::HarqProcessInfoElement_t> > >, ns3::HarqProcessInfoElement_t*, ns3::HarqProcessInfoElement_t> (1,566,463 samples, 0.16%)
std::_Function_handler<void (5,321,712 samples, 0.55%)
std::_Vector_base<unsigned short, std::allocator<unsigned short> >::~_Vector_base (168,609 samples, 0.02%)
std::_List_node<ns3::Ptr<ns3::Packet> >* std::__cxx11::list<ns3::Ptr<ns3::Packet>, std::allocator<ns3::Ptr<ns3::Packet> > >::_M_create_node<ns3::Ptr<ns3::Packet> const&> (443,816 samples, 0.05%)
std::vector<ns3::BuildRarListElement_s, std::allocator<ns3::BuildRarListElement_s> >::size (155,525 samples, 0.02%)
std::_Vector_base<unsigned char, std::allocator<unsigned char> >::_M_get_Tp_allocator (386,559 samples, 0.04%)
ns3::HigherLayerSelected_s* std::__uninitialized_copy_a<__gnu_cxx::__normal_iterator<ns3::HigherLayerSelected_s const*, std::vector<ns3::HigherLayerSelected_s, std::allocator<ns3::HigherLayerSelected_s> > >, ns3::HigherLayerSelected_s*, ns3::HigherLayerSelected_s> (151,182 samples, 0.02%)
ns3::LteRadioBearerTag::GetInstanceTypeId (266,218 samples, 0.03%)
std::vector<unsigned char, std::allocator<unsigned char> >::vector (333,368 samples, 0.03%)
void std::_Destroy<ns3::DlInfoListElement_s*> (1,227,211 samples, 0.13%)
__gnu_cxx::__normal_iterator<ns3::RlcPduListElement_s const*, std::vector<ns3::RlcPduListElement_s, std::allocator<ns3::RlcPduListElement_s> > >::base (155,263 samples, 0.02%)
ns3::EnbMacMemberLteMacSapProvider<ns3::LteEnbMac>::TransmitPdu (579,238 samples, 0.06%)
ns3::SpectrumValue::Divide (438,578 samples, 0.05%)
double* std::__copy_move_a<false, __gnu_cxx::__normal_iterator<double const*, std::vector<double, std::allocator<double> > >, double*> (700,030 samples, 0.07%)
__gnu_cxx::__normal_iterator<double const*, std::vector<double, std::allocator<double> > >::__normal_iterator (202,662 samples, 0.02%)
std::_Rb_tree_node<std::pair<unsigned int const, ns3::Ptr<ns3::SpectrumValue> > >* std::_Rb_tree<unsigned int, std::pair<unsigned int const, ns3::Ptr<ns3::SpectrumValue> >, std::_Select1st<std::pair<unsigned int const, ns3::Ptr<ns3::SpectrumValue> > >, std::less<unsigned int>, std::allocator<std::pair<unsigned int const, ns3::Ptr<ns3::SpectrumValue> > > >::_Alloc_node::operator (156,128 samples, 0.02%)
ns3::EnbMacMemberLteEnbPhySapUser::ReceiveLteControlMessage (20,400,169 samples, 2.10%)
ns3::SpectrumValue::SpectrumValue (361,724 samples, 0.04%)
std::_Function_base::~_Function_base (7,196,969 samples, 0.74%)
double& std::forward<double&> (151,412 samples, 0.02%)
int* std::__copy_move_a1<false, int const*, int*> (394,757 samples, 0.04%)
ns3::Ptr<ns3::LteControlMessage>& std::__cxx11::list<ns3::Ptr<ns3::LteControlMessage>, std::allocator<ns3::Ptr<ns3::LteControlMessage> > >::emplace_back<ns3::Ptr<ns3::LteControlMessage>&> (731,821 samples, 0.08%)
std::_Rb_tree_node<std::pair<ns3::Scheduler::EventKey const, ns3::EventImpl*> >::_M_valptr (153,808 samples, 0.02%)
std::operator== (310,383 samples, 0.03%)
std::_Function_handler<void (19,577,698 samples, 2.02%)
(275,175 samples, 0.03%)
std::__cxx11::list<ns3::Ptr<ns3::Packet>, std::allocator<ns3::Ptr<ns3::Packet> > >::clear (977,631 samples, 0.10%)
__gnu_cxx::__normal_iterator<std::__cxx11::list<ns3::UlDciLteControlMessage, std::allocator<ns3::UlDciLteControlMessage> > const*, std::vector<std::__cxx11::list<ns3::UlDciLteControlMessage, std::allocator<ns3::UlDciLteControlMessage> >, std::allocator<std::__cxx11::list<ns3::UlDciLteControlMessage, std::allocator<ns3::UlDciLteControlMessage> > > > >::__normal_iterator (156,097 samples, 0.02%)
std::_Bind<void (191,013 samples, 0.02%)
std::_Rb_tree_iterator<std::pair<ns3::Scheduler::EventKey const, ns3::EventImpl*> > std::_Rb_tree<ns3::Scheduler::EventKey, std::pair<ns3::Scheduler::EventKey const, ns3::EventImpl*>, std::_Select1st<std::pair<ns3::Scheduler::EventKey const, ns3::EventImpl*> >, std::less<ns3::Scheduler::EventKey>, std::allocator<std::pair<ns3::Scheduler::EventKey const, ns3::EventImpl*> > >::_M_emplace_hint_unique<std::pair<ns3::Scheduler::EventKey, ns3::EventImpl*> > (1,422,790 samples, 0.15%)
ns3::LteEnbPhy::CreateTxPowerSpectralDensityWithPowerAllocation (9,112,338 samples, 0.94%)
ns3::BsrLteControlMessage::SetBsr (1,023,273 samples, 0.11%)
std::vector<ns3::DlInfoListElement_s::HarqStatus_e, std::allocator<ns3::DlInfoListElement_s::HarqStatus_e> >::operator= (234,084 samples, 0.02%)
std::_Rb_tree<unsigned short, std::pair<unsigned short const, ns3::DlInfoListElement_s>, std::_Select1st<std::pair<unsigned short const, ns3::DlInfoListElement_s> >, std::less<unsigned short>, std::allocator<std::pair<unsigned short const, ns3::DlInfoListElement_s> > >::_M_get_insert_unique_pos (344,616 samples, 0.04%)
(311,768 samples, 0.03%)
int* std::__uninitialized_copy_a<__gnu_cxx::__normal_iterator<int const*, std::vector<int, std::allocator<int> > >, int*, int> (310,256 samples, 0.03%)
std::_Rb_tree_node<std::pair<unsigned int const, ns3::Ptr<ns3::SpectrumValue> > >* std::_Rb_tree<unsigned int, std::pair<unsigned int const, ns3::Ptr<ns3::SpectrumValue> >, std::_Select1st<std::pair<unsigned int const, ns3::Ptr<ns3::SpectrumValue> > >, std::less<unsigned int>, std::allocator<std::pair<unsigned int const, ns3::Ptr<ns3::SpectrumValue> > > >::_M_clone_node<false, std::_Rb_tree<unsigned int, std::pair<unsigned int const, ns3::Ptr<ns3::SpectrumValue> >, std::_Select1st<std::pair<unsigned int const, ns3::Ptr<ns3::SpectrumValue> > >, std::less<unsigned int>, std::allocator<std::pair<unsigned int const, ns3::Ptr<ns3::SpectrumValue> > > >::_Alloc_node> (421,993 samples, 0.04%)
std::vector<ns3::HarqProcessInfoElement_t, std::allocator<ns3::HarqProcessInfoElement_t> >::empty (163,295 samples, 0.02%)
std::_Vector_base<ns3::BuildDataListElement_s, std::allocator<ns3::BuildDataListElement_s> >::~_Vector_base (195,366 samples, 0.02%)
ns3::Ptr<ns3::DlCqiLteControlMessage> ns3::DynamicCast<ns3::DlCqiLteControlMessage, ns3::LteControlMessage> (201,818 samples, 0.02%)
ns3::DefaultSimulatorImpl::ProcessOneEvent (920,121,348 samples, 94.88%) ns3::DefaultSimulatorImpl::ProcessOneEvent
std::_Function_base::_Base_manager<std::_Bind<void (200,664 samples, 0.02%)
std::_Rb_tree<ns3::TbId_t, std::pair<ns3::TbId_t const, ns3::tbInfo_t>, std::_Select1st<std::pair<ns3::TbId_t const, ns3::tbInfo_t> >, std::less<ns3::TbId_t>, std::allocator<std::pair<ns3::TbId_t const, ns3::tbInfo_t> > >::_S_key (325,721 samples, 0.03%)
__gnu_cxx::__normal_iterator<unsigned char const*, std::vector<unsigned char, std::allocator<unsigned char> > >::base (220,377 samples, 0.02%)
ns3::LteSpectrumSignalParametersDlCtrlFrame::~LteSpectrumSignalParametersDlCtrlFrame (656,172 samples, 0.07%)
std::_Vector_base<double, std::allocator<double> >::_M_deallocate (190,332 samples, 0.02%)
std::vector<int, std::allocator<int> >::at (243,145 samples, 0.03%)
std::_Vector_base<double, std::allocator<double> >::_Vector_base (1,030,409 samples, 0.11%)
std::map<int, double, std::less<int>, std::allocator<std::pair<int const, double> > >::find (922,442 samples, 0.10%)
ns3::Ptr<ns3::SpectrumPhy>::operator bool (183,160 samples, 0.02%)
ns3::Seconds (2,151,776 samples, 0.22%)
ns3::Ptr<ns3::EventImpl>::Ptr (165,554 samples, 0.02%)
std::_Rb_tree<ns3::LteSpectrumModelId, std::pair<ns3::LteSpectrumModelId const, ns3::Ptr<ns3::SpectrumModel> >, std::_Select1st<std::pair<ns3::LteSpectrumModelId const, ns3::Ptr<ns3::SpectrumModel> > >, std::less<ns3::LteSpectrumModelId>, std::allocator<std::pair<ns3::LteSpectrumModelId const, ns3::Ptr<ns3::SpectrumModel> > > >::find (1,347,788 samples, 0.14%)
std::_Function_base::_Base_manager<void (601,990 samples, 0.06%)
std::map<unsigned int, ns3::SpectrumConverter, std::less<unsigned int>, std::allocator<std::pair<unsigned int const, ns3::SpectrumConverter> > >::find (738,382 samples, 0.08%)
void std::__cxx11::list<ns3::Ptr<ns3::LteControlMessage>, std::allocator<ns3::Ptr<ns3::LteControlMessage> > >::_M_initialize_dispatch<std::_List_const_iterator<ns3::Ptr<ns3::LteControlMessage> > > (267,551 samples, 0.03%)
std::map<unsigned short, ns3::Ptr<ns3::UeManager>, std::less<unsigned short>, std::allocator<std::pair<unsigned short const, ns3::Ptr<ns3::UeManager> > > >::find (225,392 samples, 0.02%)
std::_Bvector_base<std::allocator<bool> >::_M_allocate (308,272 samples, 0.03%)
std::_Tuple_impl<1ul, unsigned int, unsigned int>::_Tuple_impl<unsigned int&, unsigned int&, void> (825,750 samples, 0.09%)
ns3::Packet::AddPacketTag (190,338 samples, 0.02%)
std::allocator<unsigned short>::allocate (163,524 samples, 0.02%)
std::pair<unsigned short const, std::vector<unsigned short, std::allocator<unsigned short> > >::pair<unsigned short const&> (483,178 samples, 0.05%)
std::map<unsigned short, ns3::DlInfoListElement_s, std::less<unsigned short>, std::allocator<std::pair<unsigned short const, ns3::DlInfoListElement_s> > >::find (353,675 samples, 0.04%)
std::_Vector_base<ns3::DlInfoListElement_s::HarqStatus_e, std::allocator<ns3::DlInfoListElement_s::HarqStatus_e> >::_Vector_base (165,586 samples, 0.02%)
ns3::MemberLteCcmRrcSapUser<ns3::LteEnbRrc>::GetUeManager (2,186,317 samples, 0.23%)
std::__new_allocator<std::_Rb_tree_node<std::pair<ns3::Scheduler::EventKey const, ns3::EventImpl*> > >::deallocate (731,414 samples, 0.08%)
std::_Rb_tree<unsigned short, std::pair<unsigned short const, std::vector<unsigned short, std::allocator<unsigned short> > >, std::_Select1st<std::pair<unsigned short const, std::vector<unsigned short, std::allocator<unsigned short> > > >, std::less<unsigned short>, std::allocator<std::pair<unsigned short const, std::vector<unsigned short, std::allocator<unsigned short> > > > >::_Rb_tree (934,328 samples, 0.10%)
std::__detail::_List_node_base::_M_hook (128,267 samples, 0.01%)
std::_Rb_tree_increment (502,296 samples, 0.05%)
std::vector<double, std::allocator<double> >::vector (1,986,872 samples, 0.20%)
std::map<ns3::Scheduler::EventKey, ns3::EventImpl*, std::less<ns3::Scheduler::EventKey>, std::allocator<std::pair<ns3::Scheduler::EventKey const, ns3::EventImpl*> > >::end (1,104,797 samples, 0.11%)
void std::vector<unsigned char, std::allocator<unsigned char> >::_M_realloc_insert<unsigned char> (975,393 samples, 0.10%)
ns3::RlcPduListElement_s* std::__relocate_a<ns3::RlcPduListElement_s*, ns3::RlcPduListElement_s*, std::allocator<ns3::RlcPduListElement_s> > (319,205 samples, 0.03%)
std::allocator<std::_Rb_tree_node<std::pair<unsigned int const, ns3::Ptr<ns3::SpectrumValue> > > >::allocate (155,343 samples, 0.02%)
__gnu_cxx::__normal_iterator<double*, std::vector<double, std::allocator<double> > > std::copy<__gnu_cxx::__normal_iterator<double const*, std::vector<double, std::allocator<double> > >, __gnu_cxx::__normal_iterator<double*, std::vector<double, std::allocator<double> > > > (665,489 samples, 0.07%)
std::_Tuple_impl<4ul, ns3::Ptr<ns3::SpectrumPhy>, std::map<unsigned int, ns3::Ptr<ns3::SpectrumValue>, std::less<unsigned int>, std::allocator<std::pair<unsigned int const, ns3::Ptr<ns3::SpectrumValue> > > > >::_Tuple_impl (263,591 samples, 0.03%)
ns3::TracedCallback<ns3::Ptr<ns3::Packet const> >::operator (797,898 samples, 0.08%)
std::_Select1st<std::pair<unsigned short const, ns3::pfsFlowPerf_t> >::operator (148,217 samples, 0.02%)
std::vector<std::vector<int, std::allocator<int> >, std::allocator<std::vector<int, std::allocator<int> > > >::size (234,068 samples, 0.02%)
void std::vector<int, std::allocator<int> >::_M_realloc_insert<int> (738,134 samples, 0.08%)
std::_Vector_base<unsigned short, std::allocator<unsigned short> >::_Vector_impl::_Vector_impl (204,699 samples, 0.02%)
std::_Vector_base<double, std::allocator<double> >::~_Vector_base (199,701 samples, 0.02%)
std::_Vector_base<unsigned short, std::allocator<unsigned short> >::_Vector_base (1,034,686 samples, 0.11%)
ns3::Buffer::Initialize (1,901,878 samples, 0.20%)
std::vector<int, std::allocator<int> >::~vector (231,358 samples, 0.02%)
std::tuple<unsigned short const&>::tuple<true, true> (148,271 samples, 0.02%)
std::__cxx11::list<ns3::Ptr<ns3::LteControlMessage>, std::allocator<ns3::Ptr<ns3::LteControlMessage> > >::list (367,412 samples, 0.04%)
__gnu_cxx::__aligned_membuf<std::pair<unsigned short const, std::vector<unsigned char, std::allocator<unsigned char> > > >::_M_addr (199,850 samples, 0.02%)
std::map<unsigned short, ns3::DlInfoListElement_s, std::less<unsigned short>, std::allocator<std::pair<unsigned short const, ns3::DlInfoListElement_s> > >::~map (349,670 samples, 0.04%)
ns3::LteEnbMac::DoSchedDlConfigInd (3,017,978 samples, 0.31%)
ns3::CqiListElement_s* std::uninitialized_copy<std::move_iterator<ns3::CqiListElement_s*>, ns3::CqiListElement_s*> (176,077 samples, 0.02%)
std::_Rb_tree_iterator<std::pair<ns3::Scheduler::EventKey const, ns3::EventImpl*> >::operator* (194,601 samples, 0.02%)
std::_Vector_base<ns3::RlcPduListElement_s, std::allocator<ns3::RlcPduListElement_s> >::_M_allocate (190,161 samples, 0.02%)
ns3::TracedCallback<unsigned short, unsigned short, double>::operator (259,684 samples, 0.03%)
std::_Rb_tree<ns3::TbId_t, std::pair<ns3::TbId_t const, ns3::tbInfo_t>, std::_Select1st<std::pair<ns3::TbId_t const, ns3::tbInfo_t> >, std::less<ns3::TbId_t>, std::allocator<std::pair<ns3::TbId_t const, ns3::tbInfo_t> > >::_Auto_node::_M_key (394,901 samples, 0.04%)
unsigned short& std::vector<unsigned short, std::allocator<unsigned short> >::emplace_back<unsigned short> (376,292 samples, 0.04%)
__gnu_cxx::__aligned_membuf<std::pair<unsigned char const, ns3::LteMacSapProvider*> >::_M_ptr (313,712 samples, 0.03%)
ns3::Object::Object (225,956 samples, 0.02%)
ns3::TypeId::TypeId (145,703 samples, 0.02%)
ns3::Object::~Object (1,068,725 samples, 0.11%)
decltype (443,190 samples, 0.05%)
std::enable_if<is_member_pointer_v<void (5,295,295 samples, 0.55%)
ns3::Ptr<ns3::EventImpl>::Acquire (159,184 samples, 0.02%)
std::vector<ns3::UlInfoListElement_s, std::allocator<ns3::UlInfoListElement_s> >::~vector (390,357 samples, 0.04%)
std::map<unsigned short, double, std::less<unsigned short>, std::allocator<std::pair<unsigned short const, double> > >::find (2,045,789 samples, 0.21%)
all (969,771,633 samples, 100%)
std::vector<signed char, std::allocator<signed char> >::erase (696,549 samples, 0.07%)
ns3::Ptr<ns3::SpectrumValue>::operator= (196,986 samples, 0.02%)
std::_Rb_tree<unsigned int, std::pair<unsigned int const, ns3::SpectrumConverter>, std::_Select1st<std::pair<unsigned int const, ns3::SpectrumConverter> >, std::less<unsigned int>, std::allocator<std::pair<unsigned int const, ns3::SpectrumConverter> > >::_S_key (330,075 samples, 0.03%)
signed char&& std::forward<signed char> (164,128 samples, 0.02%)
int* std::uninitialized_copy<__gnu_cxx::__normal_iterator<int const*, std::vector<int, std::allocator<int> > >, int*> (730,011 samples, 0.08%)
ns3::Ptr<ns3::SpectrumValue>::operator* (201,247 samples, 0.02%)
std::__cxx11::list<ns3::Callback<void, unsigned short, unsigned char, unsigned int, unsigned long>, std::allocator<ns3::Callback<void, unsigned short, unsigned char, unsigned int, unsigned long> > >::end (200,942 samples, 0.02%)
ns3::Time::IsPositive (216,700 samples, 0.02%)
decltype (266,180 samples, 0.03%)
ns3::Time::GetTimeStep (201,200 samples, 0.02%)
std::map<unsigned int, ns3::Ptr<ns3::SpectrumValue>, std::less<unsigned int>, std::allocator<std::pair<unsigned int const, ns3::Ptr<ns3::SpectrumValue> > > >::~map (220,721 samples, 0.02%)
__gnu_cxx::__normal_iterator<ns3::DlInfoListElement_s*, std::vector<ns3::DlInfoListElement_s, std::allocator<ns3::DlInfoListElement_s> > >::base (193,728 samples, 0.02%)
std::_Rb_tree<unsigned short, unsigned short, std::_Identity<unsigned short>, std::less<unsigned short>, std::allocator<unsigned short> >::_S_key (668,940 samples, 0.07%)
std::vector<double, std::allocator<double> >::vector (246,976 samples, 0.03%)
[libc.so.6] (498,884 samples, 0.05%)
std::enable_if<is_member_pointer_v<void (2,337,187 samples, 0.24%)
std::enable_if<is_invocable_r_v<void, ns3::Callback<void, unsigned short, ns3::Ptr<ns3::SpectrumValue> >::Callback<void (1,199,098 samples, 0.12%)
std::vector<ns3::CqiListElement_s, std::allocator<ns3::CqiListElement_s> >::_M_check_len (453,445 samples, 0.05%)
void std::_Construct<ns3::HigherLayerSelected_s, ns3::HigherLayerSelected_s const&> (151,182 samples, 0.02%)
ns3::PacketTagList::RemoveWriter (241,075 samples, 0.02%)
ns3::Callback<void, ns3::DlInfoListElement_s>::operator (4,295,691 samples, 0.44%)
std::vector<int, std::allocator<int> >::size (188,602 samples, 0.02%)
ns3::SbMeasResult_s::~SbMeasResult_s (209,574 samples, 0.02%)
std::vector<ns3::VendorSpecificListElement_s, std::allocator<ns3::VendorSpecificListElement_s> >::end (189,409 samples, 0.02%)
std::vector<bool, std::allocator<bool> >::size (163,820 samples, 0.02%)
__gnu_cxx::__normal_iterator<ns3::Ptr<ns3::PacketBurst> const*, std::vector<ns3::Ptr<ns3::PacketBurst>, std::allocator<ns3::Ptr<ns3::PacketBurst> > > >::__normal_iterator (146,918 samples, 0.02%)
decltype (395,364 samples, 0.04%)
std::__cxx11::list<ns3::Ptr<ns3::Packet>, std::allocator<ns3::Ptr<ns3::Packet> > >::~list (354,715 samples, 0.04%)
std::_Rb_tree<ns3::Scheduler::EventKey, std::pair<ns3::Scheduler::EventKey const, ns3::EventImpl*>, std::_Select1st<std::pair<ns3::Scheduler::EventKey const, ns3::EventImpl*> >, std::less<ns3::Scheduler::EventKey>, std::allocator<std::pair<ns3::Scheduler::EventKey const, ns3::EventImpl*> > >::_M_begin (190,458 samples, 0.02%)
std::_Rb_tree_node<std::pair<ns3::Scheduler::EventKey const, ns3::EventImpl*> >::_M_valptr (152,053 samples, 0.02%)
double* std::__uninitialized_copy<true>::__uninit_copy<__gnu_cxx::__normal_iterator<double const*, std::vector<double, std::allocator<double> > >, double*> (542,531 samples, 0.06%)
__gnu_cxx::__normal_iterator<double*, std::vector<double, std::allocator<double> > > std::__copy_move_a<false, __gnu_cxx::__normal_iterator<double const*, std::vector<double, std::allocator<double> > >, __gnu_cxx::__normal_iterator<double*, std::vector<double, std::allocator<double> > > > (327,851 samples, 0.03%)
std::_Rb_tree<unsigned char, std::pair<unsigned char const, ns3::LteMacSapUser*>, std::_Select1st<std::pair<unsigned char const, ns3::LteMacSapUser*> >, std::less<unsigned char>, std::allocator<std::pair<unsigned char const, ns3::LteMacSapUser*> > >::_M_lower_bound (446,182 samples, 0.05%)
(206,181 samples, 0.02%)
std::map<unsigned short, ns3::SbMeasResult_s, std::less<unsigned short>, std::allocator<std::pair<unsigned short const, ns3::SbMeasResult_s> > >::find (452,741 samples, 0.05%)
ns3::Simulator::ScheduleWithContext (8,077,942 samples, 0.83%)
ns3::PfFfMacScheduler::UpdateDlRlcBufferInfo (1,587,094 samples, 0.16%)
std::__cxx11::list<ns3::Ptr<ns3::LteControlMessage>, std::allocator<ns3::Ptr<ns3::LteControlMessage> > >::list (158,346 samples, 0.02%)
std::_Rb_tree<unsigned short, unsigned short, std::_Identity<unsigned short>, std::less<unsigned short>, std::allocator<unsigned short> >::end (201,544 samples, 0.02%)
ns3::EventId ns3::Simulator::Schedule<void (22,013,376 samples, 2.27%)
std::_Rb_tree<unsigned short, unsigned short, std::_Identity<unsigned short>, std::less<unsigned short>, std::allocator<unsigned short> >::_M_lower_bound (1,198,361 samples, 0.12%)
std::_Head_base<5ul, std::map<unsigned int, ns3::Ptr<ns3::SpectrumValue>, std::less<unsigned int>, std::allocator<std::pair<unsigned int const, ns3::Ptr<ns3::SpectrumValue> > > >, false>::_Head_base<std::map<unsigned int, ns3::Ptr<ns3::SpectrumValue>, std::less<unsigned int>, std::allocator<std::pair<unsigned int const, ns3::Ptr<ns3::SpectrumValue> > > >&> (236,989 samples, 0.02%)
ns3::MemberLteCcmMacSapUser<ns3::NoOpComponentCarrierManager>::NotifyTxOpportunity (538,351 samples, 0.06%)
std::_List_const_iterator<ns3::Ptr<ns3::LteControlMessage> >::operator* (232,619 samples, 0.02%)
std::__cxx11::list<ns3::Ptr<ns3::Packet>, std::allocator<ns3::Ptr<ns3::Packet> > >::end (195,672 samples, 0.02%)
ns3::SpectrumValue::Copy (2,719,189 samples, 0.28%)
std::allocator<ns3::BuildDataListElement_s>::allocate (158,386 samples, 0.02%)
std::vector<unsigned char, std::allocator<unsigned char> >::vector (489,793 samples, 0.05%)
std::_Vector_base<int, std::allocator<int> >::~_Vector_base (281,814 samples, 0.03%)
std::_Rb_tree<ns3::Scheduler::EventKey, std::pair<ns3::Scheduler::EventKey const, ns3::EventImpl*>, std::_Select1st<std::pair<ns3::Scheduler::EventKey const, ns3::EventImpl*> >, std::less<ns3::Scheduler::EventKey>, std::allocator<std::pair<ns3::Scheduler::EventKey const, ns3::EventImpl*> > >::_M_destroy_node (1,051,072 samples, 0.11%)
std::vector<int, std::allocator<int> >::end (162,051 samples, 0.02%)
ns3::Ptr<ns3::PacketBurst>::Ptr (314,646 samples, 0.03%)
std::vector<ns3::Ptr<ns3::PacketBurst>, std::allocator<ns3::Ptr<ns3::PacketBurst> > >::back (217,631 samples, 0.02%)
(158,925 samples, 0.02%)
ns3::Packet::AddPacketTag (1,751,354 samples, 0.18%)
std::_Rb_tree_iterator<std::pair<ns3::Scheduler::EventKey const, ns3::EventImpl*> > std::map<ns3::Scheduler::EventKey, ns3::EventImpl*, std::less<ns3::Scheduler::EventKey>, std::allocator<std::pair<ns3::Scheduler::EventKey const, ns3::EventImpl*> > >::emplace_hint<std::pair<ns3::Scheduler::EventKey, ns3::EventImpl*> > (2,897,473 samples, 0.30%)
ns3::EventImpl* ns3::PeekPointer<ns3::EventImpl> (357,408 samples, 0.04%)
ns3::FfMacSchedSapUser::SchedUlConfigIndParameters::SchedUlConfigIndParameters (2,391,271 samples, 0.25%)
ns3::Ptr<ns3::SpectrumValue>& std::__pair_get<1ul>::__move_get<unsigned int const&, ns3::Ptr<ns3::SpectrumValue>&> (161,945 samples, 0.02%)
__gnu_cxx::__normal_iterator<int const*, std::vector<int, std::allocator<int> > > std::__miter_base<__gnu_cxx::__normal_iterator<int const*, std::vector<int, std::allocator<int> > > > (158,922 samples, 0.02%)
std::_Rb_tree<unsigned short, std::pair<unsigned short const, ns3::pfsFlowPerf_t>, std::_Select1st<std::pair<unsigned short const, ns3::pfsFlowPerf_t> >, std::less<unsigned short>, std::allocator<std::pair<unsigned short const, ns3::pfsFlowPerf_t> > >::_S_right (196,109 samples, 0.02%)
__gnu_cxx::__normal_iterator<double*, std::vector<double, std::allocator<double> > > std::copy<__gnu_cxx::__normal_iterator<double const*, std::vector<double, std::allocator<double> > >, __gnu_cxx::__normal_iterator<double*, std::vector<double, std::allocator<double> > > > (410,799 samples, 0.04%)
std::_Rb_tree<unsigned short, std::pair<unsigned short const, std::vector<unsigned short, std::allocator<unsigned short> > >, std::_Select1st<std::pair<unsigned short const, std::vector<unsigned short, std::allocator<unsigned short> > > >, std::less<unsigned short>, std::allocator<std::pair<unsigned short const, std::vector<unsigned short, std::allocator<unsigned short> > > > >::_M_erase (690,702 samples, 0.07%)
std::vector<double, std::allocator<double> >::at (487,190 samples, 0.05%)
std::vector<unsigned short, std::allocator<unsigned short> >::vector (1,402,431 samples, 0.14%)
std::_Rb_tree_node<std::pair<unsigned short const, std::vector<unsigned short, std::allocator<unsigned short> > > >* std::_Rb_tree<unsigned short, std::pair<unsigned short const, std::vector<unsigned short, std::allocator<unsigned short> > >, std::_Select1st<std::pair<unsigned short const, std::vector<unsigned short, std::allocator<unsigned short> > > >, std::less<unsigned short>, std::allocator<std::pair<unsigned short const, std::vector<unsigned short, std::allocator<unsigned short> > > > >::_M_create_node<std::piecewise_construct_t const&, std::tuple<unsigned short const&>, std::tuple<> > (229,116 samples, 0.02%)
std::_Rb_tree_iterator<std::pair<ns3::Scheduler::EventKey const, ns3::EventImpl*> >::operator-- (356,677 samples, 0.04%)
std::allocator<double>::allocate (156,472 samples, 0.02%)
ns3::Ptr<ns3::AntennaModel>::Ptr (200,719 samples, 0.02%)
ns3::RngStream::RandU01 (646,005 samples, 0.07%)
ns3::DefaultDeleter<ns3::EventImpl>::Delete (9,050,608 samples, 0.93%)
std::_Rb_tree_node<std::pair<unsigned short const, std::vector<unsigned char, std::allocator<unsigned char> > > >::_M_valptr (354,218 samples, 0.04%)
std::vector<ns3::DlInfoListElement_s::HarqStatus_e, std::allocator<ns3::DlInfoListElement_s::HarqStatus_e> >::end (190,162 samples, 0.02%)
std::vector<ns3::RlcPduListElement_s, std::allocator<ns3::RlcPduListElement_s> >* std::__do_uninit_copy<__gnu_cxx::__normal_iterator<std::vector<ns3::RlcPduListElement_s, std::allocator<ns3::RlcPduListElement_s> > const*, std::vector<std::vector<ns3::RlcPduListElement_s, std::allocator<ns3::RlcPduListElement_s> >, std::allocator<std::vector<ns3::RlcPduListElement_s, std::allocator<ns3::RlcPduListElement_s> > > > >, std::vector<ns3::RlcPduListElement_s, std::allocator<ns3::RlcPduListElement_s> >*> (262,535 samples, 0.03%)
__gnu_cxx::__aligned_membuf<std::pair<unsigned short const, std::vector<ns3::DlDciListElement_s, std::allocator<ns3::DlDciListElement_s> > > >::_M_ptr (194,523 samples, 0.02%)
std::_Rb_tree<unsigned char, std::pair<unsigned char const, ns3::LteMacSapProvider*>, std::_Select1st<std::pair<unsigned char const, ns3::LteMacSapProvider*> >, std::less<unsigned char>, std::allocator<std::pair<unsigned char const, ns3::LteMacSapProvider*> > >::find (1,655,067 samples, 0.17%)
std::map<unsigned short, unsigned char, std::less<unsigned short>, std::allocator<std::pair<unsigned short const, unsigned char> > >::find (152,374 samples, 0.02%)
ns3::LteUePowerControl::GetPuschTxPower (1,618,983 samples, 0.17%)
std::function<void (4,103,031 samples, 0.42%)
ns3::MobilityModel::GetPosition (262,140 samples, 0.03%)
ns3::DefaultSimulatorImpl::Now (240,092 samples, 0.02%)
__gnu_cxx::__normal_iterator<ns3::MacCeListElement_s*, std::vector<ns3::MacCeListElement_s, std::allocator<ns3::MacCeListElement_s> > > std::vector<ns3::MacCeListElement_s, std::allocator<ns3::MacCeListElement_s> >::insert<__gnu_cxx::__normal_iterator<ns3::MacCeListElement_s*, std::vector<ns3::MacCeListElement_s, std::allocator<ns3::MacCeListElement_s> > >, void> (271,036 samples, 0.03%)
[libm.so.6] (281,723 samples, 0.03%)
std::vector<unsigned short, std::allocator<unsigned short> >::_Temporary_value::_M_ptr (155,817 samples, 0.02%)
ns3::Ptr<ns3::SpectrumModel const>::Ptr (138,401 samples, 0.01%)
ns3::LteAmc::GetMcsFromCqi (160,208 samples, 0.02%)
std::_Rb_tree<ns3::Scheduler::EventKey, std::pair<ns3::Scheduler::EventKey const, ns3::EventImpl*>, std::_Select1st<std::pair<ns3::Scheduler::EventKey const, ns3::EventImpl*> >, std::less<ns3::Scheduler::EventKey>, std::allocator<std::pair<ns3::Scheduler::EventKey const, ns3::EventImpl*> > >::_S_right (316,628 samples, 0.03%)
std::__cxx11::list<ns3::Ptr<ns3::LteControlMessage>, std::allocator<ns3::Ptr<ns3::LteControlMessage> > >::end (197,575 samples, 0.02%)
void std::__cxx11::list<ns3::Ptr<ns3::Packet>, std::allocator<ns3::Ptr<ns3::Packet> > >::_M_insert<ns3::Ptr<ns3::Packet> const&> (1,745,012 samples, 0.18%)
ns3::LogComponent::IsEnabled (301,297 samples, 0.03%)
std::vector<unsigned short, std::allocator<unsigned short> >::end (245,937 samples, 0.03%)
std::__new_allocator<std::_Rb_tree_node<std::pair<ns3::TbId_t const, ns3::tbInfo_t> > >::allocate (264,767 samples, 0.03%)
std::vector<unsigned char, std::allocator<unsigned char> >::vector (1,527,153 samples, 0.16%)
ns3::BuildDataListElement_s::~BuildDataListElement_s (596,141 samples, 0.06%)
std::vector<double, std::allocator<double> >::vector (270,534 samples, 0.03%)
ns3::Ptr<ns3::SpectrumValue>& std::_Mu<ns3::Ptr<ns3::SpectrumValue>, false, false>::operator (158,589 samples, 0.02%)
ns3::Ptr<ns3::SpectrumValue>::Acquire (152,792 samples, 0.02%)
__gnu_cxx::__aligned_membuf<std::pair<unsigned char const, ns3::LteMacSapProvider::ReportBufferStatusParameters> >::_M_ptr (164,987 samples, 0.02%)
ns3::Ptr<ns3::SpectrumSignalParameters>::operator (309,905 samples, 0.03%)
std::_List_node<ns3::Ptr<ns3::LteControlMessage> >* std::__cxx11::list<ns3::Ptr<ns3::LteControlMessage>, std::allocator<ns3::Ptr<ns3::LteControlMessage> > >::_M_create_node<ns3::Ptr<ns3::LteControlMessage> const&> (271,484 samples, 0.03%)
ns3::MemberSchedSapProvider<ns3::PfFfMacScheduler>::SchedDlTriggerReq (19,285,336 samples, 1.99%)
std::_Rb_tree<unsigned int, std::pair<unsigned int const, ns3::TxSpectrumModelInfo>, std::_Select1st<std::pair<unsigned int const, ns3::TxSpectrumModelInfo> >, std::less<unsigned int>, std::allocator<std::pair<unsigned int const, ns3::TxSpectrumModelInfo> > >::find (2,702,236 samples, 0.28%)
std::__cxx11::list<ns3::Ptr<ns3::LteControlMessage>, std::allocator<ns3::Ptr<ns3::LteControlMessage> > >::list<std::_List_const_iterator<ns3::Ptr<ns3::LteControlMessage> >, void> (222,211 samples, 0.02%)
std::__cxx11::_List_base<ns3::Ptr<ns3::PacketBurst>, std::allocator<ns3::Ptr<ns3::PacketBurst> > >::_M_get_node (504,501 samples, 0.05%)
ns3::LteAmc::GetDlTbSizeFromMcs (517,023 samples, 0.05%)
std::map<unsigned short, std::vector<double, std::allocator<double> >, std::less<unsigned short>, std::allocator<std::pair<unsigned short const, std::vector<double, std::allocator<double> > > > >::find (186,790 samples, 0.02%)
void std::allocator_traits<std::allocator<std::_Rb_tree_node<std::pair<unsigned short const, std::vector<double, std::allocator<double> > > > > >::destroy<std::pair<unsigned short const, std::vector<double, std::allocator<double> > > > (198,551 samples, 0.02%)
std::_Rb_tree_iterator<std::pair<ns3::Scheduler::EventKey const, ns3::EventImpl*> >::operator (1,100,918 samples, 0.11%)
std::_Rb_tree<ns3::Scheduler::EventKey, std::pair<ns3::Scheduler::EventKey const, ns3::EventImpl*>, std::_Select1st<std::pair<ns3::Scheduler::EventKey const, ns3::EventImpl*> >, std::less<ns3::Scheduler::EventKey>, std::allocator<std::pair<ns3::Scheduler::EventKey const, ns3::EventImpl*> > >::_M_lower_bound (1,305,876 samples, 0.13%)
std::_Vector_base<unsigned short, std::allocator<unsigned short> >::_M_allocate (192,396 samples, 0.02%)
ns3::TracedCallback<ns3::PhyTransmissionStatParameters>::operator (297,993 samples, 0.03%)
ns3::Ptr<ns3::MobilityModel const>::Acquire (155,636 samples, 0.02%)
ns3::DlInfoListElement_s* std::vector<ns3::DlInfoListElement_s, std::allocator<ns3::DlInfoListElement_s> >::_M_allocate_and_copy<__gnu_cxx::__normal_iterator<ns3::DlInfoListElement_s const*, std::vector<ns3::DlInfoListElement_s, std::allocator<ns3::DlInfoListElement_s> > > > (488,321 samples, 0.05%)
std::__cxx11::_List_base<ns3::Ptr<ns3::LteControlMessage>, std::allocator<ns3::Ptr<ns3::LteControlMessage> > >::~_List_base (191,802 samples, 0.02%)
std::_Vector_base<unsigned char, std::allocator<unsigned char> >::~_Vector_base (149,822 samples, 0.02%)
std::_Vector_base<double, std::allocator<double> >::_M_create_storage (423,769 samples, 0.04%)
std::_Vector_base<int, std::allocator<int> >::_M_allocate (251,714 samples, 0.03%)
ns3::operator/ (1,197,630 samples, 0.12%)
std::_Rb_tree<unsigned char, std::pair<unsigned char const, ns3::LteMacSapProvider::ReportBufferStatusParameters>, std::_Select1st<std::pair<unsigned char const, ns3::LteMacSapProvider::ReportBufferStatusParameters> >, std::less<unsigned char>, std::allocator<std::pair<unsigned char const, ns3::LteMacSapProvider::ReportBufferStatusParameters> > >::empty (151,905 samples, 0.02%)
ns3::LteSpectrumValueHelper::GetSpectrumModel (2,046,878 samples, 0.21%)
std::_Rb_tree<unsigned short, std::pair<unsigned short const, unsigned char>, std::_Select1st<std::pair<unsigned short const, unsigned char> >, std::less<unsigned short>, std::allocator<std::pair<unsigned short const, unsigned char> > >::find (848,294 samples, 0.09%)
ns3::NanoSeconds (241,154 samples, 0.02%)
std::__cxx11::list<ns3::Ptr<ns3::LteControlMessage>, std::allocator<ns3::Ptr<ns3::LteControlMessage> > >::clear (940,478 samples, 0.10%)
std::vector<double, std::allocator<double> >::end (285,022 samples, 0.03%)
std::_Rb_tree_node<std::pair<unsigned short const, std::vector<ns3::DlDciListElement_s, std::allocator<ns3::DlDciListElement_s> > > >::_M_valptr (194,523 samples, 0.02%)
operator new (168,940 samples, 0.02%)
std::__cxx11::_List_base<ns3::Ptr<ns3::LteControlMessage>, std::allocator<ns3::Ptr<ns3::LteControlMessage> > >::_M_clear (154,447 samples, 0.02%)
unsigned char* std::fill_n<unsigned char*, unsigned long, unsigned char> (149,553 samples, 0.02%)
std::_Rb_tree<unsigned char, std::pair<unsigned char const, ns3::LteMacSapUser*>, std::_Select1st<std::pair<unsigned char const, ns3::LteMacSapUser*> >, std::less<unsigned char>, std::allocator<std::pair<unsigned char const, ns3::LteMacSapUser*> > >::_M_begin (307,839 samples, 0.03%)
ns3::TypeId::GetParent (912,142 samples, 0.09%)
ns3::HigherLayerSelected_s* std::__do_uninit_copy<__gnu_cxx::__normal_iterator<ns3::HigherLayerSelected_s const*, std::vector<ns3::HigherLayerSelected_s, std::allocator<ns3::HigherLayerSelected_s> > >, ns3::HigherLayerSelected_s*> (128,621 samples, 0.01%)
std::vector<bool, std::allocator<bool> >::_M_fill_insert (2,342,912 samples, 0.24%)
ns3::LteMacSapProvider::TransmitPduParameters::TransmitPduParameters (537,941 samples, 0.06%)
std::__cxx11::list<ns3::Ptr<ns3::LteControlMessage>, std::allocator<ns3::Ptr<ns3::LteControlMessage> > >::splice (536,019 samples, 0.06%)
decltype (273,321 samples, 0.03%)
ns3::EnbMacMemberLteMacSapProvider<ns3::LteEnbMac>::TransmitPdu (5,428,262 samples, 0.56%)
__gnu_cxx::__normal_iterator<std::__cxx11::list<ns3::UlDciLteControlMessage, std::allocator<ns3::UlDciLteControlMessage> >*, std::vector<std::__cxx11::list<ns3::UlDciLteControlMessage, std::allocator<ns3::UlDciLteControlMessage> >, std::allocator<std::__cxx11::list<ns3::UlDciLteControlMessage, std::allocator<ns3::UlDciLteControlMessage> > > > > std::__copy_move_a<true, __gnu_cxx::__normal_iterator<std::__cxx11::list<ns3::UlDciLteControlMessage, std::allocator<ns3::UlDciLteControlMessage> >*, std::vector<std::__cxx11::list<ns3::UlDciLteControlMessage, std::allocator<ns3::UlDciLteControlMessage> >, std::allocator<std::__cxx11::list<ns3::UlDciLteControlMessage, std::allocator<ns3::UlDciLteControlMessage> > > > >, __gnu_cxx::__normal_iterator<std::__cxx11::list<ns3::UlDciLteControlMessage, std::allocator<ns3::UlDciLteControlMessage> >*, std::vector<std::__cxx11::list<ns3::UlDciLteControlMessage, std::allocator<ns3::UlDciLteControlMessage> >, std::allocator<std::__cxx11::list<ns3::UlDciLteControlMessage, std::allocator<ns3::UlDciLteControlMessage> > > > > > (253,831 samples, 0.03%)
ns3::IidManager::GetParent (351,090 samples, 0.04%)
std::__cxx11::list<ns3::Callback<void, unsigned short, unsigned char, unsigned int>, std::allocator<ns3::Callback<void, unsigned short, unsigned char, unsigned int> > >::end (164,697 samples, 0.02%)
std::vector<ns3::Buffer::Data*, std::allocator<ns3::Buffer::Data*> >::end (540,003 samples, 0.06%)
std::_Rb_tree<ns3::Scheduler::EventKey, std::pair<ns3::Scheduler::EventKey const, ns3::EventImpl*>, std::_Select1st<std::pair<ns3::Scheduler::EventKey const, ns3::EventImpl*> >, std::less<ns3::Scheduler::EventKey>, std::allocator<std::pair<ns3::Scheduler::EventKey const, ns3::EventImpl*> > >::_M_get_node (270,834 samples, 0.03%)
unsigned char* std::__copy_move<false, true, std::random_access_iterator_tag>::__copy_m<unsigned char const, unsigned char> (185,914 samples, 0.02%)
ns3::LteEnbPhy::SendControlChannels (6,963,923 samples, 0.72%)
std::__cxx11::list<ns3::Ptr<ns3::Packet>, std::allocator<ns3::Ptr<ns3::Packet> > >::clear (1,317,063 samples, 0.14%)
void std::_Destroy_aux<true>::__destroy<ns3::DlInfoListElement_s::HarqStatus_e*> (190,409 samples, 0.02%)
ns3::SpectrumValue::operator= (140,552 samples, 0.01%)
std::allocator_traits<std::allocator<ns3::RlcPduListElement_s> >::allocate (190,161 samples, 0.02%)
std::_List_iterator<ns3::Ptr<ns3::LteControlMessage> > std::__cxx11::list<ns3::Ptr<ns3::LteControlMessage>, std::allocator<ns3::Ptr<ns3::LteControlMessage> > >::insert<std::_List_const_iterator<ns3::Ptr<ns3::LteControlMessage> >, void> (704,280 samples, 0.07%)
std::_Rb_tree<ns3::Scheduler::EventKey, std::pair<ns3::Scheduler::EventKey const, ns3::EventImpl*>, std::_Select1st<std::pair<ns3::Scheduler::EventKey const, ns3::EventImpl*> >, std::less<ns3::Scheduler::EventKey>, std::allocator<std::pair<ns3::Scheduler::EventKey const, ns3::EventImpl*> > >::_S_key (161,364 samples, 0.02%)
std::__cxx11::_List_base<ns3::Ptr<ns3::PacketBurst>, std::allocator<ns3::Ptr<ns3::PacketBurst> > >::_M_put_node (158,232 samples, 0.02%)
std::_Rb_tree<int, std::pair<int const, double>, std::_Select1st<std::pair<int const, double> >, std::less<int>, std::allocator<std::pair<int const, double> > >::_M_erase (598,182 samples, 0.06%)
void std::_Destroy<ns3::Ptr<ns3::Object>*, ns3::Ptr<ns3::Object> > (154,688 samples, 0.02%)
std::vector<ns3::HarqProcessInfoElement_t, std::allocator<ns3::HarqProcessInfoElement_t> >::operator= (2,176,138 samples, 0.22%)
Note: interactive flamegraph SVGs were generated with perf.data output exported by Linux Perf,
then transformed to text and finally rendered as SVG.
git clone https://github.com/brendangregg/FlameGraph
./FlameGraph/stackcollapse-perf.pl perf.data > perf.folded
./FlameGraph/flamegraph.pl perf.folded --width=800 > perf.svg
4.9.2.2. Linux Perf and Hotspot GUIPerf is the kernel tool to measure performance of the Linux kernel,
drivers and user-space applications.
Perf tracks some performance events, being some of the most important for performance:
cycles
cache-misses
branch-misses
stalled-cycles-frontend
stalled-cycles-backend
Just like with heaptrack ns3 wifi-he-network perf.data
~/ns-3-dev$ ./ns3 run "wifi-he-network --simulationTime=0.3 --frequency=5 --useRts=1 --minExpectedThroughput=6 --maxExpectedThroughput=745" --command-template "perf record -o ./perf.data --call-graph dwarf --event cycles,cache-misses,branch-misses --sample-cpu %s" --no-build
For ease of use, ns3 --perf
~/ns-3-dev$ ./ns3 run "wifi-he-network --simulationTime=0.3 --frequency=5 --useRts=1 --minExpectedThroughput=6 --maxExpectedThroughput=745" --perf --no-build
When running for the first time, you may receive the following error:
~/ns-3-dev$ ./ns3 run "wifi-he-network --simulationTime=0.3 --frequency=5 --useRts=1 --minExpectedThroughput=6 --maxExpectedThroughput=745" --perf --no-build
Error:
Access to performance monitoring and observability operations is limited.
Consider adjusting /proc/sys/kernel/perf_event_paranoid setting to open
access to performance monitoring and observability operations for processes
without CAP_PERFMON, CAP_SYS_PTRACE or CAP_SYS_ADMIN Linux capability.
More information can be found at 'Perf events and tool security' document:
https://www.kernel.org/doc/html/latest/admin-guide/perf-security.html
perf_event_paranoid setting is 1:
  -1: Allow use of (almost) all events by all users
      Ignore mlock limit after perf_event_mlock_kb without CAP_IPC_LOCK
>= 0: Disallow raw and ftrace function tracepoint access
>= 1: Disallow CPU event access
>= 2: Disallow kernel profiling
To make the adjusted perf_event_paranoid setting permanent preserve it
in /etc/sysctl.conf (e.g. kernel.perf_event_paranoid = <setting>)
Command 'build/examples/wireless/ns3-dev-wifi-he-network-default record --call-graph dwarf -a -e cache-misses,branch-misses,cpu-cycles,instructions,context-switches build/examples/wireless/ns3-dev-wifi-he-network-default -n=100' returned non-zero exit status 255.
This error is related to lacking permissions to access performance events from the kernel and CPU.
As said in the error, permissions can be granted for the current session
by changing the perf_event_paranoid echo 0 > /proc/sys/kernel/perf_event_paranoid /etc/sysctl.conf sudo su
After the program finishes, it will print recording statistics.
MCS value               Channel width           GI                      Throughput
0                       20 MHz                  3200 ns                 6.01067 Mbit/s
0                       20 MHz                  1600 ns                 5.936 Mbit/s
...
11                      160 MHz                 1600 ns                 493.397 Mbit/s
11                      160 MHz                 800 ns                  534.016 Mbit/s
[ perf record: Woken up 9529 times to write data ]
Warning:
Processed 517638 events and lost 94 chunks!

Check IO/CPU overload!

Warning:
1 out of order events recorded.
[ perf record: Captured and wrote 2898,307 MB perf.data (436509 samples) ]
Results saved in perf.data perf report
Hotspot is a GUI for Perf, that makes performance profiling more
enjoyable and productive. It can parse the perf.data
To record the same perf.data from Hotspot directly, fill the fields
for working directory, path to the executable, arguments, perf
events to track and output directory for the perf.data
The cycles per function for this program is shown in the following
image.
The data is also presented in a tabular format in the bottom-up,
top-down and caller/callee tabs (top left of the screen).
Hotspot was used to identify performance bottlenecks in multiple occasions:
wifi-primary-channels ./ns3 run "test-runner --fullness=TAKES_FOREVER --test-name=wifi-primary-channels" issue 426 .
WifiMacQueue::TtlExceeded ./test.py -d issue 280
and merge request MR681 .
MpduAggregator and MsduAggregator required an expensive attribute lookup to get the maximum sizes
from the RegularWifiMac. Bypassing the attribute lookup reduced cache misses and unnecessary branches.
The adopted solution was to move Simulator::Now() out of TtlExceeded and reuse the value
and inlining TtlExceeded. This resulted in a ~1.02x speedup with the test suite (./test.py -d MR681 and MR685 .
4.9.2.2.1. Perf on WSLWSLv1 cannot use perf due to the lack of the linux kernel and its performance counters.
WSLv2 users need to manually build perf to profile their programs,
which can be accomplished with the following commands:
sudo apt install git flex bison libdwarf-dev libelf-dev libnuma-dev \
         libunwind-dev libnewt-dev libdwarf++0 libelf++0 libdw-dev \
         libbfb0-dev systemtap-sdt-dev libssl-dev libperl-dev \
         python-dev-is-python3 binutils-dev libiberty-dev libzstd-dev \
         libcap-dev libbabeltrace-dev libpfm4-dev libtraceevent-dev pkg-config
git clone https://github.com/microsoft/WSL2-Linux-Kernel --depth 1
cd WSL2-Linux-Kernel/tools/perf
make -j8
sudo cp perf /usr/local/bin
Note that hardware performance counters
are only available in Windows 11.
4.9.2.3. AMD uProfAMD uProf works much like Linux Perf and Hotspot GUI , but
is available in more platforms (Linux, Windows and BSD) using AMD
processors. Differently from Perf, it provides more performance
trackers for finer analysis.
To use it, open uProf then click to profile an application. If you
have already profile an application, you can reuse those settings for
another application by clicking in one of the items in the Recently Used
Configurations
Fill the fields with the application path, the arguments and
the working directory.
You may need to add the LD_LIBRARY_PATH environment variable
(or PATH on Windows), pointing it to the library output
directory (e.g. ns-3-dev/build/lib
Then click next:
Now select custom events and pick the events you want.
The recommended ones for performance profiling are:
Now click in advanced options to enable collection of the call stack.
Then click Start Profile Analyze
In the following image the metrics are shown per module, including the
C library (libc.so.6) which provides the malloc free
Here are a few cases where AMD uProf was used to identify performance bottlenecks:
WifiMacQueue::TtlExceeded ./test.py -d issue 280 and merge request MR681 .
wifi-primary-channels ./ns3 run "test-runner --fullness=TAKES_FOREVER --test-name=wifi-primary-channels" issue 426 and merge request MR677 .
Continuing the work on wifi-primary-channels InterferenceHelper::GetNextPosition ./ns3 run "test-runner --fullness=TAKES_FOREVER --test-name=wifi-primary-channels" issue 426 and merge requests MR677 and MR680 .
Position-Independent Code libraries (-fPIC semantic interposition with flag
-fno-semantic-interposition ./test.py -d MR777 .
Note: all speedups above were measured on the same machine. Results may differ based on clock speeds,
cache sizes, number of cores, memory bandwidth and latency, storage throughput and latency.
4.9.2.4. Intel VTuneIntel VTune works much like Linux Perf and Hotspot GUI , but
is available in more platforms (Linux, Windows and Mac) using Intel
processors. Differently from Perf, it provides more performance
trackers for finer analysis.
When you open the program, you will be greeted by the landing page
shown in the following image. To start a new profiling project, click
in the Configure Analysis
A configuration page will open, where you can fill the fields with
the path to the program, arguments, and set working directory and
environment variables.
Note: in this example on Windows using MinGW,
we need to define the PATH ~/ns-3-dev/build/lib ~/msys64/mingw64/bin LD_LIBRARY_PATH PATH
Clicking on the Performance Snapshot
If executed as is, a quicker profiling will be executed to
determine what areas should be profiled with more details.
For the specific example, it is indicated that there are
microarchitectural bottlenecks and low parallelism
(not a surprise since ns-3 is single-threaded).
If the microarchitecture exploration
After executing the microarchitecture exploration
Clicking in the Bottom-up
The stats for the wifi module are shown below. The retiring
metric indicates about 40% of dispatched instructions are
executed. The diagram on the right shows the bottleneck is
in the front-end of the pipeline (red), due to high
instruction cache misses, translation lookaside buffer (TLB)
overhead and unknown branches (most likely callbacks).
The stats for the core module are shown below.
More specifically for the ns3::Object::DoGetObject function.
Metrics indicates about 63% of bad speculations.
The diagram on the right shows that there are bottlenecks
both in the front-end and due to bad speculation (red).
4.9.3. System calls profilersSystem call profilers collect information on which system
calls were made by a program, how long they took to be
fulfilled and how many of them resulted in errors.
There are many system call profilers, including dtrace , strace and procmon .
An overview on how to use strace is provided in the following section.
4.9.3.1. StraceThe strace is a system calls (syscalls) profiler for Linux. It can filter
specific syscalls, or gather stats during the execution.
To collect statistics, use strace -c
~ns-3-dev/$ ./ns3 run "wifi-he-network --simulationTime=0.3 --frequency=5 --useRts=1 --minExpectedThroughput=6 --maxExpectedThroughput=745" --command-template "strace -c %s" --no-build
MCS value               Channel width           GI                      Throughput
0                       20 MHz                  3200 ns                 5.91733 Mbit/s
...
11                      160 MHz                 800 ns                  524.459 Mbit/s
% time     seconds  usecs/call     calls    errors syscall
------ ----------- ----------- --------- --------- ----------------
 37.62    0.004332          13       326       233 openat
 35.46    0.004083           9       415           mmap
...
------ ----------- ----------- --------- --------- ----------------
100.00    0.011515           8      1378       251 total
In the example above, the syscalls are listed in the right, after
the time spent on each syscall, number of calls and errors.
The errors can be caused due to multiple reasons and may not
be a problem. To check if they were problems, strace can log the
syscalls with strace -o calls.log
~ns-3-dev/$ ./ns3 run "wifi-he-network --simulationTime=0.3 --frequency=5 --useRts=1 --minExpectedThroughput=6 --maxExpectedThroughput=745" --command-template "strace -o calls.log %s" --no-build
MCS value               Channel width           GI                      Throughput
0                       20 MHz                  3200 ns                 5.91733 Mbit/s
...
11                      160 MHz                 800 ns                  524.459 Mbit/s
Looking at the calls.log execve arch_prctl mmap
execve("~/ns-3-dev/build/examples/wireless/ns3-dev-wifi-he-network", ["~/ns-3-dev/b"..., "--simulationTime=0.3", "--frequency=5", "--useRts=1", "--minExpectedThroughput=6", "--maxExpectedThroughput=745"], 0x7fffb0f91ad8 /* 3 vars */) = 0
brk(NULL)                               = 0x563141b37000
arch_prctl(0x3001 /* ARCH_??? */, 0x7ffff8d63a50) = -1 EINVAL (Invalid argument)
mmap(NULL, 8192, PROT_READ|PROT_WRITE, MAP_PRIVATE|MAP_ANONYMOUS, -1, 0) = 0x7f103c2e9000
access("/etc/ld.so.preload", R_OK)      = -1 ENOENT (No such file or directory)
Then the program searches for the wifi module library and fails multiple times (the errors seen in the table above).
openat(AT_FDCWD, "~/ns-3-dev/build/lib/glibc-hwcaps/x86-64-v3/libns3-dev-wifi.so", O_RDONLY|O_CLOEXEC) = -1 ENOENT (No such file or directory)
newfstatat(AT_FDCWD, "~/ns-3-dev/build/lib/glibc-hwcaps/x86-64-v3", 0x7ffff8d62c80, 0) = -1 ENOENT (No such file or directory)
...
openat(AT_FDCWD, "~/ns-3-dev/build/lib/x86_64/libns3-dev-wifi.so", O_RDONLY|O_CLOEXEC) = -1 ENOENT (No such file or directory)
newfstatat(AT_FDCWD, "~/ns-3-dev/build/lib/x86_64", 0x7ffff8d62c80, 0) = -1 ENOENT (No such file or directory)
The library is finally found and its header is read:
openat(AT_FDCWD, "~/ns-3-dev/build/lib/libns3-dev-wifi.so", O_RDONLY|O_CLOEXEC) = 3
read(3, "\177ELF\2\1\1\3\0\0\0\0\0\0\0\0\3\0>\0\1\0\0\0py\30\0\0\0\0\0"..., 832) = 832
Then other modules that wifi depends on are loaded, then execution of the program continues to the main
function of the simulation.
Strace was used to track down issues found while running the lena-radio-link-failure strace -c
% time     seconds  usecs/call     calls    errors syscall
------ ----------- ----------- --------- --------- ----------------
 31,51    0,246243           2    103480       942 openat
 30,23    0,236284           2    102360           write
 19,90    0,155493           1    102538           close
 16,65    0,130132           1    102426           lseek
  1,05    0,008186          18       437           mmap
  0,21    0,001671          16        99           newfstatat
  0,20    0,001595          11       134           mprotect
  0,18    0,001391          14        98           read
...
------ ----------- ----------- --------- --------- ----------------
100,00    0,781554           1    411681       951 total
Notice the number of openat write close lseek lena-radio-link-failure
Using strace
~ns-3-dev/$./ns3 run "lena-radio-link-failure --numberOfEnbs=2 --useIdealRrc=0 --interSiteDistance=700 --simTime=17" --command-template="strace %s"
...
openat(AT_FDCWD, "DlTxPhyStats.txt", O_WRONLY|O_CREAT|O_APPEND, 0666) = 3
lseek(3, 0, SEEK_END)                   = 9252
write(3, "635\t1\t1\t1\t0\t20\t1191\t0\t1\t0\n", 26) = 26
close(3)                                = 0
openat(AT_FDCWD, "DlMacStats.txt", O_WRONLY|O_CREAT|O_APPEND, 0666) = 3
lseek(3, 0, SEEK_END)                   = 11100
write(3, "0.635\t1\t1\t64\t6\t1\t20\t1191\t0\t0\t0\n", 31) = 31
close(3)                                = 0
openat(AT_FDCWD, "UlMacStats.txt", O_WRONLY|O_CREAT|O_APPEND, 0666) = 3
lseek(3, 0, SEEK_END)                   = 8375
write(3, "0.635\t1\t1\t64\t6\t1\t0\t85\t0\n", 24) = 24
close(3)                                = 0
openat(AT_FDCWD, "DlRsrpSinrStats.txt", O_WRONLY|O_CREAT|O_APPEND, 0666) = 3
lseek(3, 0, SEEK_END)                   = 16058
write(3, "0.635214\t1\t1\t1\t6.88272e-15\t22.99"..., 37) = 37
close(3)                                = 0
openat(AT_FDCWD, "UlTxPhyStats.txt", O_WRONLY|O_CREAT|O_APPEND, 0666) = 3
...
With the name of the files, we can look at the code that manipulates them.
The issue above was found in MR777 , were performance for some LTE examples
regressed for no apparent reason. The flame graph below, produced by AMD uProf ,
contains four large columns/”flames” in red, which
correspond to the write openat close lseek
Upon closer inspection, these syscalls take a long time to complete due to
the underlying filesystem of the machine running the example (NTFS mount
using the ntfs-3g FUSE filesystem). In other words, the bottleneck only
exists when running the example in slow file systems
(e.g. FUSE and network file systems).
The merge request MR814 addressed the issue by keeping the files open
throughout the simulation. That alone resulted in a 1.75x speedup.
4.9.4. Compilation ProfilersCompilation profilers can help identifying which steps of the compilation
are slowing it down. These profilers are built into the compilers themselves,
only requiring third-party tools to consolidate the results.
The GCC feature is mentioned and exemplified, but is not the recommended
compilation profiling method. For that, Clang is recommended.
4.9.4.1. GCCGCC has a special flag -ftime-report ---
Time variable                      usr           sys          wall               GGC
phase setup            :   0.00 (  0%)   0.00 (  0%)   0.01 (  1%)    1478 kB (  2%)
phase parsing          :   0.31 ( 46%)   0.17 ( 85%)   0.48 ( 55%)   55432 kB ( 71%)
phase lang. deferred   :   0.03 (  4%)   0.00 (  0%)   0.03 (  3%)    4287 kB (  5%)
phase opt and generate :   0.32 ( 48%)   0.03 ( 15%)   0.35 ( 40%)   16635 kB ( 21%)
phase last asm         :   0.01 (  1%)   0.00 (  0%)   0.01 (  1%)     769 kB (  1%)
------------------------------------------------------------------------------------
|name lookup           :   0.05 (  7%)   0.02 ( 10%)   0.04 (  5%)    2468 kB (  3%)
|overload resolution   :   0.05 (  7%)   0.00 (  0%)   0.05 (  6%)    4217 kB (  5%)
dump files             :   0.00 (  0%)   0.00 (  0%)   0.01 (  1%)       0 kB (  0%)
callgraph construction :   0.01 (  1%)   0.00 (  0%)   0.01 (  1%)    2170 kB (  3%)
...
preprocessing          :   0.05 (  7%)   0.06 ( 30%)   0.10 ( 11%)    1751 kB (  2%)
parser (global)        :   0.06 (  9%)   0.03 ( 15%)   0.07 (  8%)   16303 kB ( 21%)
parser struct body     :   0.06 (  9%)   0.04 ( 20%)   0.08 (  9%)   12525 kB ( 16%)
parser enumerator list :   0.01 (  1%)   0.00 (  0%)   0.00 (  0%)     112 kB (  0%)
parser function body   :   0.02 (  3%)   0.02 ( 10%)   0.02 (  2%)    3039 kB (  4%)
parser inl. func. body :   0.03 (  4%)   0.00 (  0%)   0.01 (  1%)    2024 kB (  3%)
parser inl. meth. body :   0.02 (  3%)   0.01 (  5%)   0.06 (  7%)    5792 kB (  7%)
template instantiation :   0.09 ( 13%)   0.01 (  5%)   0.13 ( 15%)   12274 kB ( 16%)
...
symout                 :   0.01 (  1%)   0.00 (  0%)   0.02 (  2%)    8114 kB ( 10%)
...
TOTAL                  :   0.67          0.20          0.88          78612 kB
In the table above, the first few lines show the five main compilations steps: setup parsing lang. deferred opt(imize) and generate (code) last asm
The lines below the --- template instantiation symout
Aggregating the data into a meaningful output to help focus where to improve is not that easy
and it is not a priority for GCC developers.
It is recommended to use the Clang alternative.
4.9.4.2. ClangClang can output very similar results with the -ftime-trace ClangBuildAnalyzer ,
we can have really good insights on where to spend time trying to speed up the compilation.
Support for building with -ftime-trace ClangBuildAnalyzer and producing a
report for the project have been baked into the CMake project of ns-3, and can be enabled
with -DNS3_CLANG_TIMETRACE=ON
~/ns-3-dev/cmake_cache$ cmake -DNS3_CLANG_TIMETRACE=ON ..
Or via ns3
~/ns-3-dev$ ./ns3 configure -- -DNS3_CLANG_TIMETRACE=ON
The entire procedure looks like the following:
~/ns-3-dev$ CXX="clang++" ./ns3 configure -d release --enable-examples --enable-tests -- -DNS3_CLANG_TIMETRACE=ON
~/ns-3-dev$ ./ns3 build timeTraceReport
~/ns-3-dev$ cat ClangBuildAnalyzerReport.txt
Analyzing build trace from '~/ns-3-dev/cmake_cache/clangBuildAnalyzerReport.bin'...
**** Time summary:
Compilation (2993 times):
  Parsing (frontend):         2476.1 s
  Codegen & opts (backend):   1882.9 s

**** Files that took longest to parse (compiler frontend):
  8966 ms: src/test/CMakeFiles/libtest.dir/traced/traced-callback-typedef-test-suite.cc.o
  6633 ms: src/wifi/examples/CMakeFiles/wifi-bianchi.dir/wifi-bianchi.cc.o
...

**** Files that took longest to codegen (compiler backend):
36430 ms: src/wifi/CMakeFiles/libwifi-test.dir/test/block-ack-test-suite.cc.o
24941 ms: src/wifi/CMakeFiles/libwifi-test.dir/test/wifi-mac-ofdma-test.cc.o
...

**** Templates that took longest to instantiate:
12651 ms: std::unordered_map<int, int> (615 times, avg 20 ms)
10950 ms: std::_Hashtable<int, std::pair<const int, int>, std::allocator<std::... (615 times, avg 17 ms)
10712 ms: std::__detail::__hyperg<long double> (1172 times, avg 9 ms)
...

**** Template sets that took longest to instantiate:
111660 ms: std::list<$> (27141 times, avg 4 ms)
 79892 ms: std::_List_base<$> (27140 times, avg 2 ms)
 75131 ms: std::map<$> (11752 times, avg 6 ms)
 65214 ms: std::allocator<$> (66622 times, avg 0 ms)
...

**** Functions that took longest to compile:
  7206 ms: OfdmaAckSequenceTest::CheckResults(ns3::Time, ns3::Time, unsigned ch... (~/ns-3-dev/src/wifi/test/wifi-mac-ofdma-test.cc)
  6146 ms: PieQueueDiscTestCase::RunPieTest(ns3::QueueSizeUnit) (~/ns-3-dev/src/traffic-control/test/pie-queue-disc-test-suite.cc)
...

**** Function sets that took longest to compile / optimize:
14801 ms: std::__cxx11::basic_string<$> ns3::CallbackImplBase::GetCppTypeid<$>() (2342 times, avg 6 ms)
12013 ms: ns3::CallbackImpl<$>::DoGetTypeid[abi:cxx11]() (1283 times, avg 9 ms)
10034 ms: ns3::Ptr<$>::~Ptr() (5975 times, avg 1 ms)
 8932 ms: ns3::Callback<$>::DoAssign(ns3::Ptr<$>) (591 times, avg 15 ms)
 6318 ms: ns3::CallbackImpl<$>::DoGetTypeid() (431 times, avg 14 ms)
...

*** Expensive headers:
293609 ms: ~/ns-3-dev/build/include/ns3/log.h (included 1404 times, avg 209 ms), included via:
  cqa-ff-mac-scheduler.cc.o  (758 ms)
  ipv6-list-routing.cc.o  (746 ms)
  ...

239884 ms: ~/ns-3-dev/build/include/ns3/nstime.h (included 1093 times, avg 219 ms), included via:
  lte-enb-rrc.cc.o lte-enb-rrc.h  (891 ms)
  wifi-acknowledgment.cc.o wifi-acknowledgment.h  (877 ms)
  ...

216218 ms: ~/ns-3-dev/build/include/ns3/object.h (included 1205 times, avg 179 ms), included via:
  energy-source-container.cc.o energy-source-container.h energy-source.h  (1192 ms)
  phased-array-model.cc.o phased-array-model.h  (1135 ms)
  ...

206801 ms: ~/ns-3-dev/build/include/ns3/core-module.h (included 195 times, avg 1060 ms), included via:
  sample-show-progress.cc.o  (1973 ms)
  length-example.cc.o  (1848 ms)
  ...

193116 ms: /usr/bin/../lib/gcc/x86_64-linux-gnu/11/../../../../include/c++/11/bits/basic_string.h (included 1499 times, avg 128 ms), included via:
  model-typeid-creator.h attribute-default-iterator.h type-id.h attribute.h string  (250 ms)
  li-ion-energy-source-helper.h energy-model-helper.h attribute.h string  (243 ms)
  ...

185075 ms: /usr/bin/../lib/gcc/x86_64-linux-gnu/11/../../../../include/c++/11/bits/ios_base.h (included 1495 times, avg 123 ms), included via:
  iomanip  (403 ms)
  mpi-test-fixtures.h iomanip  (364 ms)
  ...

169464 ms: ~/ns-3-dev/build/include/ns3/ptr.h (included 1399 times, avg 121 ms), included via:
  lte-test-rlc-um-e2e.cc.o config.h  (568 ms)
  lte-test-rlc-um-transmitter.cc.o simulator.h event-id.h  (560 ms)
  ...


  done in 2.8s.
The output printed out contain a summary of time spent on parsing and on code generation, along
with multiple lists for different tracked categories. From the summary, it is clear that parsing times
are very high when compared to the optimization time (-O3
Precompiled headers (-DNS3_PRECOMPILE_HEADERS=ON drastically speed up parsing times ,
however, they can increase ccache misses, reducing the time of the first
compilation at the cost of increasing recompilation times.
4.9.4.3. NinjaTracingIf the Ninja generator is being used (./ns3 configure -G Ninja NinjaTracing
utility is used to convert the log format into a tracing Json file.
The following steps show how it can be used:
~/ns-3-dev$ ./ns3 configure --enable-ninja-tracing
~/ns-3-dev$ ./ns3 build
~/ns-3-dev$ ./ns3 build ninjaTrace
The output ninja_performance_trace.json ~/ns-3-dev about:tracing Perfetto UI .
It can also be used in conjunction with the Clang time-trace feature for more granular
information from within the compiler and linker.
~/ns-3-dev$ CXX=clang++ ./ns3 configure --enable-ninja-tracing -- -DNS3_CLANG_TIMETRACE=ON
~/ns-3-dev$ ./ns3 build
~/ns-3-dev$ ./ns3 build ninjaTrace
4.9.5. CMake ProfilerCMake has a built-in tracer that permits tracking hotspots in the CMake files slowing down the
project configuration. To use the tracer, call cmake directly from a clean CMake cache directory:
~/ns-3-dev/cmake-cache$ cmake .. --profiling-format=google-trace --profiling-output=../cmake_performance_trace.log
Or using the ns3 wrapper:
~/ns-3-dev$ ./ns3 configure --trace-performance
A cmake_performance_trace.log about:tracing Perfetto UI .
After opening the trace file, select the traced process and click on
any of the blocks to inspect the different stacks and find hotspots.
An auxiliary panel containing the function/macro name, arguments
and location can be shown, providing enough information to trace
back the location of each specific call.
Just like in performance profilers, visual inspection makes it easier
to identify hotspots and focus on trying to optimize what matters most.
The trace below was generated during the discussion of issue #588 ,
while investigating the long configuration times, especially when using HDDs.
The single largest contributor was CMake’s configure_file
In MR911 , alternatives such as stub headers that include the original header
files, keeping them in their respective modules, and symlinking headers to the
output directory were used to reduce the configuration overhead.
Note: when testing I/O bottlenecks, you may want to drop filesystem caches,
otherwise the cache may hide the issues. In Linux, the caches can be cleared
using the following command:
~/ns-3-dev$ sudo sysctl vm.drop_caches=3