
35.3. Testing Documentation
At present, most of the available documentation about testing and validation exists in publications, some of which are referenced below.
35.3.1. Error model
Validation results for the 802.11b error model are available in this technical report
Two clarifications on the results should be noted. First, Figure 1-4
of the above reference
corresponds to the ns-3 NIST BER model. In the program in the
Appendix of the paper (80211b.c), there are two constants used to generate
the data. The first, packet size, is set to 1024 bytes. The second,
“noise”, is set to a value of 7 dB; this was empirically picked to align
the curves the best with the reported data from the CMU testbed. Although
a value of 1.55 dB would correspond to the reported -99 dBm noise floor
from the CMU paper, a noise figure of 7 dB results in the best fit with the
CMU experimental data. This default of 7 dB is the RxNoiseFigure in the
ns3::YansWifiPhy model. Other values for noise figure will shift the
curves leftward or rightward but not change the slope.
The curves can be reproduced by running the wifi-clear-channel-cmu.cc
example program in the examples/wireless directory, and the figure produced
(when GNU Scientific Library (GSL) is enabled) is reproduced below in
Figure Clear channel (AWGN) error model for 802.11b.
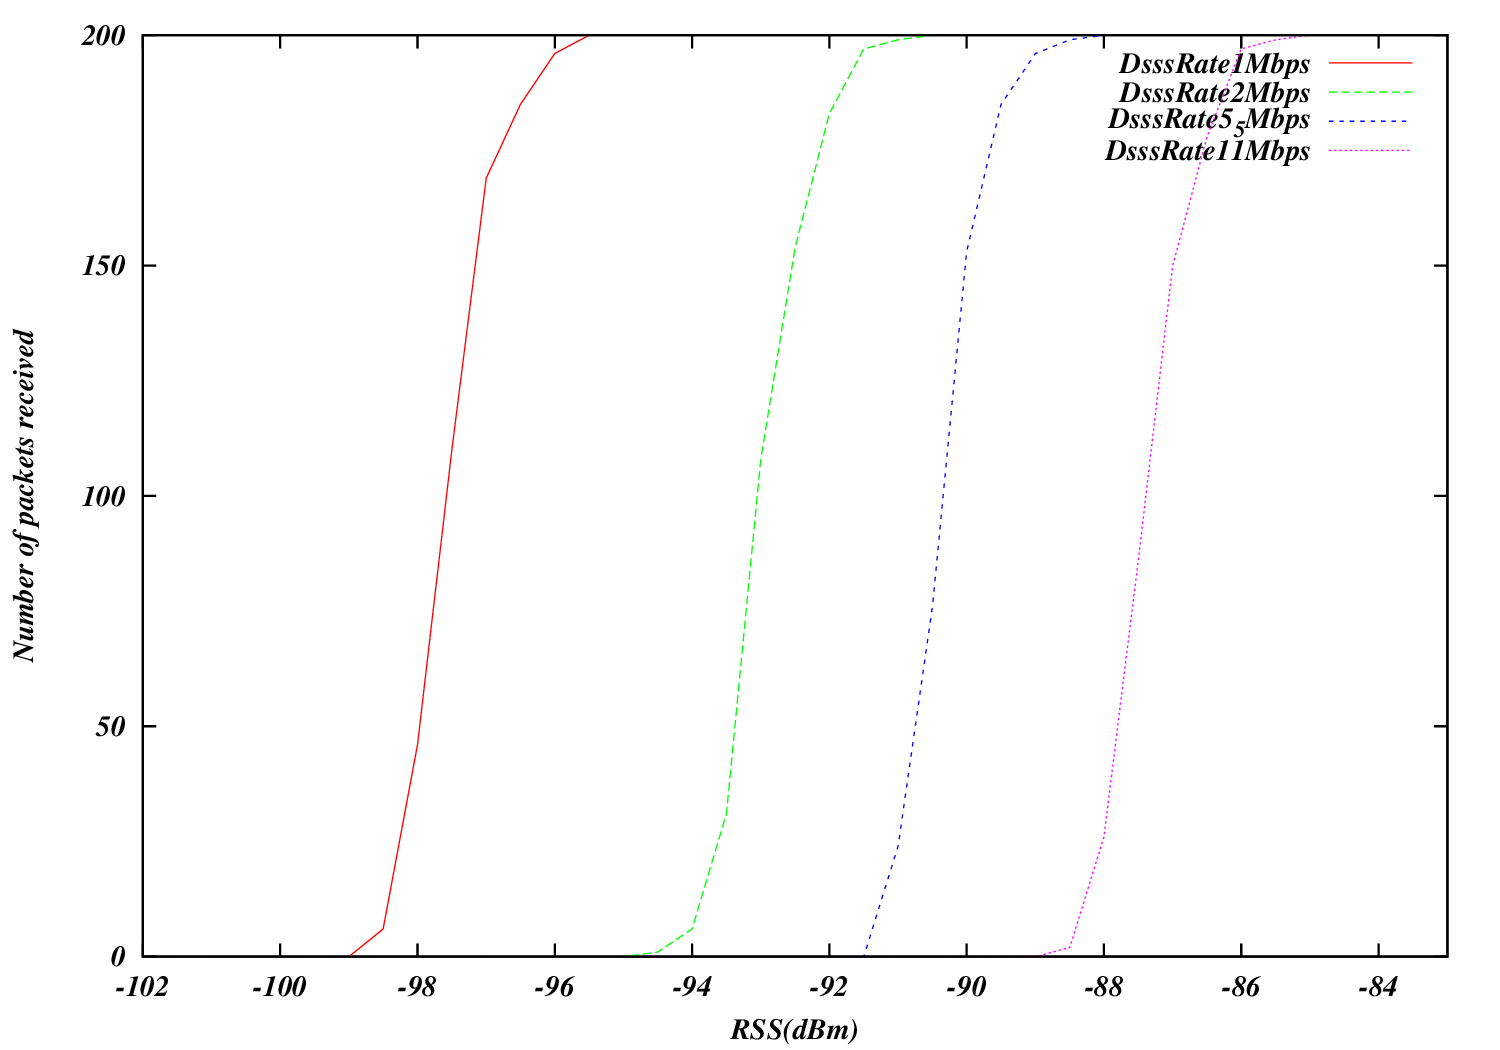
Clear channel (AWGN) error model for 802.11b
Validation results for the 802.11a/g OFDM error model are available in this
technical report. The curves
can be reproduced by running the wifi-ofdm-validation.cc example program
in the examples/wireless directory, and the figure is reproduced below
in Figure Frame error rate (NIST model) for 802.11a/g (OFDM) Wi-Fi.
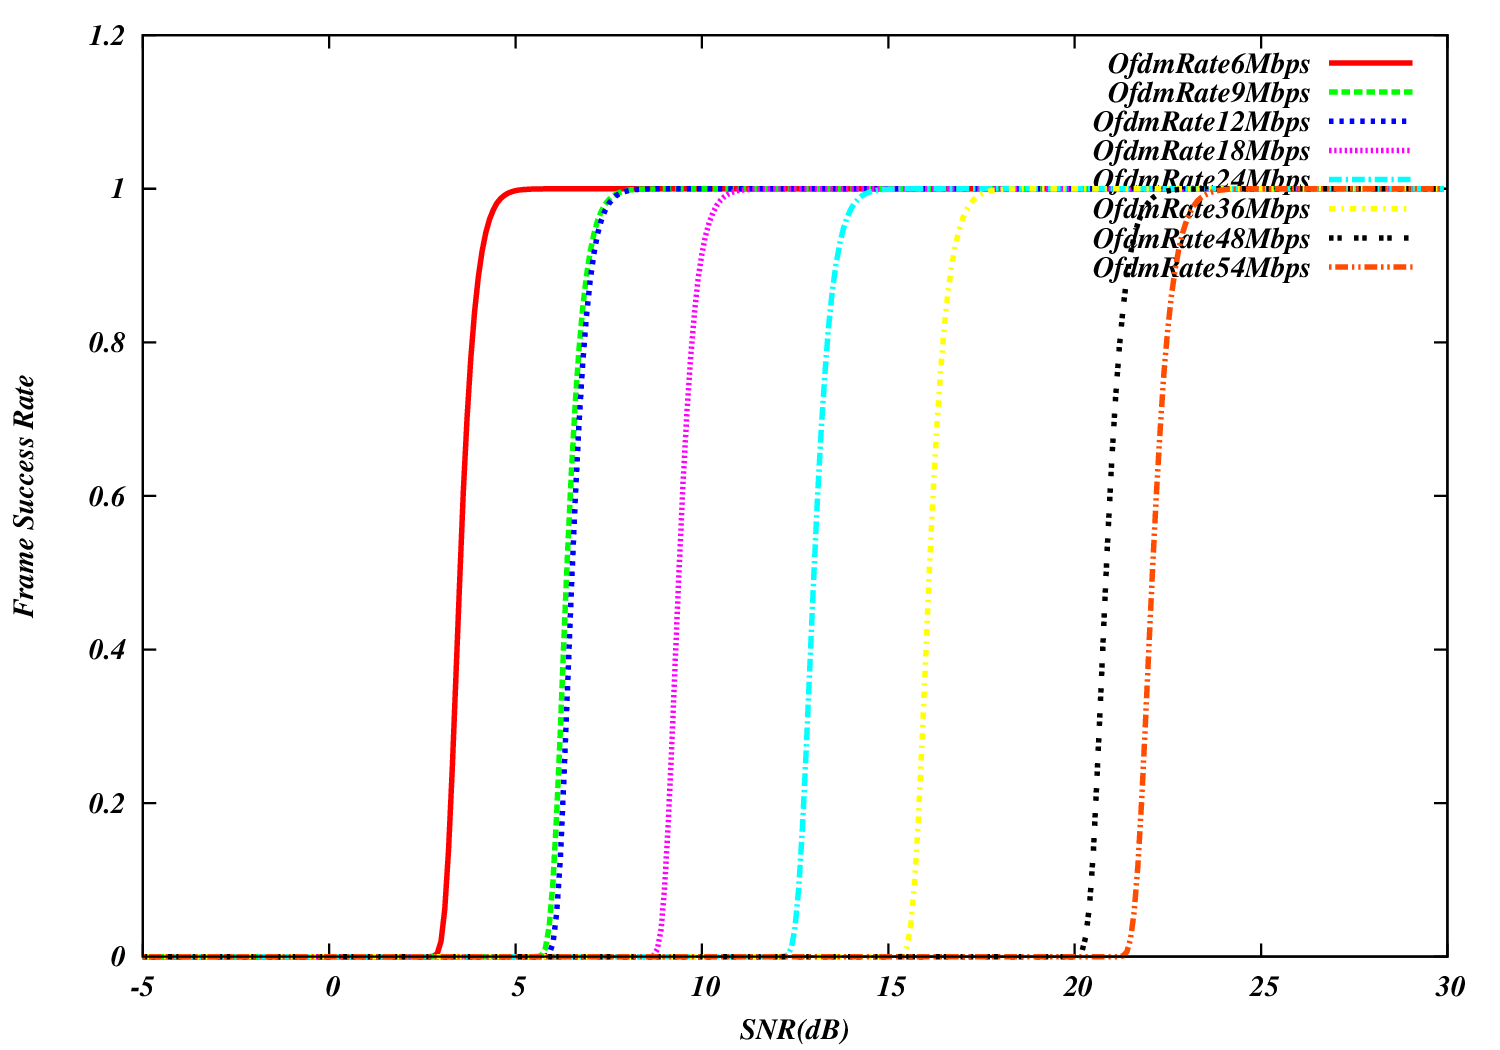
Frame error rate (NIST model) for 802.11a/g (OFDM) Wi-Fi
Similar curves for 802.11n/ac/ax can be obtained by running the wifi-ofdm-ht-validation.cc,
wifi-ofdm-vht-validation.cc and wifi-ofdm-he-validation.cc example programs
in the examples/wireless directory, and the figures are reproduced below
in Figure Frame error rate (NIST model) for 802.11n (HT OFDM) Wi-Fi, Figure Frame error rate (NIST model) for 802.11ac (VHT OFDM) Wi-Fi
and Figure Frame error rate (NIST model) for 802.11ax (HE OFDM) Wi-Fi, respectively.
There is no validation for those curves yet.
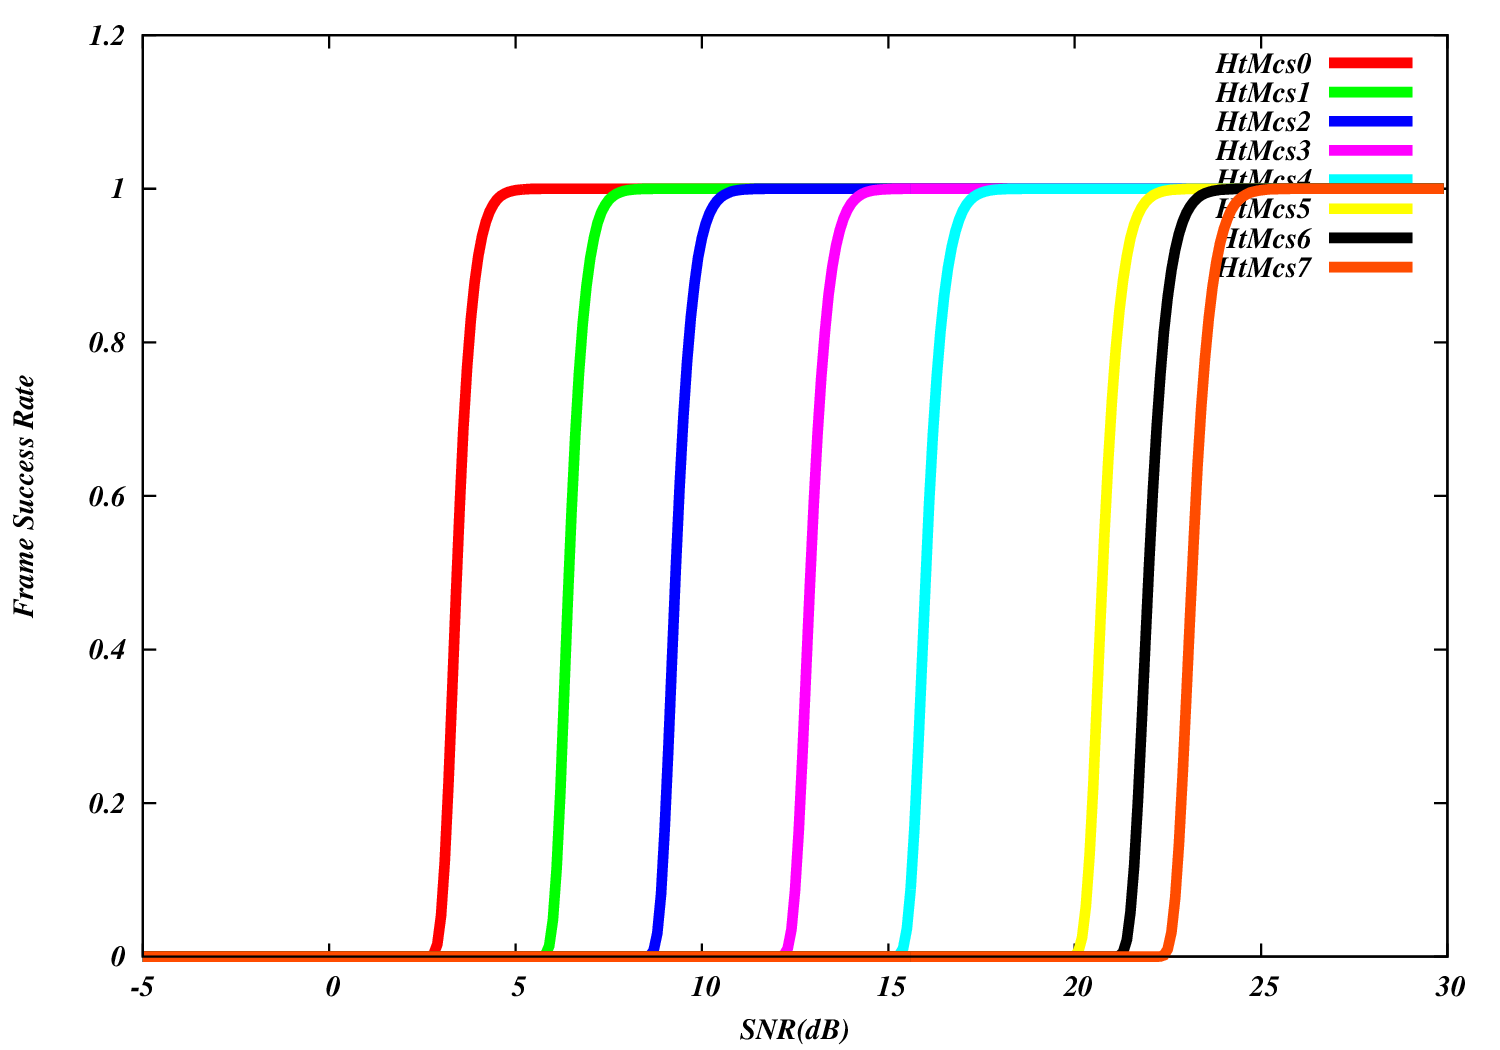
Frame error rate (NIST model) for 802.11n (HT OFDM) Wi-Fi
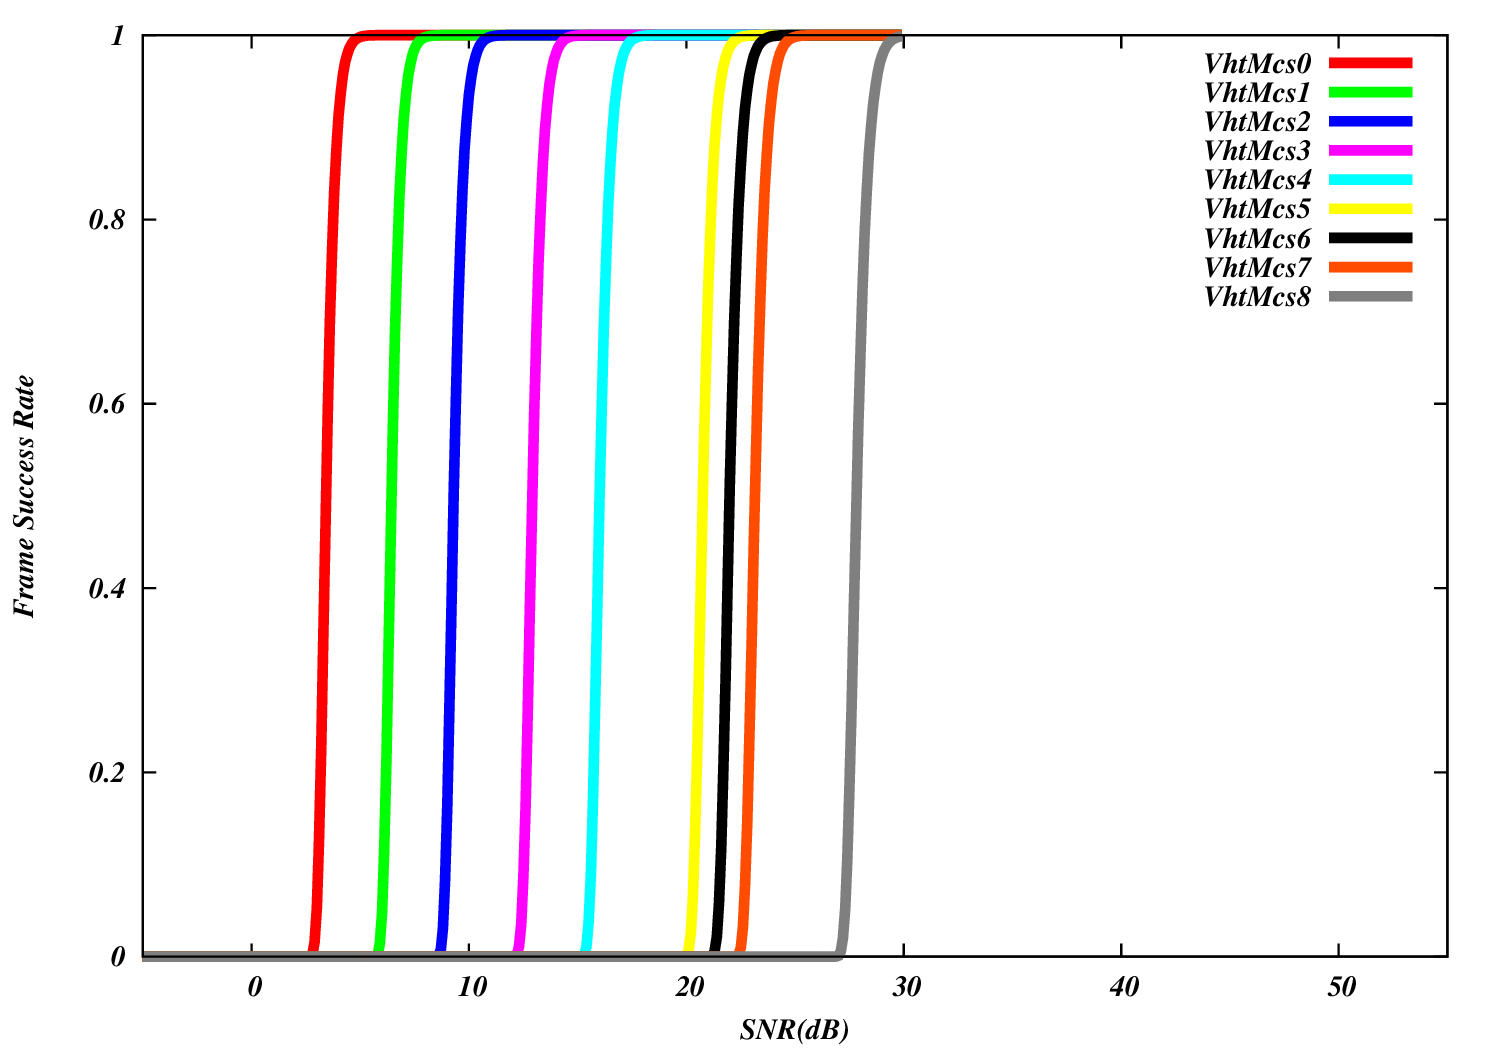
Frame error rate (NIST model) for 802.11ac (VHT OFDM) Wi-Fi
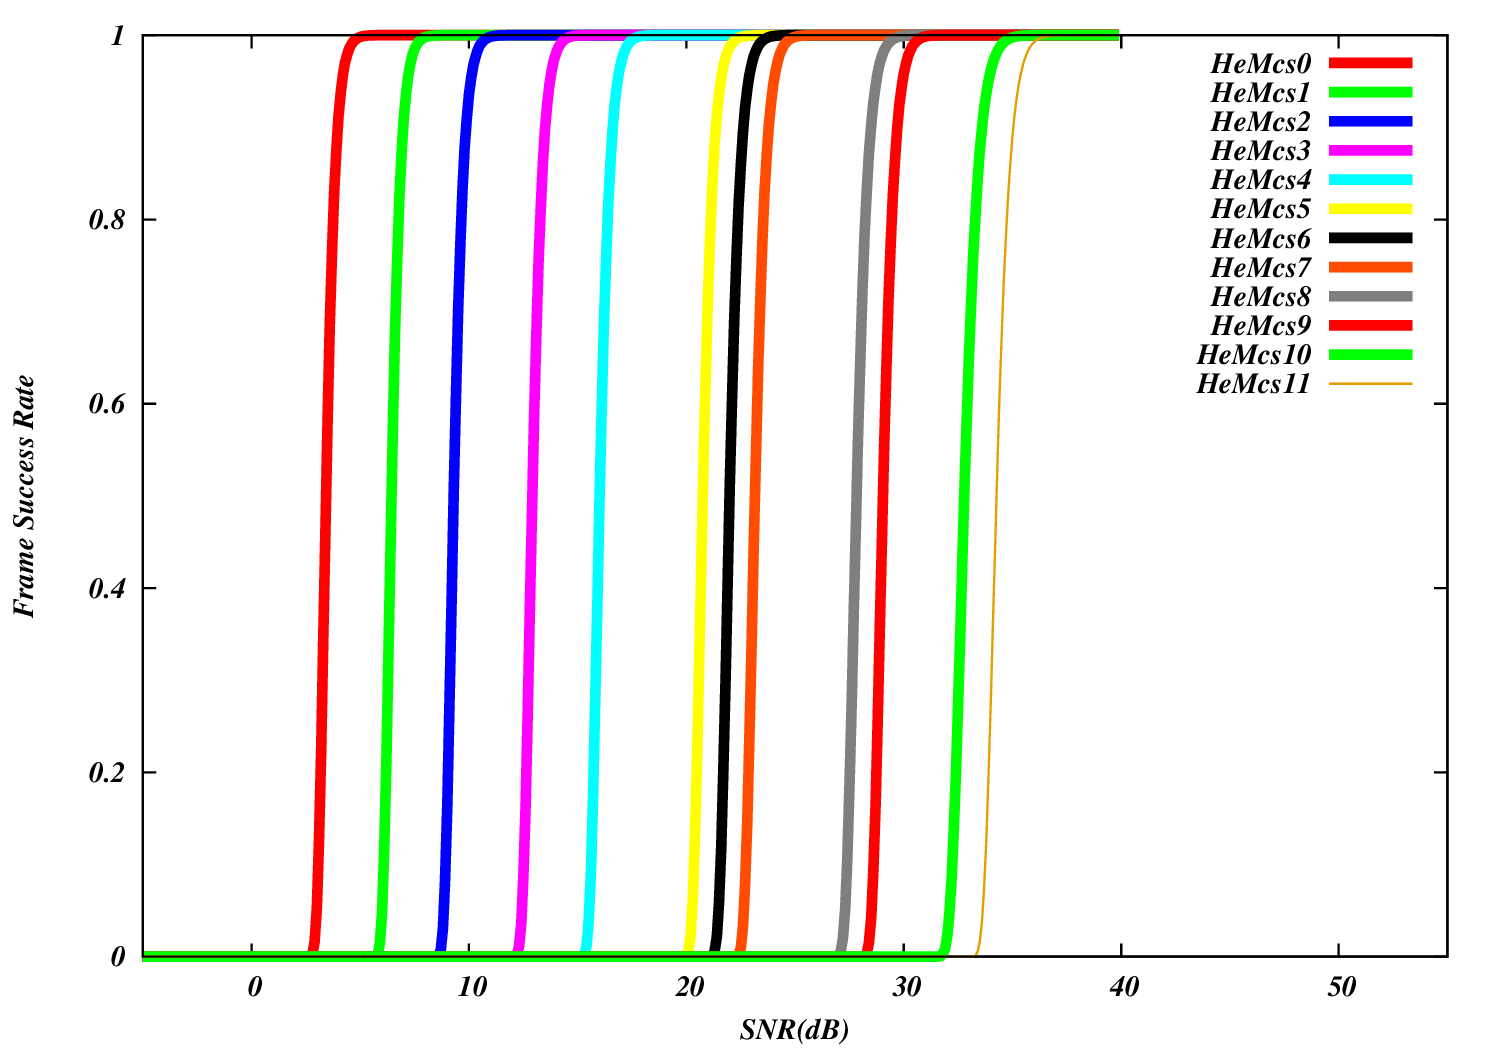
Frame error rate (NIST model) for 802.11ax (HE OFDM) Wi-Fi
35.3.2. MAC validation
Validation of the 802.11 DCF MAC layer has been performed in [baldo2010].
802.11 PCF operation has been verified by running ‘wifi-pcf’ example with PCAP files generation enabled, and observing the frame exchange using Wireshark.
35.3.3. SpectrumWiFiPhy
The SpectrumWifiPhy implementation has been verified to produce equivalent results to the legacy YansWifiPhy by using the saturation and packet error rate programs (described below) and toggling the implementation between the two physical layers.
A basic unit test is provided using injection of hand-crafted packets to a receiving Phy object, controlling the timing and receive power of each packet arrival and checking the reception results. However, most of the testing of this Phy implementation has been performed using example programs described below, and during the course of a (separate) LTE/Wi-Fi coexistence study not documented herein.
35.3.3.1. Saturation performance
The program examples/wireless/wifi-spectrum-saturation-example.cc
allows user to select either the SpectrumWifiPhy or YansWifiPhy for
saturation tests. The wifiType can be toggled by the argument
'--wifiType=ns3::YansWifiPhy' or --wifiType=ns3::SpectrumWifiPhy'
There isn’t any difference in the output, which is to be expected because this test is more of a test of the DCF than the physical layer.
By default, the program will use the SpectrumWifiPhy and will run for 10 seconds of saturating UDP data, with 802.11n features enabled. It produces this output for the main 802.11n rates (with short and long guard intervals):
wifiType: ns3::SpectrumWifiPhy distance: 1m
index   MCS   width Rate (Mb/s) Tput (Mb/s) Received
    0     0      20       6.5     5.81381    4937
    1     1      20        13     11.8266   10043
    2     2      20      19.5     17.7935   15110
    3     3      20        26     23.7958   20207
    4     4      20        39     35.7331   30344
    5     5      20        52     47.6174   40436
    6     6      20      58.5     53.6102   45525
    7     7      20        65     59.5501   50569
  ...
   63    15      40       300     254.902  216459
The above output shows the first 8 (of 32) modes, and last mode, that will be output from the program. The first 8 modes correspond to short guard interval disabled and channel bonding disabled. The subsequent 24 modes run by this program are variations with short guard interval enabled (cases 9-16), and then with channel bonding enabled and short guard first disabled then enabled (cases 17-32). Cases 33-64 repeat the same configurations but for two spatial streams (MIMO abstraction).
When run with the legacy YansWifiPhy, as in ./ns3 run "wifi-spectrum-saturation-example --wifiType=ns3::YansWifiPhy", the same output is observed:
wifiType: ns3::YansWifiPhy distance: 1m
index   MCS   width Rate (Mb/s) Tput (Mb/s) Received
    0     0      20       6.5     5.81381    4937
    1     1      20        13     11.8266   10043
    2     2      20      19.5     17.7935   15110
    3     3      20        26     23.7958   20207
  ...
This is to be expected since YansWifiPhy and SpectrumWifiPhy use the same error rate model in this case.
35.3.3.2. Packet error rate performance
The program examples/wireless/wifi-spectrum-per-example.cc allows users
to select either SpectrumWifiPhy or YansWifiPhy, as above, and select
the distance between the nodes, and to log the reception statistics and
received SNR (as observed by the WifiPhy::MonitorSnifferRx trace source), using a
Friis propagation loss model. The transmit power is lowered from the default
of 40 mW (16 dBm) to 1 dBm to lower the baseline SNR; the distance between
the nodes can be changed to further change the SNR. By default, it steps
through the same index values as in the saturation example (0 through 31)
for a 50m distance, for 10 seconds of simulation time, producing output such as:
wifiType: ns3::SpectrumWifiPhy distance: 50m; time: 10; TxPower: 1 dBm (1.3 mW)
index   MCS  Rate (Mb/s) Tput (Mb/s) Received Signal (dBm) Noise (dBm) SNR (dB)
    0     0      6.50        5.77    7414      -79.71      -93.97       14.25
    1     1     13.00       11.58   14892      -79.71      -93.97       14.25
    2     2     19.50       17.39   22358      -79.71      -93.97       14.25
    3     3     26.00       22.96   29521      -79.71      -93.97       14.25
    4     4     39.00        0.00       0         N/A         N/A         N/A
    5     5     52.00        0.00       0         N/A         N/A         N/A
    6     6     58.50        0.00       0         N/A         N/A         N/A
    7     7     65.00        0.00       0         N/A         N/A         N/A
As in the above saturation example, running this program with YansWifiPhy will yield identical output.
35.3.3.3. Interference performance
The program examples/wireless/wifi-spectrum-per-interference.cc is based
on the previous packet error rate example, but copies over the
WaveformGenerator from the unlicensed LTE interferer test, to allow
users to inject a non-Wi-Fi signal (using the --waveformPower argument)
from the command line. Another difference with respect to the packet
error rate example program is that the transmit power is set back to the
default of 40 mW (16 dBm). By default, the interference generator is off,
and the program should behave similarly to the other packet error rate example,
but by adding small
amounts of power (e.g. --waveformPower=0.001), one will start to observe
SNR degradation and frame loss.
Some sample output with default arguments (no interference) is:
./ns3 run "wifi-spectrum-per-interference"

wifiType: ns3::SpectrumWifiPhy distance: 50m; time: 10; TxPower: 16 dBm (40 mW)
index   MCS  Rate (Mb/s) Tput (Mb/s) Received Signal (dBm)Noi+Inf(dBm) SNR (dB)
    0     0      6.50        5.77    7414      -64.69      -93.97       29.27
    1     1     13.00       11.58   14892      -64.69      -93.97       29.27
    2     2     19.50       17.39   22358      -64.69      -93.97       29.27
    3     3     26.00       23.23   29875      -64.69      -93.97       29.27
    4     4     39.00       34.90   44877      -64.69      -93.97       29.27
    5     5     52.00       46.51   59813      -64.69      -93.97       29.27
    6     6     58.50       52.39   67374      -64.69      -93.97       29.27
    7     7     65.00       58.18   74819      -64.69      -93.97       29.27
  ...
while a small amount of waveform power will cause frame losses to occur at higher order modulations, due to lower SNR:
./ns3 run "wifi-spectrum-per-interference --waveformPower=0.001"

wifiType: ns3::SpectrumWifiPhy distance: 50m; sent: 1000 TxPower: 16 dBm (40 mW)
index   MCS Rate (Mb/s) Tput (Mb/s) Received Signal (dBm)Noi+Inf(dBm)  SNR (dB)
    0     0      6.50        5.77    7414      -64.69      -80.08       15.38
    1     1     13.00       11.58   14892      -64.69      -80.08       15.38
    2     2     19.50       17.39   22358      -64.69      -80.08       15.38
    3     3     26.00       23.23   29873      -64.69      -80.08       15.38
    4     4     39.00        0.41     531      -64.69      -80.08       15.38
    5     5     52.00        0.00       0         N/A         N/A         N/A
    6     6     58.50        0.00       0         N/A         N/A         N/A
    7     7     65.00        0.00       0         N/A         N/A         N/A
  ...
If ns3::YansWifiPhy is selected as the wifiType, the waveform generator will not be enabled because only transmitters of type YansWifiPhy may be connected to a YansWifiChannel.
The interference signal as received by the sending node is typically below the default -62 dBm CCA Mode 1 threshold in this example. If it raises above, the sending node will suppress all transmissions.
35.3.4. Bianchi validation
The program src/wifi/examples/wifi-bianchi.cc allows user to
compare ns-3 simulation results against the Bianchi model
presented in [bianchi2000] and [bianchi2005].
The MATLAB code used to generate the Bianchi model,
as well as the generated outputs, are provided in
the folder src/wifi/examples/reference.
User can regenerate Bianchi results by running
generate_bianchi.m in MATLAB.
By default, the program src/wifi/examples/wifi-bianchi.cc
simulates an 802.11a adhoc ring scenario, with a PHY rate set to
54 Mbit/s, and loop from 5 stations to 50 stations, by a step of
5 stations. It generates a plt file, which allows user to quickly
generate an eps file using gnuplot and visualize the graph.
./ns3 run "wifi-bianchi"
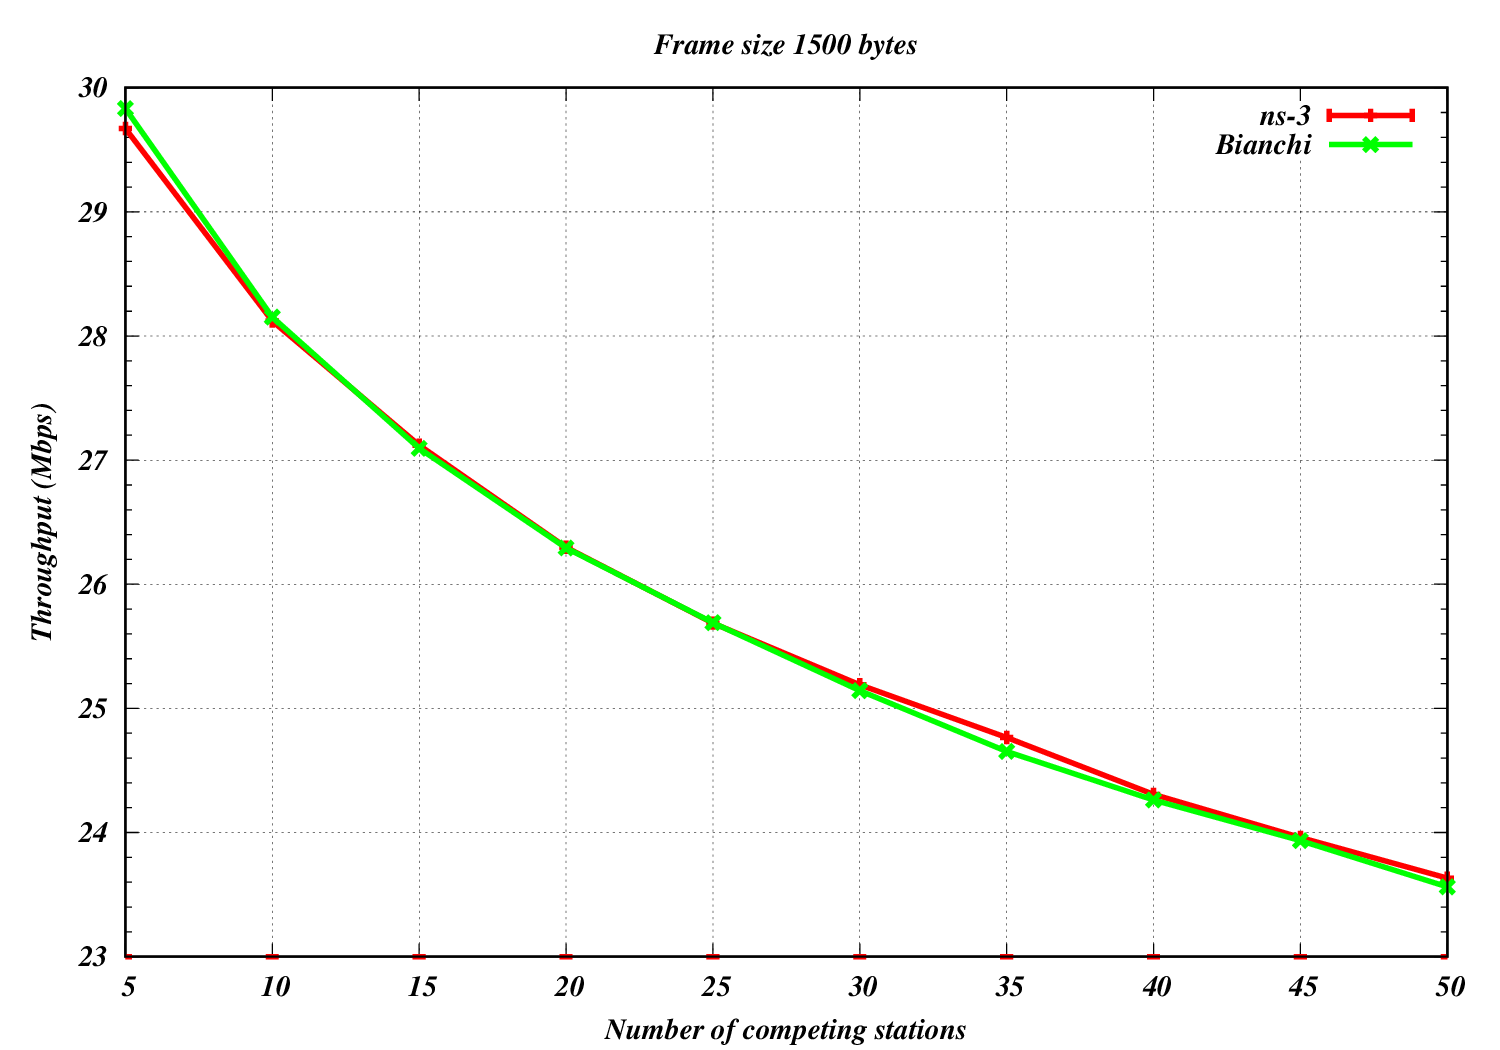
Bianchi throughput validation results for 802.11a 54 Mbps in adhoc configuration
The user has the possibility to select the standard (only 11a, 11b or 11g currently supported), to select the PHY rate (in Mbit/s), as well as to choose between an adhoc or an infrastructure configuration.
When run for 802.11g 6 Mbit/s in infrastructure mode, the output is:
./ns3 run "wifi-bianchi --standard=11g --phyRate=6 --duration=500 --infra"
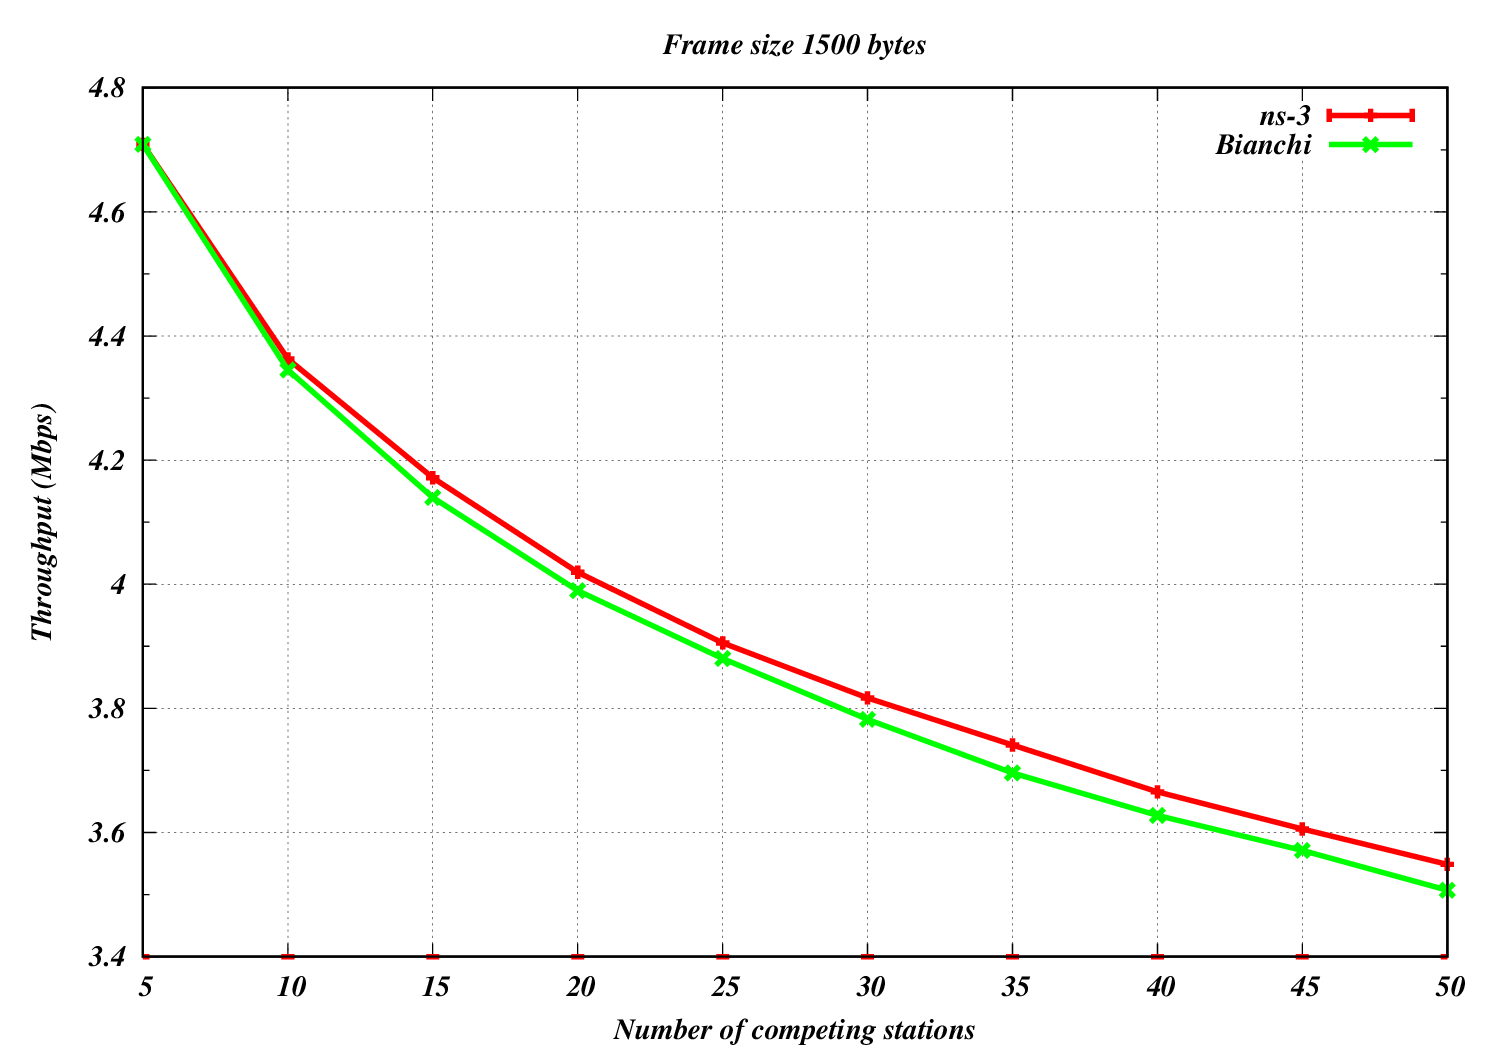
Bianchi throughput validation results for 802.11g 6 Mbps in infrastructure configuration
35.3.5. Multi-user transmissions validation
The implementation of the OFDMA support has been validated against a theoretical model [magrin2021mu] .
A preliminary evaluation of the usage of OFDMA in 802.11ax, in terms of latency in non-saturated conditions, throughput in saturated conditions and transmission range with UL OFDMA, is provided in [avallone2021wcm] .
35.3.6. Channel Occupancy Helper Testing
The Channel Occupancy helper (WifiCoTraceHelper class) has been tested by comparing the occupancy results for single packet transmissions of various sizes (one, two, or three symbols) with the results predicted by offline calculation of the expected values. Additionally, the helper has been validated in saturated traffic conditions as described in the research publication “Use of Channel Occupancy for Multi Link WiFi 7 Scheduler Design in ns-3” to be presented at COMSNETS 25 [kumar2025comsnets] .