
|
A Discrete-Event Network Simulator
|
Tutorial |
|
|
A Discrete-Event Network Simulator
|
Tutorial |
As mentioned in the Using the Tracing System section, the whole point of running an ns-3 simulation is to generate output for study. You have two basic strategies to work with in ns-3: using generic pre-defined bulk output mechanisms and parsing their content to extract interesting information; or somehow developing an output mechanism that conveys exactly (and perhaps only) the information wanted.
Using pre-defined bulk output mechanisms has the advantage of not requiring any changes to ns-3, but it may require writing scripts to parse and filter for data of interest. Often, pcap or NS_LOG output messages are gathered during simulation runs and separately run through scripts that use grep, sed or awk to parse the messages and reduce and transform the data to a manageable form. Programs must be written to do the transformation, so this does not come for free. Of course, if the information of interest does not exist in any of the pre-defined output mechanisms, this approach fails.
If you need to add some tidbit of information to the pre-defined bulk mechanisms, this can certainly be done; and if you use one of the ns-3 mechanisms, you may get your code added as a contribution.
ns-3 provides another mechanism, called Tracing, that avoids some of the problems inherent in the bulk output mechanisms. It has several important advantages. First, you can reduce the amount of data you have to manage by only tracing the events of interest to you (for large simulations, dumping everything to disk for post-processing can create I/O bottlenecks). Second, if you use this method, you can control the format of the output directly so you avoid the postprocessing step with sed or awk script. If you desire, your output can be formatted directly into a form acceptable by gnuplot, for example. You can add hooks in the core which can then be accessed by other users, but which will produce no information unless explicitly asked to do so. For these reasons, we believe that the ns-3 tracing system is the best way to get information out of a simulation and is also therefore one of the most important mechanisms to understand in ns-3.
There are many ways to get information out of a program. The most straightforward way is to just directly print the information to the standard output, as in,
#include <iostream>
...
void
SomeFunction (void)
{
  uint32_t x = SOME_INTERESTING_VALUE;
  ...
  std::cout << "The value of x is " << x << std::endl;
  ...
}
Nobody is going to prevent you from going deep into the core of ns-3 and adding print statements. This is insanely easy to do and, after all, you have complete control of your own ns-3 branch. This will probably not turn out to be very satisfactory in the long term, though.
As the number of print statements increases in your programs, the task of dealing with the large number of outputs will become more and more complicated. Eventually, you may feel the need to control what information is being printed in some way; perhaps by turning on and off certain categories of prints, or increasing or decreasing the amount of information you want. If you continue down this path you may discover that you have re-implemented the NS_LOG mechanism. In order to avoid that, one of the first things you might consider is using NS_LOG itself.
We mentioned above that one way to get information out of ns-3 is to parse existing NS_LOG output for interesting information. If you discover that some tidbit of information you need is not present in existing log output, you could edit the core of ns-3 and simply add your interesting information to the output stream. Now, this is certainly better than adding your own print statements since it follows ns-3 coding conventions and could potentially be useful to other people as a patch to the existing core.
Let’s pick a random example. If you wanted to add more logging to the ns-3 TCP socket (tcp-socket-base.cc) you could just add a new message down in the implementation. Notice that in TcpSocketBase::ReceivedAck() there is no log message for the no ACK case. You could simply add one, changing the code from:
/** Process the newly received ACK */
void
TcpSocketBase::ReceivedAck (Ptr<Packet> packet, const TcpHeader& tcpHeader)
{
  NS_LOG_FUNCTION (this << tcpHeader);

  // Received ACK. Compare the ACK number against highest unacked seqno
  if (0 == (tcpHeader.GetFlags () & TcpHeader::ACK))
    { // Ignore if no ACK flag
    }
  ...
to add a new NS_LOG_LOGIC in the appropriate statement:
/** Process the newly received ACK */
void
TcpSocketBase::ReceivedAck (Ptr<Packet> packet, const TcpHeader& tcpHeader)
{
  NS_LOG_FUNCTION (this << tcpHeader);

  // Received ACK. Compare the ACK number against highest unacked seqno
  if (0 == (tcpHeader.GetFlags () & TcpHeader::ACK))
    { // Ignore if no ACK flag
      NS_LOG_LOGIC ("TcpSocketBase " << this << " no ACK flag");
    }
  ...
This may seem fairly simple and satisfying at first glance, but something to consider is that you will be writing code to add the NS_LOG statement and you will also have to write code (as in grep, sed or awk scripts) to parse the log output in order to isolate your information. This is because even though you have some control over what is output by the logging system, you only have control down to the log component level.
If you are adding code to an existing module, you will also have to live with the output that every other developer has found interesting. You may find that in order to get the small amount of information you need, you may have to wade through huge amounts of extraneous messages that are of no interest to you. You may be forced to save huge log files to disk and process them down to a few lines whenever you want to do anything.
Since there are no guarantees in ns-3 about the stability of NS_LOG output, you may also discover that pieces of log output on which you depend disappear or change between releases. If you depend on the structure of the output, you may find other messages being added or deleted which may affect your parsing code.
For these reasons, we consider prints to std::cout and NS_LOG messages to be quick and dirty ways to get more information out of ns-3.
It is desirable to have a stable facility using stable APIs that allow one to reach into the core system and only get the information required. It is desirable to be able to do this without having to change and recompile the core system. Even better would be a system that notified the user when an item of interest changed or an interesting event happened so the user doesn’t have to actively poke around in the system looking for things.
The ns-3 tracing system is designed to work along those lines and is well-integrated with the Attribute and Config subsystems allowing for relatively simple use scenarios.
The ns-3 tracing system is built on the concepts of independent tracing sources and tracing sinks; along with a uniform mechanism for connecting sources to sinks.
Trace sources are entities that can signal events that happen in a simulation and provide access to interesting underlying data. For example, a trace source could indicate when a packet is received by a net device and provide access to the packet contents for interested trace sinks. A trace source might also indicate when an interesting state change happens in a model. For example, the congestion window of a TCP model is a prime candidate for a trace source.
Trace sources are not useful by themselves; they must be connected to other pieces of code that actually do something useful with the information provided by the source. The entities that consume trace information are called trace sinks. Trace sources are generators of events and trace sinks are consumers. This explicit division allows for large numbers of trace sources to be scattered around the system in places which model authors believe might be useful.
There can be zero or more consumers of trace events generated by a trace source. One can think of a trace source as a kind of point-to-multipoint information link. Your code looking for trace events from a particular piece of core code could happily coexist with other code doing something entirely different from the same information.
Unless a user connects a trace sink to one of these sources, nothing is output. By using the tracing system, both you and other people at the same trace source are getting exactly what they want and only what they want out of the system. Neither of you are impacting any other user by changing what information is output by the system. If you happen to add a trace source, your work as a good open-source citizen may allow other users to provide new utilities that are perhaps very useful overall, without making any changes to the ns-3 core.
Let’s take a few minutes and walk through a simple tracing example. We are going to need a little background on Callbacks to understand what is happening in the example, so we have to take a small detour right away.
The goal of the Callback system in ns-3 is to allow one piece of code to call a function (or method in C++) without any specific inter-module dependency. This ultimately means you need some kind of indirection – you treat the address of the called function as a variable. This variable is called a pointer-to-function variable. The relationship between function and pointer-to-function pointer is really no different that that of object and pointer-to-object.
In C the canonical example of a pointer-to-function is a pointer-to-function-returning-integer (PFI). For a PFI taking one int parameter, this could be declared like,
int (*pfi)(int arg) = 0;
What you get from this is a variable named simply “pfi” that is initialized to the value 0. If you want to initialize this pointer to something meaningful, you have to have a function with a matching signature. In this case, you could provide a function that looks like,
int MyFunction (int arg) {}
If you have this target, you can initialize the variable to point to your function:
pfi = MyFunction;
You can then call MyFunction indirectly using the more suggestive form of the call,
int result = (*pfi) (1234);
This is suggestive since it looks like you are dereferencing the function pointer just like you would dereference any pointer. Typically, however, people take advantage of the fact that the compiler knows what is going on and will just use a shorter form,
int result = pfi (1234);
This looks like you are calling a function named “pfi,” but the compiler is smart enough to know to call through the variable pfi indirectly to the function MyFunction.
Conceptually, this is almost exactly how the tracing system will work. Basically, a trace source is a callback. When a trace sink expresses interest in receiving trace events, it adds a Callback to a list of Callbacks internally held by the trace source. When an interesting event happens, the trace source invokes its operator() providing zero or more parameters. The operator() eventually wanders down into the system and does something remarkably like the indirect call you just saw. It provides zero or more parameters (the call to “pfi” above passed one parameter to the target function MyFunction).
The important difference that the tracing system adds is that for each trace source there is an internal list of Callbacks. Instead of just making one indirect call, a trace source may invoke multiple. When a trace sink expresses interest in notifications from a trace source, it basically just arranges to add its own function to the callback list.
If you are interested in more details about how this is actually arranged in ns-3, feel free to peruse the Callback section of the manual.
We have provided some code to implement what is really the simplest example of tracing that can be assembled. You can find this code in the tutorial directory as fourth.cc. Let’s walk through it.
/* -*- Mode:C++; c-file-style:"gnu"; indent-tabs-mode:nil; -*- */
/*
 * This program is free software; you can redistribute it and/or modify
 * it under the terms of the GNU General Public License version 2 as
 * published by the Free Software Foundation;
 *
 * This program is distributed in the hope that it will be useful,
 * but WITHOUT ANY WARRANTY; without even the implied warranty of
 * MERCHANTABILITY or FITNESS FOR A PARTICULAR PURPOSE.  See the
 * GNU General Public License for more details.
 *
 * You should have received a copy of the GNU General Public License
 * along with this program; if not, write to the Free Software
 * Foundation, Inc., 59 Temple Place, Suite 330, Boston, MA  02111-1307  USA
 */

#include "ns3/object.h"
#include "ns3/uinteger.h"
#include "ns3/traced-value.h"
#include "ns3/trace-source-accessor.h"

#include <iostream>

using namespace ns3;
Most of this code should be quite familiar to you. As mentioned above, the trace system makes heavy use of the Object and Attribute systems, so you will need to include them. The first two includes above bring in the declarations for those systems explicitly. You could use the core module header, but this illustrates how simple this all really is.
The file, traced-value.h brings in the required declarations for tracing of data that obeys value semantics. In general, value semantics just means that you can pass the object itself around, rather than passing the address of the object. In order to use value semantics at all you have to have an object with an associated copy constructor and assignment operator available. We extend the requirements to talk about the set of operators that are pre-defined for plain-old-data (POD) types. Operator=, operator++, operator—, operator+, operator==, etc.
What this all really means is that you will be able to trace changes to a C++ object made using those operators.
Since the tracing system is integrated with Attributes, and Attributes work with Objects, there must be an ns-3 Object for the trace source to live in. The next code snippet declares and defines a simple Object we can work with.
class MyObject : public Object
{
public:
  static TypeId GetTypeId (void)
  {
    static TypeId tid = TypeId ("MyObject")
      .SetParent (Object::GetTypeId ())
      .AddConstructor<MyObject> ()
      .AddTraceSource ("MyInteger",
                       "An integer value to trace.",
                       MakeTraceSourceAccessor (&MyObject::m_myInt))
      ;
    return tid;
  }

  MyObject () {}
  TracedValue<int32_t> m_myInt;
};
The two important lines of code, above, with respect to tracing are the .AddTraceSource and the TracedValue declaration of m_myInt.
The .AddTraceSource provides the “hooks” used for connecting the trace source to the outside world through the config system. The TracedValue declaration provides the infrastructure that overloads the operators mentioned above and drives the callback process.
void
IntTrace (int32_t oldValue, int32_t newValue)
{
  std::cout << "Traced " << oldValue << " to " << newValue << std::endl;
}
This is the definition of the trace sink. It corresponds directly to a callback function. Once it is connected, this function will be called whenever one of the overloaded operators of the TracedValue is executed.
We have now seen the trace source and the trace sink. What remains is code to connect the source to the sink.
int
main (int argc, char *argv[])
{
  Ptr<MyObject> myObject = CreateObject<MyObject> ();
  myObject->TraceConnectWithoutContext ("MyInteger", MakeCallback(&IntTrace));

  myObject->m_myInt = 1234;
}
Here we first create the Object in which the trace source lives.
The next step, the TraceConnectWithoutContext, forms the connection between the trace source and the trace sink. Notice the MakeCallback template function. This function does the magic required to create the underlying ns-3 Callback object and associate it with the function IntTrace. TraceConnect makes the association between your provided function and the overloaded operator() in the traced variable referred to by the “MyInteger” Attribute. After this association is made, the trace source will “fire” your provided callback function.
The code to make all of this happen is, of course, non-trivial, but the essence is that you are arranging for something that looks just like the pfi() example above to be called by the trace source. The declaration of the TracedValue<int32_t> m_myInt; in the Object itself performs the magic needed to provide the overloaded operators (++, —, etc.) that will use the operator() to actually invoke the Callback with the desired parameters. The .AddTraceSource performs the magic to connect the Callback to the Config system, and TraceConnectWithoutContext performs the magic to connect your function to the trace source, which is specified by Attribute name.
Let’s ignore the bit about context for now.
Finally, the line,
myObject->m_myInt = 1234;
should be interpreted as an invocation of operator= on the member variable m_myInt with the integer 1234 passed as a parameter.
It turns out that this operator is defined (by TracedValue) to execute a callback that returns void and takes two integer values as parameters — an old value and a new value for the integer in question. That is exactly the function signature for the callback function we provided — IntTrace.
To summarize, a trace source is, in essence, a variable that holds a list of callbacks. A trace sink is a function used as the target of a callback. The Attribute and object type information systems are used to provide a way to connect trace sources to trace sinks. The act of “hitting” a trace source is executing an operator on the trace source which fires callbacks. This results in the trace sink callbacks registering interest in the source being called with the parameters provided by the source.
If you now build and run this example,
$ ./waf --run fourth
you will see the output from the IntTrace function execute as soon as the trace source is hit:
Traced 0 to 1234
When we executed the code, myObject->m_myInt = 1234;, the trace source fired and automatically provided the before and after values to the trace sink. The function IntTrace then printed this to the standard output.
The TraceConnectWithoutContext call shown above in the simple example is actually very rarely used in the system. More typically, the Config subsystem is used to allow selecting a trace source in the system using what is called a config path. We saw an example of this in the previous section where we hooked the “CourseChange” event when we were experimenting with third.cc.
Recall that we defined a trace sink to print course change information from the mobility models of our simulation. It should now be a lot more clear to you what this function is doing.
void
CourseChange (std::string context, Ptr<const MobilityModel> model)
{
  Vector position = model->GetPosition ();
  NS_LOG_UNCOND (context <<
    " x = " << position.x << ", y = " << position.y);
}
When we connected the “CourseChange” trace source to the above trace sink, we used what is called a “Config Path” to specify the source when we arranged a connection between the pre-defined trace source and the new trace sink:
std::ostringstream oss;
oss <<
  "/NodeList/" << wifiStaNodes.Get (nWifi - 1)->GetId () <<
  "/$ns3::MobilityModel/CourseChange";

Config::Connect (oss.str (), MakeCallback (&CourseChange));
Let’s try and make some sense of what is sometimes considered relatively mysterious code. For the purposes of discussion, assume that the node number returned by the GetId() is “7”. In this case, the path above turns out to be,
"/NodeList/7/$ns3::MobilityModel/CourseChange"
The last segment of a config path must be an Attribute of an Object. In fact, if you had a pointer to the Object that has the “CourseChange” Attribute handy, you could write this just like we did in the previous example. You know by now that we typically store pointers to our nodes in a NodeContainer. In the third.cc example, the Nodes of interest are stored in the wifiStaNodes NodeContainer. In fact, while putting the path together, we used this container to get a Ptr<Node> which we used to call GetId() on. We could have used this Ptr<Node> directly to call a connect method directly:
Ptr<Object> theObject = wifiStaNodes.Get (nWifi - 1);
theObject->TraceConnectWithoutContext ("CourseChange", MakeCallback (&CourseChange));
In the third.cc example, we actually want an additional “context” to be delivered along with the Callback parameters (which will be explained below) so we could actually use the following equivalent code,
Ptr<Object> theObject = wifiStaNodes.Get (nWifi - 1);
theObject->TraceConnect ("CourseChange", MakeCallback (&CourseChange));
It turns out that the internal code for Config::ConnectWithoutContext and Config::Connect actually do find a Ptr<Object> and call the appropriate TraceConnect method at the lowest level.
The Config functions take a path that represents a chain of Object pointers. Each segment of a path corresponds to an Object Attribute. The last segment is the Attribute of interest, and prior segments must be typed to contain or find Objects. The Config code parses and “walks” this path until it gets to the final segment of the path. It then interprets the last segment as an Attribute on the last Object it found while walking the path. The Config functions then call the appropriate TraceConnect or TraceConnectWithoutContext method on the final Object. Let’s see what happens in a bit more detail when the above path is walked.
The leading “/” character in the path refers to a so-called namespace. One of the predefined namespaces in the config system is “NodeList” which is a list of all of the nodes in the simulation. Items in the list are referred to by indices into the list, so “/NodeList/7” refers to the eighth node in the list of nodes created during the simulation. This reference is actually a Ptr<Node> and so is a subclass of an ns3::Object.
As described in the Object Model section of the ns-3 manual, we support Object Aggregation. This allows us to form an association between different Objects without any programming. Each Object in an Aggregation can be reached from the other Objects.
The next path segment being walked begins with the “$” character. This indicates to the config system that a GetObject call should be made looking for the type that follows. It turns out that the MobilityHelper used in third.cc arranges to Aggregate, or associate, a mobility model to each of the wireless Nodes. When you add the “$” you are asking for another Object that has presumably been previously aggregated. You can think of this as switching pointers from the original Ptr<Node> as specified by “/NodeList/7” to its associated mobility model — which is of type “$ns3::MobilityModel”. If you are familiar with GetObject, we have asked the system to do the following:
Ptr<MobilityModel> mobilityModel = node->GetObject<MobilityModel> ()
We are now at the last Object in the path, so we turn our attention to the Attributes of that Object. The MobilityModel class defines an Attribute called “CourseChange”. You can see this by looking at the source code in src/mobility/model/mobility-model.cc and searching for “CourseChange” in your favorite editor. You should find,
.AddTraceSource ("CourseChange",
                 "The value of the position and/or velocity vector changed",
                 MakeTraceSourceAccessor (&MobilityModel::m_courseChangeTrace))
which should look very familiar at this point.
If you look for the corresponding declaration of the underlying traced variable in mobility-model.h you will find
TracedCallback<Ptr<const MobilityModel> > m_courseChangeTrace;
The type declaration TracedCallback identifies m_courseChangeTrace as a special list of Callbacks that can be hooked using the Config functions described above.
The MobilityModel class is designed to be a base class providing a common interface for all of the specific subclasses. If you search down to the end of the file, you will see a method defined called NotifyCourseChange():
void
MobilityModel::NotifyCourseChange (void) const
{
  m_courseChangeTrace(this);
}
Derived classes will call into this method whenever they do a course change to support tracing. This method invokes operator() on the underlying m_courseChangeTrace, which will, in turn, invoke all of the registered Callbacks, calling all of the trace sinks that have registered interest in the trace source by calling a Config function.
So, in the third.cc example we looked at, whenever a course change is made in one of the RandomWalk2dMobilityModel instances installed, there will be a NotifyCourseChange() call which calls up into the MobilityModel base class. As seen above, this invokes operator() on m_courseChangeTrace, which in turn, calls any registered trace sinks. In the example, the only code registering an interest was the code that provided the config path. Therefore, the CourseChange function that was hooked from Node number seven will be the only Callback called.
The final piece of the puzzle is the “context”. Recall that we saw an output looking something like the following from third.cc:
/NodeList/7/$ns3::MobilityModel/CourseChange x = 7.27897, y = 2.22677
The first part of the output is the context. It is simply the path through which the config code located the trace source. In the case we have been looking at there can be any number of trace sources in the system corresponding to any number of nodes with mobility models. There needs to be some way to identify which trace source is actually the one that fired the Callback. An easy way is to request a trace context when you Config::Connect.
The first question that inevitably comes up for new users of the Tracing system is, “okay, I know that there must be trace sources in the simulation core, but how do I find out what trace sources are available to me”?
The second question is, “okay, I found a trace source, how do I figure out the config path to use when I connect to it”?
The third question is, “okay, I found a trace source, how do I figure out what the return type and formal arguments of my callback function need to be”?
The fourth question is, “okay, I typed that all in and got this incredibly bizarre error message, what in the world does it mean”?
The answer to this question is found in the ns-3 Doxygen. If you go to the project web site, ns-3 project, you will find a link to “Documentation” in the navigation bar. If you select this link, you will be taken to our documentation page. There is a link to “Latest Release” that will take you to the documentation for the latest stable release of ns-3. If you select the “API Documentation” link, you will be taken to the ns-3 API documentation page.
Expand the “Modules” book in the NS-3 documentation tree by clicking the “+” box. Now, expand the “C++ Constructs Used by All Modules” book in the tree by clicking its “+” box. You should now see four extremely useful links:
The list of interest to us here is “the list of all trace sources”. Go ahead and select that link. You will see, perhaps not too surprisingly, a list of all of the trace sources available in the ns-3 core.
As an example, scroll down to ns3::MobilityModel. You will find an entry for
CourseChange: The value of the position and/or velocity vector changed
You should recognize this as the trace source we used in the third.cc example. Perusing this list will be helpful.
The easiest way to do this is to grep around in the ns-3 codebase for someone who has already figured it out, You should always try to copy someone else’s working code before you start to write your own. Try something like:
$ find . -name '*.cc' | xargs grep CourseChange | grep Connect
and you may find your answer along with working code. For example, in this case, ./ns-3-dev/examples/wireless/mixed-wireless.cc has something just waiting for you to use:
Config::Connect ("/NodeList/*/$ns3::MobilityModel/CourseChange",
  MakeCallback (&CourseChangeCallback));
If you cannot find any examples in the distribution, you can find this out from the ns-3 Doxygen. It will probably be simplest just to walk through the “CourseChanged” example.
Let’s assume that you have just found the “CourseChanged” trace source in “The list of all trace sources” and you want to figure out how to connect to it. You know that you are using (again, from the third.cc example) an ns3::RandomWalk2dMobilityModel. So open the “Class List” book in the NS-3 documentation tree by clicking its “+” box. You will now see a list of all of the classes in ns-3. Scroll down until you see the entry for ns3::RandomWalk2dMobilityModel and follow that link. You should now be looking at the “ns3::RandomWalk2dMobilityModel Class Reference”.
If you now scroll down to the “Member Function Documentation” section, you will see documentation for the GetTypeId function. You constructed one of these in the simple tracing example above:
static TypeId GetTypeId (void)
{
  static TypeId tid = TypeId ("MyObject")
    .SetParent (Object::GetTypeId ())
    .AddConstructor<MyObject> ()
    .AddTraceSource ("MyInteger",
                     "An integer value to trace.",
                     MakeTraceSourceAccessor (&MyObject::m_myInt))
    ;
  return tid;
}
As mentioned above, this is the bit of code that connected the Config and Attribute systems to the underlying trace source. This is also the place where you should start looking for information about the way to connect.
You are looking at the same information for the RandomWalk2dMobilityModel; and the information you want is now right there in front of you in the Doxygen:
This object is accessible through the following paths with Config::Set and Config::Connect:

/NodeList/[i]/$ns3::MobilityModel/$ns3::RandomWalk2dMobilityModel
The documentation tells you how to get to the RandomWalk2dMobilityModel Object. Compare the string above with the string we actually used in the example code:
"/NodeList/7/$ns3::MobilityModel"
The difference is due to the fact that two GetObject calls are implied in the string found in the documentation. The first, for $ns3::MobilityModel will query the aggregation for the base class. The second implied GetObject call, for $ns3::RandomWalk2dMobilityModel, is used to “cast” the base class to the concrete implementation class. The documentation shows both of these operations for you. It turns out that the actual Attribute you are going to be looking for is found in the base class as we have seen.
Look further down in the GetTypeId doxygen. You will find,
No TraceSources defined for this type.
TraceSources defined in parent class ns3::MobilityModel:

CourseChange: The value of the position and/or velocity vector changed
Reimplemented from ns3::MobilityModel
This is exactly what you need to know. The trace source of interest is found in ns3::MobilityModel (which you knew anyway). The interesting thing this bit of Doxygen tells you is that you don’t need that extra cast in the config path above to get to the concrete class, since the trace source is actually in the base class. Therefore the additional GetObject is not required and you simply use the path:
/NodeList/[i]/$ns3::MobilityModel
which perfectly matches the example path:
/NodeList/7/$ns3::MobilityModel
The easiest way to do this is to grep around in the ns-3 codebase for someone who has already figured it out, You should always try to copy someone else’s working code. Try something like:
$ find . -name '*.cc' | xargs grep CourseChange | grep Connect
and you may find your answer along with working code. For example, in this case, ./ns-3-dev/examples/wireless/mixed-wireless.cc has something just waiting for you to use. You will find
Config::Connect ("/NodeList/*/$ns3::MobilityModel/CourseChange",
  MakeCallback (&CourseChangeCallback));
as a result of your grep. The MakeCallback should indicate to you that there is a callback function there which you can use. Sure enough, there is:
static void
CourseChangeCallback (std::string path, Ptr<const MobilityModel> model)
{
  ...
}
If there are no examples to work from, this can be, well, challenging to actually figure out from the source code.
Before embarking on a walkthrough of the code, I’ll be kind and just tell you a simple way to figure this out: The return value of your callback will always be void. The formal parameter list for a TracedCallback can be found from the template parameter list in the declaration. Recall that for our current example, this is in mobility-model.h, where we have previously found:
TracedCallback<Ptr<const MobilityModel> > m_courseChangeTrace;
There is a one-to-one correspondence between the template parameter list in the declaration and the formal arguments of the callback function. Here, there is one template parameter, which is a Ptr<const MobilityModel>. This tells you that you need a function that returns void and takes a a Ptr<const MobilityModel>. For example,
void
CourseChangeCallback (Ptr<const MobilityModel> model)
{
  ...
}
That’s all you need if you want to Config::ConnectWithoutContext. If you want a context, you need to Config::Connect and use a Callback function that takes a string context, then the required argument.
void
CourseChangeCallback (std::string path, Ptr<const MobilityModel> model)
{
  ...
}
If you want to ensure that your CourseChangeCallback is only visible in your local file, you can add the keyword static and come up with:
static void
CourseChangeCallback (std::string path, Ptr<const MobilityModel> model)
{
  ...
}
which is exactly what we used in the third.cc example.
This section is entirely optional. It is going to be a bumpy ride, especially for those unfamiliar with the details of templates. However, if you get through this, you will have a very good handle on a lot of the ns-3 low level idioms.
So, again, let’s figure out what signature of callback function is required for the “CourseChange” Attribute. This is going to be painful, but you only need to do this once. After you get through this, you will be able to just look at a TracedCallback and understand it.
The first thing we need to look at is the declaration of the trace source. Recall that this is in mobility-model.h, where we have previously found:
TracedCallback<Ptr<const MobilityModel> > m_courseChangeTrace;
This declaration is for a template. The template parameter is inside the angle-brackets, so we are really interested in finding out what that TracedCallback<> is. If you have absolutely no idea where this might be found, grep is your friend.
We are probably going to be interested in some kind of declaration in the ns-3 source, so first change into the src directory. Then, we know this declaration is going to have to be in some kind of header file, so just grep for it using:
$ find . -name '*.h' | xargs grep TracedCallback
You’ll see 124 lines fly by (I piped this through wc to see how bad it was). Although that may seem like it, that’s not really a lot. Just pipe the output through more and start scanning through it. On the first page, you will see some very suspiciously template-looking stuff.
TracedCallback<T1,T2,T3,T4,T5,T6,T7,T8>::TracedCallback ()
TracedCallback<T1,T2,T3,T4,T5,T6,T7,T8>::ConnectWithoutContext (c ...
TracedCallback<T1,T2,T3,T4,T5,T6,T7,T8>::Connect (const CallbackB ...
TracedCallback<T1,T2,T3,T4,T5,T6,T7,T8>::DisconnectWithoutContext ...
TracedCallback<T1,T2,T3,T4,T5,T6,T7,T8>::Disconnect (const Callba ...
TracedCallback<T1,T2,T3,T4,T5,T6,T7,T8>::operator() (void) const ...
TracedCallback<T1,T2,T3,T4,T5,T6,T7,T8>::operator() (T1 a1) const ...
TracedCallback<T1,T2,T3,T4,T5,T6,T7,T8>::operator() (T1 a1, T2 a2 ...
TracedCallback<T1,T2,T3,T4,T5,T6,T7,T8>::operator() (T1 a1, T2 a2 ...
TracedCallback<T1,T2,T3,T4,T5,T6,T7,T8>::operator() (T1 a1, T2 a2 ...
TracedCallback<T1,T2,T3,T4,T5,T6,T7,T8>::operator() (T1 a1, T2 a2 ...
TracedCallback<T1,T2,T3,T4,T5,T6,T7,T8>::operator() (T1 a1, T2 a2 ...
TracedCallback<T1,T2,T3,T4,T5,T6,T7,T8>::operator() (T1 a1, T2 a2 ...
It turns out that all of this comes from the header file traced-callback.h which sounds very promising. You can then take a look at mobility-model.h and see that there is a line which confirms this hunch:
#include "ns3/traced-callback.h"
Of course, you could have gone at this from the other direction and started by looking at the includes in mobility-model.h and noticing the include of traced-callback.h and inferring that this must be the file you want.
In either case, the next step is to take a look at src/core/model/traced-callback.h in your favorite editor to see what is happening.
You will see a comment at the top of the file that should be comforting:
An ns3::TracedCallback has almost exactly the same API as a normal ns3::Callback but
instead of forwarding calls to a single function (as an ns3::Callback normally does),
it forwards calls to a chain of ns3::Callback.
This should sound very familiar and let you know you are on the right track.
Just after this comment, you will find,
template<typename T1 = empty, typename T2 = empty,
         typename T3 = empty, typename T4 = empty,
         typename T5 = empty, typename T6 = empty,
         typename T7 = empty, typename T8 = empty>
class TracedCallback
{
  ...
This tells you that TracedCallback is a templated class. It has eight possible type parameters with default values. Go back and compare this with the declaration you are trying to understand:
TracedCallback<Ptr<const MobilityModel> > m_courseChangeTrace;
The typename T1 in the templated class declaration corresponds to the Ptr<const MobilityModel> in the declaration above. All of the other type parameters are left as defaults. Looking at the constructor really doesn’t tell you much. The one place where you have seen a connection made between your Callback function and the tracing system is in the Connect and ConnectWithoutContext functions. If you scroll down, you will see a ConnectWithoutContext method here:
template<typename T1, typename T2,
         typename T3, typename T4,
         typename T5, typename T6,
         typename T7, typename T8>
void
TracedCallback<T1,T2,T3,T4,T5,T6,T7,T8>::ConnectWithoutContext ...
{
  Callback<void,T1,T2,T3,T4,T5,T6,T7,T8> cb;
  cb.Assign (callback);
  m_callbackList.push_back (cb);
}
You are now in the belly of the beast. When the template is instantiated for the declaration above, the compiler will replace T1 with Ptr<const MobilityModel>.
void
TracedCallback<Ptr<const MobilityModel>::ConnectWithoutContext ... cb
{
  Callback<void, Ptr<const MobilityModel> > cb;
  cb.Assign (callback);
  m_callbackList.push_back (cb);
}
You can now see the implementation of everything we’ve been talking about. The code creates a Callback of the right type and assigns your function to it. This is the equivalent of the pfi = MyFunction we discussed at the start of this section. The code then adds the Callback to the list of Callbacks for this source. The only thing left is to look at the definition of Callback. Using the same grep trick as we used to find TracedCallback, you will be able to find that the file ./core/callback.h is the one we need to look at.
If you look down through the file, you will see a lot of probably almost incomprehensible template code. You will eventually come to some Doxygen for the Callback template class, though. Fortunately, there is some English:
This class template implements the Functor Design Pattern.
It is used to declare the type of a Callback:
 - the first non-optional template argument represents
   the return type of the callback.
 - the second optional template argument represents
   the type of the first argument to the callback.
 - the third optional template argument represents
   the type of the second argument to the callback.
 - the fourth optional template argument represents
   the type of the third argument to the callback.
 - the fifth optional template argument represents
   the type of the fourth argument to the callback.
 - the sixth optional template argument represents
   the type of the fifth argument to the callback.
We are trying to figure out what the
Callback<void, Ptr<const MobilityModel> > cb;
declaration means. Now we are in a position to understand that the first (non-optional) parameter, void, represents the return type of the Callback. The second (non-optional) parameter, Ptr<const MobilityModel> represents the first argument to the callback.
The Callback in question is your function to receive the trace events. From this you can infer that you need a function that returns void and takes a Ptr<const MobilityModel>. For example,
void
CourseChangeCallback (Ptr<const MobilityModel> model)
{
  ...
}
That’s all you need if you want to Config::ConnectWithoutContext. If you want a context, you need to Config::Connect and use a Callback function that takes a string context. This is because the Connect function will provide the context for you. You’ll need:
void
CourseChangeCallback (std::string path, Ptr<const MobilityModel> model)
{
  ...
}
If you want to ensure that your CourseChangeCallback is only visible in your local file, you can add the keyword static and come up with:
static void
CourseChangeCallback (std::string path, Ptr<const MobilityModel> model)
{
  ...
}
which is exactly what we used in the third.cc example. Perhaps you should now go back and reread the previous section (Take My Word for It).
If you are interested in more details regarding the implementation of Callbacks, feel free to take a look at the ns-3 manual. They are one of the most frequently used constructs in the low-level parts of ns-3. It is, in my opinion, a quite elegant thing.
Earlier in this section, we presented a simple piece of code that used a TracedValue<int32_t> to demonstrate the basics of the tracing code. We just glossed over the way to find the return type and formal arguments for the TracedValue. Rather than go through the whole exercise, we will just point you at the correct file, src/core/model/traced-value.h and to the important piece of code:
template <typename T>
class TracedValue
{
public:
  ...
  void Set (const T &v) {
    if (m_v != v)
      {
      m_cb (m_v, v);
      m_v = v;
      }
  }
  ...
private:
  T m_v;
  TracedCallback<T,T> m_cb;
};
Here you see that the TracedValue is templated, of course. In the simple example case at the start of the section, the typename is int32_t. This means that the member variable being traced (m_v in the private section of the class) will be an int32_t m_v. The Set method will take a const int32_t &v as a parameter. You should now be able to understand that the Set code will fire the m_cb callback with two parameters: the first being the current value of the TracedValue; and the second being the new value being set.
The callback, m_cb is declared as a TracedCallback<T, T> which will correspond to a TracedCallback<int32_t, int32_t> when the class is instantiated.
Recall that the callback target of a TracedCallback always returns void. Further recall that there is a one-to-one correspondence between the template parameter list in the declaration and the formal arguments of the callback function. Therefore the callback will need to have a function signature that looks like:
void
MyCallback (int32_t oldValue, int32_t newValue)
{
  ...
}
It probably won’t surprise you that this is exactly what we provided in that simple example we covered so long ago:
void
IntTrace (int32_t oldValue, int32_t newValue)
{
  std::cout << "Traced " << oldValue << " to " << newValue << std::endl;
}
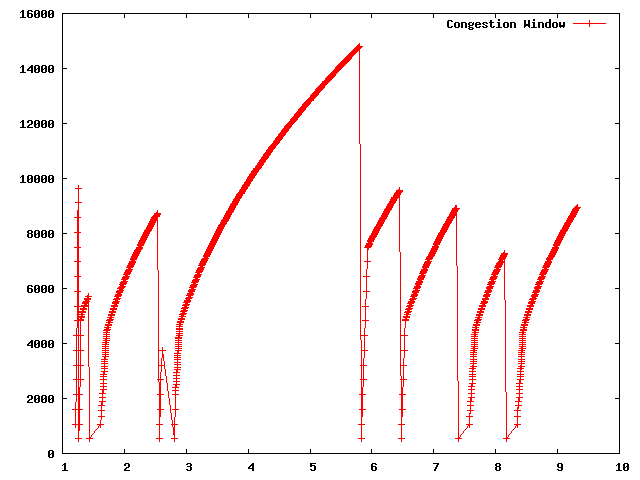
Let’s do an example taken from one of the best-known books on TCP around. “TCP/IP Illustrated, Volume 1: The Protocols,” by W. Richard Stevens is a classic. I just flipped the book open and ran across a nice plot of both the congestion window and sequence numbers versus time on page 366. Stevens calls this, “Figure 21.10. Value of cwnd and send sequence number while data is being transmitted.” Let’s just recreate the cwnd part of that plot in ns-3 using the tracing system and gnuplot.
The first thing to think about is how we want to get the data out. What is it that we need to trace? The first thing to do is to consult “The list of all trace sources” to see what we have to work with. Recall that this is found in the ns-3 Doxygen in the “C++ Constructs Used by All Modules” Module section. If you scroll through the list, you will eventually find:
ns3::TcpNewReno
CongestionWindow: The TCP connection's congestion window
It turns out that the ns-3 TCP implementation lives (mostly) in the file src/internet/model/tcp-socket-base.cc while congestion control variants are in files such as src/internet/model/tcp-newreno.cc. If you don’t know this a priori, you can use the recursive grep trick:
$ find . -name '*.cc' | xargs grep -i tcp
You will find page after page of instances of tcp pointing you to that file.
If you open src/internet/model/tcp-newreno.cc in your favorite editor, you will see right up at the top of the file, the following declarations:
TypeId
TcpNewReno::GetTypeId ()
{
  static TypeId tid = TypeId("ns3::TcpNewReno")
    .SetParent<TcpSocketBase> ()
    .AddConstructor<TcpNewReno> ()
    .AddTraceSource ("CongestionWindow",
                     "The TCP connection's congestion window",
                     MakeTraceSourceAccessor (&TcpNewReno::m_cWnd))
    ;
  return tid;
}
This should tell you to look for the declaration of m_cWnd in the header file src/internet/model/tcp-newreno.h. If you open this file in your favorite editor, you will find:
TracedValue<uint32_t> m_cWnd; //Congestion window
You should now understand this code completely. If we have a pointer to the TcpNewReno, we can TraceConnect to the “CongestionWindow” trace source if we provide an appropriate callback target. This is the same kind of trace source that we saw in the simple example at the start of this section, except that we are talking about uint32_t instead of int32_t.
We now know that we need to provide a callback that returns void and takes two uint32_t parameters, the first being the old value and the second being the new value:
void
CwndTrace (uint32_t oldValue, uint32_t newValue)
{
  ...
}
It’s always best to try and find working code laying around that you can modify, rather than starting from scratch. So the first order of business now is to find some code that already hooks the “CongestionWindow” trace source and see if we can modify it. As usual, grep is your friend:
$ find . -name '*.cc' | xargs grep CongestionWindow
This will point out a couple of promising candidates: examples/tcp/tcp-large-transfer.cc and src/test/ns3tcp/ns3tcp-cwnd-test-suite.cc.
We haven’t visited any of the test code yet, so let’s take a look there. You will typically find that test code is fairly minimal, so this is probably a very good bet. Open src/test/ns3tcp/ns3tcp-cwnd-test-suite.cc in your favorite editor and search for “CongestionWindow”. You will find,
ns3TcpSocket->TraceConnectWithoutContext ("CongestionWindow",
  MakeCallback (&Ns3TcpCwndTestCase1::CwndChange, this));
This should look very familiar to you. We mentioned above that if we had a pointer to the TcpNewReno, we could TraceConnect to the “CongestionWindow” trace source. That’s exactly what we have here; so it turns out that this line of code does exactly what we want. Let’s go ahead and extract the code we need from this function (Ns3TcpCwndTestCase1::DoRun (void)). If you look at this function, you will find that it looks just like an ns-3 script. It turns out that is exactly what it is. It is a script run by the test framework, so we can just pull it out and wrap it in main instead of in DoRun. Rather than walk through this, step, by step, we have provided the file that results from porting this test back to a native ns-3 script – examples/tutorial/fifth.cc.
The fifth.cc example demonstrates an extremely important rule that you must understand before using any kind of Attribute: you must ensure that the target of a Config command exists before trying to use it. This is no different than saying an object must be instantiated before trying to call it. Although this may seem obvious when stated this way, it does trip up many people trying to use the system for the first time.
Let’s return to basics for a moment. There are three basic time periods that exist in any ns-3 script. The first time period is sometimes called “Configuration Time” or “Setup Time,” and is in force during the period when the main function of your script is running, but before Simulator::Run is called. The second time period is sometimes called “Simulation Time” and is in force during the time period when Simulator::Run is actively executing its events. After it completes executing the simulation, Simulator::Run will return control back to the main function. When this happens, the script enters what can be called “Teardown Time,” which is when the structures and objects created during setup are taken apart and released.
Perhaps the most common mistake made in trying to use the tracing system is assuming that entities constructed dynamically during simulation time are available during configuration time. In particular, an ns-3 Socket is a dynamic object often created by Applications to communicate between Nodes. An ns-3 Application always has a “Start Time” and a “Stop Time” associated with it. In the vast majority of cases, an Application will not attempt to create a dynamic object until its StartApplication method is called at some “Start Time”. This is to ensure that the simulation is completely configured before the app tries to do anything (what would happen if it tried to connect to a node that didn’t exist yet during configuration time). The answer to this issue is to 1) create a simulator event that is run after the dynamic object is created and hook the trace when that event is executed; or 2) create the dynamic object at configuration time, hook it then, and give the object to the system to use during simulation time. We took the second approach in the fifth.cc example. This decision required us to create the MyApp Application, the entire purpose of which is to take a Socket as a parameter.
Now, let’s take a look at the example program we constructed by dissecting the congestion window test. Open examples/tutorial/fifth.cc in your favorite editor. You should see some familiar looking code:
/* -*- Mode:C++; c-file-style:"gnu"; indent-tabs-mode:nil; -*- */
/*
 * This program is free software; you can redistribute it and/or modify
 * it under the terms of the GNU General Public License version 2 as
 * published by the Free Software Foundation;
 *
 * This program is distributed in the hope that it will be useful,
 * but WITHOUT ANY WARRANTY; without even the implied warranty of
 * MERCHANTABILITY or FITNESS FOR A PARTICULAR PURPOSE.  See the
 * GNU General Public License for more details.
 *
 * You should have received a copy of the GNU General Public License
 * along with this program; if not, write to the Free Software
 * Foundation, Include., 59 Temple Place, Suite 330, Boston, MA  02111-1307  USA
 */

#include <fstream>
#include "ns3/core-module.h"
#include "ns3/network-module.h"
#include "ns3/internet-module.h"
#include "ns3/point-to-point-module.h"
#include "ns3/applications-module.h"

using namespace ns3;

NS_LOG_COMPONENT_DEFINE ("FifthScriptExample");
This has all been covered, so we won’t rehash it. The next lines of source are the network illustration and a comment addressing the problem described above with Socket.
// ===========================================================================
//
//         node 0                 node 1
//   +----------------+    +----------------+
//   |    ns-3 TCP    |    |    ns-3 TCP    |
//   +----------------+    +----------------+
//   |    10.1.1.1    |    |    10.1.1.2    |
//   +----------------+    +----------------+
//   | point-to-point |    | point-to-point |
//   +----------------+    +----------------+
//           |                     |
//           +---------------------+
//                5 Mbps, 2 ms
//
//
// We want to look at changes in the ns-3 TCP congestion window.  We need
// to crank up a flow and hook the CongestionWindow attribute on the socket
// of the sender.  Normally one would use an on-off application to generate a
// flow, but this has a couple of problems.  First, the socket of the on-off
// application is not created until Application Start time, so we wouldn't be
// able to hook the socket (now) at configuration time.  Second, even if we
// could arrange a call after start time, the socket is not public so we
// couldn't get at it.
//
// So, we can cook up a simple version of the on-off application that does what
// we want.  On the plus side we don't need all of the complexity of the on-off
// application.  On the minus side, we don't have a helper, so we have to get
// a little more involved in the details, but this is trivial.
//
// So first, we create a socket and do the trace connect on it; then we pass
// this socket into the constructor of our simple application which we then
// install in the source node.
// ===========================================================================
//
This should also be self-explanatory.
The next part is the declaration of the MyApp Application that we put together to allow the Socket to be created at configuration time.
class MyApp : public Application
{
public:

  MyApp ();
  virtual ~MyApp();

  void Setup (Ptr<Socket> socket, Address address, uint32_t packetSize,
    uint32_t nPackets, DataRate dataRate);

private:
  virtual void StartApplication (void);
  virtual void StopApplication (void);

  void ScheduleTx (void);
  void SendPacket (void);

  Ptr<Socket>     m_socket;
  Address         m_peer;
  uint32_t        m_packetSize;
  uint32_t        m_nPackets;
  DataRate        m_dataRate;
  EventId         m_sendEvent;
  bool            m_running;
  uint32_t        m_packetsSent;
};
You can see that this class inherits from the ns-3 Application class. Take a look at src/network/model/application.h if you are interested in what is inherited. The MyApp class is obligated to override the StartApplication and StopApplication methods. These methods are automatically called when MyApp is required to start and stop sending data during the simulation.
It is worthwhile to spend a bit of time explaining how events actually get started in the system. This is another fairly deep explanation, and can be ignored if you aren’t planning on venturing down into the guts of the system. It is useful, however, in that the discussion touches on how some very important parts of ns-3 work and exposes some important idioms. If you are planning on implementing new models, you probably want to understand this section.
The most common way to start pumping events is to start an Application. This is done as the result of the following (hopefully) familar lines of an ns-3 script:
ApplicationContainer apps = ...
apps.Start (Seconds (1.0));
apps.Stop (Seconds (10.0));
The application container code (see src/network/helper/application-container.h if you are interested) loops through its contained applications and calls,
app->SetStartTime (startTime);
as a result of the apps.Start call and
app->SetStopTime (stopTime);
as a result of the apps.Stop call.
The ultimate result of these calls is that we want to have the simulator automatically make calls into our Applications to tell them when to start and stop. In the case of MyApp, it inherits from class Application and overrides StartApplication, and StopApplication. These are the functions that will be called by the simulator at the appropriate time. In the case of MyApp you will find that MyApp::StartApplication does the initial Bind, and Connect on the socket, and then starts data flowing by calling MyApp::SendPacket. MyApp::StopApplication stops generating packets by cancelling any pending send events and closing the socket.
One of the nice things about ns-3 is that you can completely ignore the implementation details of how your Application is “automagically” called by the simulator at the correct time. But since we have already ventured deep into ns-3 already, let’s go for it.
If you look at src/network/model/application.cc you will find that the SetStartTime method of an Application just sets the member variable m_startTime and the SetStopTime method just sets m_stopTime. From there, without some hints, the trail will probably end.
The key to picking up the trail again is to know that there is a global list of all of the nodes in the system. Whenever you create a node in a simulation, a pointer to that node is added to the global NodeList.
Take a look at src/network/model/node-list.cc and search for NodeList::Add. The public static implementation calls into a private implementation called NodeListPriv::Add. This is a relatively common idom in ns-3. So, take a look at NodeListPriv::Add. There you will find,
Simulator::ScheduleWithContext (index, TimeStep (0), &Node::Initialize, node);
This tells you that whenever a Node is created in a simulation, as a side-effect, a call to that node’s Initialize method is scheduled for you that happens at time zero. Don’t read too much into that name, yet. It doesn’t mean that the node is going to start doing anything, it can be interpreted as an informational call into the Node telling it that the simulation has started, not a call for action telling the Node to start doing something.
So, NodeList::Add indirectly schedules a call to Node::Initialize at time zero to advise a new node that the simulation has started. If you look in src/network/model/node.h you will, however, not find a method called Node::Initialize. It turns out that the Initialize method is inherited from class Object. All objects in the system can be notified when the simulation starts, and objects of class Node are just one kind of those objects.
Take a look at src/core/model/object.cc next and search for Object::Initialize. This code is not as straightforward as you might have expected since ns-3 Objects support aggregation. The code in Object::Initialize then loops through all of the objects that have been aggregated together and calls their DoInitialize method. This is another idiom that is very common in ns-3. There is a public API method, that stays constant across implementations, that calls a private implementation method that is inherited and implemented by subclasses. The names are typically something like MethodName for the public API and DoMethodName for the private API.
This tells us that we should look for a Node::DoInitialize method in src/network/model/node.cc for the method that will continue our trail. If you locate the code, you will find a method that loops through all of the devices in the node and then all of the applications in the node calling device->Initialize and application->Initialize respectively.
You may already know that classes Device and Application both inherit from class Object and so the next step will be to look at what happens when Application::DoInitialize is called. Take a look at src/network/model/application.cc and you will find:
void
Application::DoInitialize (void)
{
  m_startEvent = Simulator::Schedule (m_startTime, &Application::StartApplication, this);
  if (m_stopTime != TimeStep (0))
    {
      m_stopEvent = Simulator::Schedule (m_stopTime, &Application::StopApplication, this);
    }
  Object::DoInitialize ();
}
Here, we finally come to the end of the trail. If you have kept it all straight, when you implement an ns-3 Application, your new application inherits from class Application. You override the StartApplication and StopApplication methods and provide mechanisms for starting and stopping the flow of data out of your new Application. When a Node is created in the simulation, it is added to a global NodeList. The act of adding a node to this NodeList causes a simulator event to be scheduled for time zero which calls the Node::Initialize method of the newly added Node to be called when the simulation starts. Since a Node inherits from Object, this calls the Object::Initialize method on the Node which, in turn, calls the DoInitialize methods on all of the Objects aggregated to the Node (think mobility models). Since the Node Object has overridden DoInitialize, that method is called when the simulation starts. The Node::DoInitialize method calls the Initialize methods of all of the Applications on the node. Since Applications are also Objects, this causes Application::DoInitialize to be called. When Application::DoInitialize is called, it schedules events for the StartApplication and StopApplication calls on the Application. These calls are designed to start and stop the flow of data from the Application
This has been another fairly long journey, but it only has to be made once, and you now understand another very deep piece of ns-3.
The MyApp Application needs a constructor and a destructor, of course:
MyApp::MyApp ()
  : m_socket (0),
    m_peer (),
    m_packetSize (0),
    m_nPackets (0),
    m_dataRate (0),
    m_sendEvent (),
    m_running (false),
    m_packetsSent (0)
{
}

MyApp::~MyApp()
{
  m_socket = 0;
}
The existence of the next bit of code is the whole reason why we wrote this Application in the first place.
void
MyApp::Setup (Ptr<Socket> socket, Address address, uint32_t packetSize,
                     uint32_t nPackets, DataRate dataRate)
{
  m_socket = socket;
  m_peer = address;
  m_packetSize = packetSize;
  m_nPackets = nPackets;
  m_dataRate = dataRate;
}
This code should be pretty self-explanatory. We are just initializing member variables. The important one from the perspective of tracing is the Ptr<Socket> socket which we needed to provide to the application during configuration time. Recall that we are going to create the Socket as a TcpSocket (which is implemented by TcpNewReno) and hook its “CongestionWindow” trace source before passing it to the Setup method.
void
MyApp::StartApplication (void)
{
  m_running = true;
  m_packetsSent = 0;
  m_socket->Bind ();
  m_socket->Connect (m_peer);
  SendPacket ();
}
The above code is the overridden implementation Application::StartApplication that will be automatically called by the simulator to start our Application running at the appropriate time. You can see that it does a Socket Bind operation. If you are familiar with Berkeley Sockets this shouldn’t be a surprise. It performs the required work on the local side of the connection just as you might expect. The following Connect will do what is required to establish a connection with the TCP at Address m_peer. It should now be clear why we need to defer a lot of this to simulation time, since the Connect is going to need a fully functioning network to complete. After the Connect, the Application then starts creating simulation events by calling SendPacket.
The next bit of code explains to the Application how to stop creating simulation events.
void
MyApp::StopApplication (void)
{
  m_running = false;

  if (m_sendEvent.IsRunning ())
    {
      Simulator::Cancel (m_sendEvent);
    }

  if (m_socket)
    {
      m_socket->Close ();
    }
}
Every time a simulation event is scheduled, an Event is created. If the Event is pending execution or executing, its method IsRunning will return true. In this code, if IsRunning() returns true, we Cancel the event which removes it from the simulator event queue. By doing this, we break the chain of events that the Application is using to keep sending its Packets and the Application goes quiet. After we quiet the Application we Close the socket which tears down the TCP connection.
The socket is actually deleted in the destructor when the m_socket = 0 is executed. This removes the last reference to the underlying Ptr<Socket> which causes the destructor of that Object to be called.
Recall that StartApplication called SendPacket to start the chain of events that describes the Application behavior.
void
MyApp::SendPacket (void)
{
  Ptr<Packet> packet = Create<Packet> (m_packetSize);
  m_socket->Send (packet);

  if (++m_packetsSent < m_nPackets)
    {
      ScheduleTx ();
    }
}
Here, you see that SendPacket does just that. It creates a Packet and then does a Send which, if you know Berkeley Sockets, is probably just what you expected to see.
It is the responsibility of the Application to keep scheduling the chain of events, so the next lines call ScheduleTx to schedule another transmit event (a SendPacket) until the Application decides it has sent enough.
void
MyApp::ScheduleTx (void)
{
  if (m_running)
    {
      Time tNext (Seconds (m_packetSize * 8 / static_cast<double> (m_dataRate.GetBitRate ())));
      m_sendEvent = Simulator::Schedule (tNext, &MyApp::SendPacket, this);
    }
}
Here, you see that ScheduleTx does exactly that. If the Application is running (if StopApplication has not been called) it will schedule a new event, which calls SendPacket again. The alert reader will spot something that also trips up new users. The data rate of an Application is just that. It has nothing to do with the data rate of an underlying Channel. This is the rate at which the Application produces bits. It does not take into account any overhead for the various protocols or channels that it uses to transport the data. If you set the data rate of an Application to the same data rate as your underlying Channel you will eventually get a buffer overflow.
The whole point of this exercise is to get trace callbacks from TCP indicating the congestion window has been updated. The next piece of code implements the corresponding trace sink:
static void
CwndChange (uint32_t oldCwnd, uint32_t newCwnd)
{
  NS_LOG_UNCOND (Simulator::Now ().GetSeconds () << "\t" << newCwnd);
}
This should be very familiar to you now, so we won’t dwell on the details. This function just logs the current simulation time and the new value of the congestion window every time it is changed. You can probably imagine that you could load the resulting output into a graphics program (gnuplot or Excel) and immediately see a nice graph of the congestion window behavior over time.
We added a new trace sink to show where packets are dropped. We are going to add an error model to this code also, so we wanted to demonstrate this working.
static void
RxDrop (Ptr<const Packet> p)
{
  NS_LOG_UNCOND ("RxDrop at " << Simulator::Now ().GetSeconds ());
}
This trace sink will be connected to the “PhyRxDrop” trace source of the point-to-point NetDevice. This trace source fires when a packet is dropped by the physical layer of a NetDevice. If you take a small detour to the source (src/point-to-point/model/point-to-point-net-device.cc) you will see that this trace source refers to PointToPointNetDevice::m_phyRxDropTrace. If you then look in src/point-to-point/model/point-to-point-net-device.h for this member variable, you will find that it is declared as a TracedCallback<Ptr<const Packet> >. This should tell you that the callback target should be a function that returns void and takes a single parameter which is a Ptr<const Packet> – just what we have above.
The following code should be very familiar to you by now:
int
main (int argc, char *argv[])
{
  NodeContainer nodes;
  nodes.Create (2);

  PointToPointHelper pointToPoint;
  pointToPoint.SetDeviceAttribute ("DataRate", StringValue ("5Mbps"));
  pointToPoint.SetChannelAttribute ("Delay", StringValue ("2ms"));

  NetDeviceContainer devices;
  devices = pointToPoint.Install (nodes);
This creates two nodes with a point-to-point channel between them, just as shown in the illustration at the start of the file.
The next few lines of code show something new. If we trace a connection that behaves perfectly, we will end up with a monotonically increasing congestion window. To see any interesting behavior, we really want to introduce link errors which will drop packets, cause duplicate ACKs and trigger the more interesting behaviors of the congestion window.
ns-3 provides ErrorModel objects which can be attached to Channels. We are using the RateErrorModel which allows us to introduce errors into a Channel at a given rate.
Ptr<RateErrorModel> em = CreateObject<RateErrorModel> ();
em->SetAttribute ("ErrorRate", DoubleValue (0.00001));
devices.Get (1)->SetAttribute ("ReceiveErrorModel", PointerValue (em));
The above code instantiates a RateErrorModel Object, and we set the “ErrorRate” Attribute to the desired value. We then set the resulting instantiated RateErrorModel as the error model used by the point-to-point NetDevice. This will give us some retransmissions and make our plot a little more interesting.
InternetStackHelper stack;
stack.Install (nodes);

Ipv4AddressHelper address;
address.SetBase ("10.1.1.0", "255.255.255.252");
Ipv4InterfaceContainer interfaces = address.Assign (devices);
The above code should be familiar. It installs internet stacks on our two nodes and creates interfaces and assigns IP addresses for the point-to-point devices.
Since we are using TCP, we need something on the destination node to receive TCP connections and data. The PacketSink Application is commonly used in ns-3 for that purpose.
uint16_t sinkPort = 8080;
Address sinkAddress (InetSocketAddress(interfaces.GetAddress (1), sinkPort));
PacketSinkHelper packetSinkHelper ("ns3::TcpSocketFactory",
  InetSocketAddress (Ipv4Address::GetAny (), sinkPort));
ApplicationContainer sinkApps = packetSinkHelper.Install (nodes.Get (1));
sinkApps.Start (Seconds (0.));
sinkApps.Stop (Seconds (20.));
This should all be familiar, with the exception of,
PacketSinkHelper packetSinkHelper ("ns3::TcpSocketFactory",
  InetSocketAddress (Ipv4Address::GetAny (), sinkPort));
This code instantiates a PacketSinkHelper and tells it to create sockets using the class ns3::TcpSocketFactory. This class implements a design pattern called “object factory” which is a commonly used mechanism for specifying a class used to create objects in an abstract way. Here, instead of having to create the objects themselves, you provide the PacketSinkHelper a string that specifies a TypeId string used to create an object which can then be used, in turn, to create instances of the Objects created by the factory.
The remaining parameter tells the Application which address and port it should Bind to.
The next two lines of code will create the socket and connect the trace source.
Ptr<Socket> ns3TcpSocket = Socket::CreateSocket (nodes.Get (0),
  TcpSocketFactory::GetTypeId ());
ns3TcpSocket->TraceConnectWithoutContext ("CongestionWindow",
  MakeCallback (&CwndChange));
The first statement calls the static member function Socket::CreateSocket and provides a Node and an explicit TypeId for the object factory used to create the socket. This is a slightly lower level call than the PacketSinkHelper call above, and uses an explicit C++ type instead of one referred to by a string. Otherwise, it is conceptually the same thing.
Once the TcpSocket is created and attached to the Node, we can use TraceConnectWithoutContext to connect the CongestionWindow trace source to our trace sink.
Recall that we coded an Application so we could take that Socket we just made (during configuration time) and use it in simulation time. We now have to instantiate that Application. We didn’t go to any trouble to create a helper to manage the Application so we are going to have to create and install it “manually”. This is actually quite easy:
Ptr<MyApp> app = CreateObject<MyApp> ();
app->Setup (ns3TcpSocket, sinkAddress, 1040, 1000, DataRate ("1Mbps"));
nodes.Get (0)->AddApplication (app);
app->Start (Seconds (1.));
app->Stop (Seconds (20.));
The first line creates an Object of type MyApp – our Application. The second line tells the Application what Socket to use, what address to connect to, how much data to send at each send event, how many send events to generate and the rate at which to produce data from those events.
Next, we manually add the MyApp Application to the source node and explicitly call the Start and Stop methods on the Application to tell it when to start and stop doing its thing.
We need to actually do the connect from the receiver point-to-point NetDevice to our callback now.
devices.Get (1)->TraceConnectWithoutContext("PhyRxDrop", MakeCallback (&RxDrop));
It should now be obvious that we are getting a reference to the receiving Node NetDevice from its container and connecting the trace source defined by the attribute “PhyRxDrop” on that device to the trace sink RxDrop.
Finally, we tell the simulator to override any Applications and just stop processing events at 20 seconds into the simulation.
  Simulator::Stop (Seconds(20));
  Simulator::Run ();
  Simulator::Destroy ();

  return 0;
}
Recall that as soon as Simulator::Run is called, configuration time ends, and simulation time begins. All of the work we orchestrated by creating the Application and teaching it how to connect and send data actually happens during this function call.
As soon as Simulator::Run returns, the simulation is complete and we enter the teardown phase. In this case, Simulator::Destroy takes care of the gory details and we just return a success code after it completes.
Since we have provided the file fifth.cc for you, if you have built your distribution (in debug mode since it uses NS_LOG – recall that optimized builds optimize out NS_LOGs) it will be waiting for you to run.
$ ./waf --run fifth
Waf: Entering directory `/home/craigdo/repos/ns-3-allinone-dev/ns-3-dev/build'
Waf: Leaving directory `/home/craigdo/repos/ns-3-allinone-dev/ns-3-dev/build'
'build' finished successfully (0.684s)
1.20919 1072
1.21511 1608
1.22103 2144
...
1.2471  8040
1.24895 8576
1.2508  9112
RxDrop at 1.25151
...
You can probably see immediately a downside of using prints of any kind in your traces. We get those extraneous waf messages printed all over our interesting information along with those RxDrop messages. We will remedy that soon, but I’m sure you can’t wait to see the results of all of this work. Let’s redirect that output to a file called cwnd.dat:
$ ./waf --run fifth > cwnd.dat 2>&1
Now edit up “cwnd.dat” in your favorite editor and remove the waf build status and drop lines, leaving only the traced data (you could also comment out the TraceConnectWithoutContext("PhyRxDrop", MakeCallback (&RxDrop)); in the script to get rid of the drop prints just as easily.
You can now run gnuplot (if you have it installed) and tell it to generate some pretty pictures:
$ gnuplot
gnuplot> set terminal png size 640,480
gnuplot> set output "cwnd.png"
gnuplot> plot "cwnd.dat" using 1:2 title 'Congestion Window' with linespoints
gnuplot> exit
You should now have a graph of the congestion window versus time sitting in the file “cwnd.png” that looks like:
In the previous section, we showed how to hook a trace source and get hopefully interesting information out of a simulation. Perhaps you will recall that we called logging to the standard output using std::cout a “Blunt Instrument” much earlier in this chapter. We also wrote about how it was a problem having to parse the log output in order to isolate interesting information. It may have occurred to you that we just spent a lot of time implementing an example that exhibits all of the problems we purport to fix with the ns-3 tracing system! You would be correct. But, bear with us. We’re not done yet.
One of the most important things we want to do is to is to have the ability to easily control the amount of output coming out of the simulation; and we also want to save those data to a file so we can refer back to it later. We can use the mid-level trace helpers provided in ns-3 to do just that and complete the picture.
We provide a script that writes the cwnd change and drop events developed in the example fifth.cc to disk in separate files. The cwnd changes are stored as a tab-separated ASCII file and the drop events are stored in a pcap file. The changes to make this happen are quite small.
Let’s take a look at the changes required to go from fifth.cc to sixth.cc. Open examples/tutorial/fifth.cc in your favorite editor. You can see the first change by searching for CwndChange. You will find that we have changed the signatures for the trace sinks and have added a single line to each sink that writes the traced information to a stream representing a file.
static void
CwndChange (Ptr<OutputStreamWrapper> stream, uint32_t oldCwnd, uint32_t newCwnd)
{
  NS_LOG_UNCOND (Simulator::Now ().GetSeconds () << "\t" << newCwnd);
  *stream->GetStream () << Simulator::Now ().GetSeconds () << "\t" << oldCwnd << "\t" << newCwnd << std::endl;
}

static void
RxDrop (Ptr<PcapFileWrapper> file, Ptr<const Packet> p)
{
  NS_LOG_UNCOND ("RxDrop at " << Simulator::Now ().GetSeconds ());
  file->Write(Simulator::Now(), p);
}
We have added a “stream” parameter to the CwndChange trace sink. This is an object that holds (keeps safely alive) a C++ output stream. It turns out that this is a very simple object, but one that manages lifetime issues for the stream and solves a problem that even experienced C++ users run into. It turns out that the copy constructor for ostream is marked private. This means that ostreams do not obey value semantics and cannot be used in any mechanism that requires the stream to be copied. This includes the ns-3 callback system, which as you may recall, requires objects that obey value semantics. Further notice that we have added the following line in the CwndChange trace sink implementation:
*stream->GetStream () << Simulator::Now ().GetSeconds () << "\t" << oldCwnd << "\t" << newCwnd << std::endl;
This would be very familiar code if you replaced *stream->GetStream () with std::cout, as in:
std::cout << Simulator::Now ().GetSeconds () << "\t" << oldCwnd << "\t" << newCwnd << std::endl;
This illustrates that the Ptr<OutputStreamWrapper> is really just carrying around a std::ofstream for you, and you can use it here like any other output stream.
A similar situation happens in RxDrop except that the object being passed around (a Ptr<PcapFileWrapper>) represents a pcap file. There is a one-liner in the trace sink to write a timestamp and the contents of the packet being dropped to the pcap file:
file->Write(Simulator::Now(), p);
Of course, if we have objects representing the two files, we need to create them somewhere and also cause them to be passed to the trace sinks. If you look in the main function, you will find new code to do just that:
AsciiTraceHelper asciiTraceHelper;
Ptr<OutputStreamWrapper> stream = asciiTraceHelper.CreateFileStream ("sixth.cwnd");
ns3TcpSocket->TraceConnectWithoutContext ("CongestionWindow", MakeBoundCallback (&CwndChange, stream));

...

PcapHelper pcapHelper;
Ptr<PcapFileWrapper> file = pcapHelper.CreateFile ("sixth.pcap", std::ios::out, PcapHelper::DLT_PPP);
devices.Get (1)->TraceConnectWithoutContext("PhyRxDrop", MakeBoundCallback (&RxDrop, file));
In the first section of the code snippet above, we are creating the ASCII trace file, creating an object responsible for managing it and using a variant of the callback creation function to arrange for the object to be passed to the sink. Our ASCII trace helpers provide a rich set of functions to make using text (ASCII) files easy. We are just going to illustrate the use of the file stream creation function here.
The CreateFileStream{} function is basically going to instantiate a std::ofstream object and create a new file (or truncate an existing file). This ofstream is packaged up in an ns-3 object for lifetime management and copy constructor issue resolution.
We then take this ns-3 object representing the file and pass it to MakeBoundCallback(). This function creates a callback just like MakeCallback(), but it “binds” a new value to the callback. This value is added to the callback before it is called.
Essentially, MakeBoundCallback(&CwndChange, stream) causes the trace source to add the additional “stream” parameter to the front of the formal parameter list before invoking the callback. This changes the required signature of the CwndChange sink to match the one shown above, which includes the “extra” parameter Ptr<OutputStreamWrapper> stream.
In the second section of code in the snippet above, we instantiate a PcapHelper to do the same thing for our pcap trace file that we did with the AsciiTraceHelper. The line of code,
Ptr<PcapFileWrapper> file = pcapHelper.CreateFile ("sixth.pcap", "w", PcapHelper::DLT_PPP);
creates a pcap file named “sixth.pcap” with file mode “w”. This means that the new file is to truncated if an existing file with that name is found. The final parameter is the “data link type” of the new pcap file. These are the same as the pcap library data link types defined in bpf.h if you are familar with pcap. In this case, DLT_PPP indicates that the pcap file is going to contain packets prefixed with point to point headers. This is true since the packets are coming from our point-to-point device driver. Other common data link types are DLT_EN10MB (10 MB Ethernet) appropriate for csma devices and DLT_IEEE802_11 (IEEE 802.11) appropriate for wifi devices. These are defined in src/network/helper/trace-helper.h if you are interested in seeing the list. The entries in the list match those in bpf.h but we duplicate them to avoid a pcap source dependence.
A ns-3 object representing the pcap file is returned from CreateFile and used in a bound callback exactly as it was in the ascii case.
An important detour: It is important to notice that even though both of these objects are declared in very similar ways,
Ptr<PcapFileWrapper> file ...
Ptr<OutputStreamWrapper> stream ...
The underlying objects are entirely different. For example, the Ptr<PcapFileWrapper> is a smart pointer to an ns-3 Object that is a fairly heaviweight thing that supports Attributes and is integrated into the config system. The Ptr<OutputStreamWrapper>, on the other hand, is a smart pointer to a reference counted object that is a very lightweight thing. Remember to always look at the object you are referencing before making any assumptions about the “powers” that object may have.
For example, take a look at src/network/utils/pcap-file-wrapper.h in the distribution and notice,
class PcapFileWrapper : public Object
that class PcapFileWrapper is an ns-3 Object by virtue of its inheritance. Then look at src/network/model/output-stream-wrapper.h and notice,
class OutputStreamWrapper : public SimpleRefCount<OutputStreamWrapper>
that this object is not an ns-3 Object at all, it is “merely” a C++ object that happens to support intrusive reference counting.
The point here is that just because you read Ptr<something> it does not necessarily mean that “something” is an ns-3 Object on which you can hang ns-3 Attributes, for example.
Now, back to the example. If you now build and run this example,
$ ./waf --run sixth
you will see the same messages appear as when you ran “fifth”, but two new files will appear in the top-level directory of your ns-3 distribution.
sixth.cwnd sixth.pcap
Since “sixth.cwnd” is an ASCII text file, you can view it with cat or your favorite file viewer.
1.20919 536     1072
1.21511 1072    1608
...
9.30922 8893    8925
9.31754 8925    8957
You have a tab separated file with a timestamp, an old congestion window and a new congestion window suitable for directly importing into your plot program. There are no extraneous prints in the file, no parsing or editing is required.
Since “sixth.pcap” is a pcap file, you can fiew it with tcpdump.
reading from file ../../sixth.pcap, link-type PPP (PPP)
1.251507 IP 10.1.1.1.49153 > 10.1.1.2.8080: . 17689:18225(536) ack 1 win 65535
1.411478 IP 10.1.1.1.49153 > 10.1.1.2.8080: . 33808:34312(504) ack 1 win 65535
...
7.393557 IP 10.1.1.1.49153 > 10.1.1.2.8080: . 781568:782072(504) ack 1 win 65535
8.141483 IP 10.1.1.1.49153 > 10.1.1.2.8080: . 874632:875168(536) ack 1 win 65535
You have a pcap file with the packets that were dropped in the simulation. There are no other packets present in the file and there is nothing else present to make life difficult.
It’s been a long journey, but we are now at a point where we can appreciate the ns-3 tracing system. We have pulled important events out of the middle of a TCP implementation and a device driver. We stored those events directly in files usable with commonly known tools. We did this without modifying any of the core code involved, and we did this in only 18 lines of code:
static void
CwndChange (Ptr<OutputStreamWrapper> stream, uint32_t oldCwnd, uint32_t newCwnd)
{
  NS_LOG_UNCOND (Simulator::Now ().GetSeconds () << "\t" << newCwnd);
  *stream->GetStream () << Simulator::Now ().GetSeconds () << "\t" << oldCwnd << "\t" << newCwnd << std::endl;
}

...

AsciiTraceHelper asciiTraceHelper;
Ptr<OutputStreamWrapper> stream = asciiTraceHelper.CreateFileStream ("sixth.cwnd");
ns3TcpSocket->TraceConnectWithoutContext ("CongestionWindow", MakeBoundCallback (&CwndChange, stream));

...

static void
RxDrop (Ptr<PcapFileWrapper> file, Ptr<const Packet> p)
{
  NS_LOG_UNCOND ("RxDrop at " << Simulator::Now ().GetSeconds ());
  file->Write(Simulator::Now(), p);
}

...

PcapHelper pcapHelper;
Ptr<PcapFileWrapper> file = pcapHelper.CreateFile ("sixth.pcap", "w", PcapHelper::DLT_PPP);
devices.Get (1)->TraceConnectWithoutContext("PhyRxDrop", MakeBoundCallback (&RxDrop, file));
The ns-3 trace helpers provide a rich environment for configuring and selecting different trace events and writing them to files. In previous sections, primarily “Building Topologies,” we have seen several varieties of the trace helper methods designed for use inside other (device) helpers.
Perhaps you will recall seeing some of these variations:
pointToPoint.EnablePcapAll ("second");
pointToPoint.EnablePcap ("second", p2pNodes.Get (0)->GetId (), 0);
csma.EnablePcap ("third", csmaDevices.Get (0), true);
pointToPoint.EnableAsciiAll (ascii.CreateFileStream ("myfirst.tr"));
What may not be obvious, though, is that there is a consistent model for all of the trace-related methods found in the system. We will now take a little time and take a look at the “big picture”.
There are currently two primary use cases of the tracing helpers in ns-3: Device helpers and protocol helpers. Device helpers look at the problem of specifying which traces should be enabled through a node, device pair. For example, you may want to specify that pcap tracing should be enabled on a particular device on a specific node. This follows from the ns-3 device conceptual model, and also the conceptual models of the various device helpers. Following naturally from this, the files created follow a <prefix>-<node>-<device> naming convention.
Protocol helpers look at the problem of specifying which traces should be enabled through a protocol and interface pair. This follows from the ns-3 protocol stack conceptual model, and also the conceptual models of internet stack helpers. Naturally, the trace files should follow a <prefix>-<protocol>-<interface> naming convention.
The trace helpers therefore fall naturally into a two-dimensional taxonomy. There are subtleties that prevent all four classes from behaving identically, but we do strive to make them all work as similarly as possible; and whenever possible there are analogs for all methods in all classes.
pcap ascii Device Helper Protocol Helper
We use an approach called a mixin to add tracing functionality to our helper classes. A mixin is a class that provides functionality to that is inherited by a subclass. Inheriting from a mixin is not considered a form of specialization but is really a way to collect functionality.
Let’s take a quick look at all four of these cases and their respective mixins.
The goal of these helpers is to make it easy to add a consistent pcap trace facility to an ns-3 device. We want all of the various flavors of pcap tracing to work the same across all devices, so the methods of these helpers are inherited by device helpers. Take a look at src/network/helper/trace-helper.h if you want to follow the discussion while looking at real code.
The class PcapHelperForDevice is a mixin provides the high level functionality for using pcap tracing in an ns-3 device. Every device must implement a single virtual method inherited from this class.
virtual void EnablePcapInternal (std::string prefix, Ptr<NetDevice> nd, bool promiscuous, bool explicitFilename) = 0;
The signature of this method reflects the device-centric view of the situation at this level. All of the public methods inherited from class PcapUserHelperForDevice reduce to calling this single device-dependent implementation method. For example, the lowest level pcap method,
void EnablePcap (std::string prefix, Ptr<NetDevice> nd, bool promiscuous = false, bool explicitFilename = false);
will call the device implementation of EnablePcapInternal directly. All other public pcap tracing methods build on this implementation to provide additional user-level functionality. What this means to the user is that all device helpers in the system will have all of the pcap trace methods available; and these methods will all work in the same way across devices if the device implements EnablePcapInternal correctly.
void EnablePcap (std::string prefix, Ptr<NetDevice> nd, bool promiscuous = false, bool explicitFilename = false);
void EnablePcap (std::string prefix, std::string ndName, bool promiscuous = false, bool explicitFilename = false);
void EnablePcap (std::string prefix, NetDeviceContainer d, bool promiscuous = false);
void EnablePcap (std::string prefix, NodeContainer n, bool promiscuous = false);
void EnablePcap (std::string prefix, uint32_t nodeid, uint32_t deviceid, bool promiscuous = false);
void EnablePcapAll (std::string prefix, bool promiscuous = false);
In each of the methods shown above, there is a default parameter called promiscuous that defaults to false. This parameter indicates that the trace should not be gathered in promiscuous mode. If you do want your traces to include all traffic seen by the device (and if the device supports a promiscuous mode) simply add a true parameter to any of the calls above. For example,
Ptr<NetDevice> nd;
...
helper.EnablePcap ("prefix", nd, true);
will enable promiscuous mode captures on the NetDevice specified by nd.
The first two methods also include a default parameter called explicitFilename that will be discussed below.
You are encouraged to peruse the Doxygen for class PcapHelperForDevice to find the details of these methods; but to summarize ...
You can enable pcap tracing on a particular node/net-device pair by providing a Ptr<NetDevice> to an EnablePcap method. The Ptr<Node> is implicit since the net device must belong to exactly one Node. For example,
Ptr<NetDevice> nd;
...
helper.EnablePcap ("prefix", nd);
You can enable pcap tracing on a particular node/net-device pair by providing a std::string representing an object name service string to an EnablePcap method. The Ptr<NetDevice> is looked up from the name string. Again, the <Node> is implicit since the named net device must belong to exactly one Node. For example,
Names::Add ("server" ...);
Names::Add ("server/eth0" ...);
...
helper.EnablePcap ("prefix", "server/ath0");
You can enable pcap tracing on a collection of node/net-device pairs by providing a NetDeviceContainer. For each NetDevice in the container the type is checked. For each device of the proper type (the same type as is managed by the device helper), tracing is enabled. Again, the <Node> is implicit since the found net device must belong to exactly one Node. For example,
NetDeviceContainer d = ...;
...
helper.EnablePcap ("prefix", d);
You can enable pcap tracing on a collection of node/net-device pairs by providing a NodeContainer. For each Node in the NodeContainer its attached NetDevices are iterated. For each NetDevice attached to each node in the container, the type of that device is checked. For each device of the proper type (the same type as is managed by the device helper), tracing is enabled.
NodeContainer n;
...
helper.EnablePcap ("prefix", n);
You can enable pcap tracing on the basis of node ID and device ID as well as with explicit Ptr. Each Node in the system has an integer node ID and each device connected to a node has an integer device ID.
helper.EnablePcap ("prefix", 21, 1);
Finally, you can enable pcap tracing for all devices in the system, with the same type as that managed by the device helper.
helper.EnablePcapAll ("prefix");
Implicit in the method descriptions above is the construction of a complete filename by the implementation method. By convention, pcap traces in the ns-3 system are of the form “<prefix>-<node id>-<device id>.pcap”
As previously mentioned, every node in the system will have a system-assigned node id; and every device will have an interface index (also called a device id) relative to its node. By default, then, a pcap trace file created as a result of enabling tracing on the first device of node 21 using the prefix “prefix” would be “prefix-21-1.pcap”.
You can always use the ns-3 object name service to make this more clear. For example, if you use the object name service to assign the name “server” to node 21, the resulting pcap trace file name will automatically become, “prefix-server-1.pcap” and if you also assign the name “eth0” to the device, your pcap file name will automatically pick this up and be called “prefix-server-eth0.pcap”.
Finally, two of the methods shown above,
void EnablePcap (std::string prefix, Ptr<NetDevice> nd, bool promiscuous = false, bool explicitFilename = false);
void EnablePcap (std::string prefix, std::string ndName, bool promiscuous = false, bool explicitFilename = false);
have a default parameter called explicitFilename. When set to true, this parameter disables the automatic filename completion mechanism and allows you to create an explicit filename. This option is only available in the methods which enable pcap tracing on a single device.
For example, in order to arrange for a device helper to create a single promiscuous pcap capture file of a specific name (“my-pcap-file.pcap”) on a given device, one could:
Ptr<NetDevice> nd;
...
helper.EnablePcap ("my-pcap-file.pcap", nd, true, true);
The first true parameter enables promiscuous mode traces and the second tells the helper to interpret the prefix parameter as a complete filename.
The behavior of the ascii trace helper mixin is substantially similar to the pcap version. Take a look at src/network/helper/trace-helper.h if you want to follow the discussion while looking at real code.
The class AsciiTraceHelperForDevice adds the high level functionality for using ascii tracing to a device helper class. As in the pcap case, every device must implement a single virtual method inherited from the ascii trace mixin.
virtual void EnableAsciiInternal (Ptr<OutputStreamWrapper> stream,
                                  std::string prefix,
                                  Ptr<NetDevice> nd,
                                  bool explicitFilename) = 0;
The signature of this method reflects the device-centric view of the situation at this level; and also the fact that the helper may be writing to a shared output stream. All of the public ascii-trace-related methods inherited from class AsciiTraceHelperForDevice reduce to calling this single device- dependent implementation method. For example, the lowest level ascii trace methods,
void EnableAscii (std::string prefix, Ptr<NetDevice> nd, bool explicitFilename = false);
void EnableAscii (Ptr<OutputStreamWrapper> stream, Ptr<NetDevice> nd);
will call the device implementation of EnableAsciiInternal directly, providing either a valid prefix or stream. All other public ascii tracing methods will build on these low-level functions to provide additional user-level functionality. What this means to the user is that all device helpers in the system will have all of the ascii trace methods available; and these methods will all work in the same way across devices if the devices implement EnablAsciiInternal correctly.
void EnableAscii (std::string prefix, Ptr<NetDevice> nd, bool explicitFilename = false);
void EnableAscii (Ptr<OutputStreamWrapper> stream, Ptr<NetDevice> nd);

void EnableAscii (std::string prefix, std::string ndName, bool explicitFilename = false);
void EnableAscii (Ptr<OutputStreamWrapper> stream, std::string ndName);

void EnableAscii (std::string prefix, NetDeviceContainer d);
void EnableAscii (Ptr<OutputStreamWrapper> stream, NetDeviceContainer d);

void EnableAscii (std::string prefix, NodeContainer n);
void EnableAscii (Ptr<OutputStreamWrapper> stream, NodeContainer n);

void EnableAsciiAll (std::string prefix);
void EnableAsciiAll (Ptr<OutputStreamWrapper> stream);

void EnableAscii (std::string prefix, uint32_t nodeid, uint32_t deviceid, bool explicitFilename);
void EnableAscii (Ptr<OutputStreamWrapper> stream, uint32_t nodeid, uint32_t deviceid);
You are encouraged to peruse the Doxygen for class AsciiTraceHelperForDevice to find the details of these methods; but to summarize ...
There are twice as many methods available for ascii tracing as there were for pcap tracing. This is because, in addition to the pcap-style model where traces from each unique node/device pair are written to a unique file, we support a model in which trace information for many node/device pairs is written to a common file. This means that the <prefix>-<node>-<device> file name generation mechanism is replaced by a mechanism to refer to a common file; and the number of API methods is doubled to allow all combinations.
Just as in pcap tracing, you can enable ascii tracing on a particular node/net-device pair by providing a Ptr<NetDevice> to an EnableAscii method. The Ptr<Node> is implicit since the net device must belong to exactly one Node. For example,
Ptr<NetDevice> nd;
...
helper.EnableAscii ("prefix", nd);
The first four methods also include a default parameter called explicitFilename that operate similar to equivalent parameters in the pcap case.
In this case, no trace contexts are written to the ascii trace file since they would be redundant. The system will pick the file name to be created using the same rules as described in the pcap section, except that the file will have the suffix ”.tr” instead of ”.pcap”.
If you want to enable ascii tracing on more than one net device and have all traces sent to a single file, you can do that as well by using an object to refer to a single file. We have already seen this in the “cwnd” example above:
Ptr<NetDevice> nd1;
Ptr<NetDevice> nd2;
...
Ptr<OutputStreamWrapper> stream = asciiTraceHelper.CreateFileStream ("trace-file-name.tr");
...
helper.EnableAscii (stream, nd1);
helper.EnableAscii (stream, nd2);
In this case, trace contexts are written to the ascii trace file since they are required to disambiguate traces from the two devices. Note that since the user is completely specifying the file name, the string should include the ”,tr” for consistency.
You can enable ascii tracing on a particular node/net-device pair by providing a std::string representing an object name service string to an EnablePcap method. The Ptr<NetDevice> is looked up from the name string. Again, the <Node> is implicit since the named net device must belong to exactly one Node. For example,
Names::Add ("client" ...);
Names::Add ("client/eth0" ...);
Names::Add ("server" ...);
Names::Add ("server/eth0" ...);
...
helper.EnableAscii ("prefix", "client/eth0");
helper.EnableAscii ("prefix", "server/eth0");
This would result in two files named “prefix-client-eth0.tr” and “prefix-server-eth0.tr” with traces for each device in the respective trace file. Since all of the EnableAscii functions are overloaded to take a stream wrapper, you can use that form as well:
Names::Add ("client" ...);
Names::Add ("client/eth0" ...);
Names::Add ("server" ...);
Names::Add ("server/eth0" ...);
...
Ptr<OutputStreamWrapper> stream = asciiTraceHelper.CreateFileStream ("trace-file-name.tr");
...
helper.EnableAscii (stream, "client/eth0");
helper.EnableAscii (stream, "server/eth0");
This would result in a single trace file called “trace-file-name.tr” that contains all of the trace events for both devices. The events would be disambiguated by trace context strings.
You can enable ascii tracing on a collection of node/net-device pairs by providing a NetDeviceContainer. For each NetDevice in the container the type is checked. For each device of the proper type (the same type as is managed by the device helper), tracing is enabled. Again, the <Node> is implicit since the found net device must belong to exactly one Node. For example,
NetDeviceContainer d = ...;
...
helper.EnableAscii ("prefix", d);
This would result in a number of ascii trace files being created, each of which follows the <prefix>-<node id>-<device id>.tr convention. Combining all of the traces into a single file is accomplished similarly to the examples above:
NetDeviceContainer d = ...;
...
Ptr<OutputStreamWrapper> stream = asciiTraceHelper.CreateFileStream ("trace-file-name.tr");
...
helper.EnableAscii (stream, d);
You can enable ascii tracing on a collection of node/net-device pairs by providing a NodeContainer. For each Node in the NodeContainer its attached NetDevices are iterated. For each NetDevice attached to each node in the container, the type of that device is checked. For each device of the proper type (the same type as is managed by the device helper), tracing is enabled.
NodeContainer n;
...
helper.EnableAscii ("prefix", n);
This would result in a number of ascii trace files being created, each of which follows the <prefix>-<node id>-<device id>.tr convention. Combining all of the traces into a single file is accomplished similarly to the examples above:
You can enable pcap tracing on the basis of node ID and device ID as well as with explicit Ptr. Each Node in the system has an integer node ID and each device connected to a node has an integer device ID.
helper.EnableAscii ("prefix", 21, 1);
Of course, the traces can be combined into a single file as shown above.
Finally, you can enable pcap tracing for all devices in the system, with the same type as that managed by the device helper.
helper.EnableAsciiAll ("prefix");
This would result in a number of ascii trace files being created, one for every device in the system of the type managed by the helper. All of these files will follow the <prefix>-<node id>-<device id>.tr convention. Combining all of the traces into a single file is accomplished similarly to the examples above.
Implicit in the prefix-style method descriptions above is the construction of the complete filenames by the implementation method. By convention, ascii traces in the ns-3 system are of the form “<prefix>-<node id>-<device id>.tr”
As previously mentioned, every node in the system will have a system-assigned node id; and every device will have an interface index (also called a device id) relative to its node. By default, then, an ascii trace file created as a result of enabling tracing on the first device of node 21, using the prefix “prefix”, would be “prefix-21-1.tr”.
You can always use the ns-3 object name service to make this more clear. For example, if you use the object name service to assign the name “server” to node 21, the resulting ascii trace file name will automatically become, “prefix-server-1.tr” and if you also assign the name “eth0” to the device, your ascii trace file name will automatically pick this up and be called “prefix-server-eth0.tr”.
Several of the methods have a default parameter called explicitFilename. When set to true, this parameter disables the automatic filename completion mechanism and allows you to create an explicit filename. This option is only available in the methods which take a prefix and enable tracing on a single device.
The goal of these mixins is to make it easy to add a consistent pcap trace facility to protocols. We want all of the various flavors of pcap tracing to work the same across all protocols, so the methods of these helpers are inherited by stack helpers. Take a look at src/network/helper/trace-helper.h if you want to follow the discussion while looking at real code.
In this section we will be illustrating the methods as applied to the protocol Ipv4. To specify traces in similar protocols, just substitute the appropriate type. For example, use a Ptr<Ipv6> instead of a Ptr<Ipv4> and call EnablePcapIpv6 instead of EnablePcapIpv4.
The class PcapHelperForIpv4 provides the high level functionality for using pcap tracing in the Ipv4 protocol. Each protocol helper enabling these methods must implement a single virtual method inherited from this class. There will be a separate implementation for Ipv6, for example, but the only difference will be in the method names and signatures. Different method names are required to disambiguate class Ipv4 from Ipv6 which are both derived from class Object, and methods that share the same signature.
virtual void EnablePcapIpv4Internal (std::string prefix,
                                     Ptr<Ipv4> ipv4,
                                     uint32_t interface,
                                     bool explicitFilename) = 0;
The signature of this method reflects the protocol and interface-centric view of the situation at this level. All of the public methods inherited from class PcapHelperForIpv4 reduce to calling this single device-dependent implementation method. For example, the lowest level pcap method,
void EnablePcapIpv4 (std::string prefix, Ptr<Ipv4> ipv4, uint32_t interface, bool explicitFilename = false);
will call the device implementation of EnablePcapIpv4Internal directly. All other public pcap tracing methods build on this implementation to provide additional user-level functionality. What this means to the user is that all protocol helpers in the system will have all of the pcap trace methods available; and these methods will all work in the same way across protocols if the helper implements EnablePcapIpv4Internal correctly.
These methods are designed to be in one-to-one correspondence with the Node- and NetDevice- centric versions of the device versions. Instead of Node and NetDevice pair constraints, we use protocol and interface constraints.
Note that just like in the device version, there are six methods:
void EnablePcapIpv4 (std::string prefix, Ptr<Ipv4> ipv4, uint32_t interface, bool explicitFilename = false);
void EnablePcapIpv4 (std::string prefix, std::string ipv4Name, uint32_t interface, bool explicitFilename = false);
void EnablePcapIpv4 (std::string prefix, Ipv4InterfaceContainer c);
void EnablePcapIpv4 (std::string prefix, NodeContainer n);
void EnablePcapIpv4 (std::string prefix, uint32_t nodeid, uint32_t interface, bool explicitFilename);
void EnablePcapIpv4All (std::string prefix);
You are encouraged to peruse the Doxygen for class PcapHelperForIpv4 to find the details of these methods; but to summarize ...
You can enable pcap tracing on a particular protocol/interface pair by providing a Ptr<Ipv4> and interface to an EnablePcap method. For example,
Ptr<Ipv4> ipv4 = node->GetObject<Ipv4> ();
...
helper.EnablePcapIpv4 ("prefix", ipv4, 0);
You can enable pcap tracing on a particular node/net-device pair by providing a std::string representing an object name service string to an EnablePcap method. The Ptr<Ipv4> is looked up from the name string. For example,
Names::Add ("serverIPv4" ...);
...
helper.EnablePcapIpv4 ("prefix", "serverIpv4", 1);
You can enable pcap tracing on a collection of protocol/interface pairs by providing an Ipv4InterfaceContainer. For each Ipv4 / interface pair in the container the protocol type is checked. For each protocol of the proper type (the same type as is managed by the device helper), tracing is enabled for the corresponding interface. For example,
NodeContainer nodes;
...
NetDeviceContainer devices = deviceHelper.Install (nodes);
...
Ipv4AddressHelper ipv4;
ipv4.SetBase ("10.1.1.0", "255.255.255.0");
Ipv4InterfaceContainer interfaces = ipv4.Assign (devices);
...
helper.EnablePcapIpv4 ("prefix", interfaces);
You can enable pcap tracing on a collection of protocol/interface pairs by providing a NodeContainer. For each Node in the NodeContainer the appropriate protocol is found. For each protocol, its interfaces are enumerated and tracing is enabled on the resulting pairs. For example,
NodeContainer n;
...
helper.EnablePcapIpv4 ("prefix", n);
You can enable pcap tracing on the basis of node ID and interface as well. In this case, the node-id is translated to a Ptr<Node> and the appropriate protocol is looked up in the node. The resulting protocol and interface are used to specify the resulting trace source.
helper.EnablePcapIpv4 ("prefix", 21, 1);
Finally, you can enable pcap tracing for all interfaces in the system, with associated protocol being the same type as that managed by the device helper.
helper.EnablePcapIpv4All ("prefix");
Implicit in all of the method descriptions above is the construction of the complete filenames by the implementation method. By convention, pcap traces taken for devices in the ns-3 system are of the form “<prefix>-<node id>-<device id>.pcap”. In the case of protocol traces, there is a one-to-one correspondence between protocols and Nodes. This is because protocol Objects are aggregated to Node Objects. Since there is no global protocol id in the system, we use the corresponding node id in file naming. Therefore there is a possibility for file name collisions in automatically chosen trace file names. For this reason, the file name convention is changed for protocol traces.
As previously mentioned, every node in the system will have a system-assigned node id. Since there is a one-to-one correspondence between protocol instances and node instances we use the node id. Each interface has an interface id relative to its protocol. We use the convention “<prefix>-n<node id>-i<interface id>.pcap” for trace file naming in protocol helpers.
Therefore, by default, a pcap trace file created as a result of enabling tracing on interface 1 of the Ipv4 protocol of node 21 using the prefix “prefix” would be “prefix-n21-i1.pcap”.
You can always use the ns-3 object name service to make this more clear. For example, if you use the object name service to assign the name “serverIpv4” to the Ptr<Ipv4> on node 21, the resulting pcap trace file name will automatically become, “prefix-nserverIpv4-i1.pcap”.
Several of the methods have a default parameter called explicitFilename. When set to true, this parameter disables the automatic filename completion mechanism and allows you to create an explicit filename. This option is only available in the methods which take a prefix and enable tracing on a single device.
The behavior of the ascii trace helpers is substantially similar to the pcap case. Take a look at src/network/helper/trace-helper.h if you want to follow the discussion while looking at real code.
In this section we will be illustrating the methods as applied to the protocol Ipv4. To specify traces in similar protocols, just substitute the appropriate type. For example, use a Ptr<Ipv6> instead of a Ptr<Ipv4> and call EnableAsciiIpv6 instead of EnableAsciiIpv4.
The class AsciiTraceHelperForIpv4 adds the high level functionality for using ascii tracing to a protocol helper. Each protocol that enables these methods must implement a single virtual method inherited from this class.
virtual void EnableAsciiIpv4Internal (Ptr<OutputStreamWrapper> stream,
                                      std::string prefix,
                                      Ptr<Ipv4> ipv4,
                                      uint32_t interface,
                                      bool explicitFilename) = 0;
The signature of this method reflects the protocol- and interface-centric view of the situation at this level; and also the fact that the helper may be writing to a shared output stream. All of the public methods inherited from class PcapAndAsciiTraceHelperForIpv4 reduce to calling this single device- dependent implementation method. For example, the lowest level ascii trace methods,
void EnableAsciiIpv4 (std::string prefix, Ptr<Ipv4> ipv4, uint32_t interface, bool explicitFilename = false);
void EnableAsciiIpv4 (Ptr<OutputStreamWrapper> stream, Ptr<Ipv4> ipv4, uint32_t interface);
will call the device implementation of EnableAsciiIpv4Internal directly, providing either the prefix or the stream. All other public ascii tracing methods will build on these low-level functions to provide additional user-level functionality. What this means to the user is that all device helpers in the system will have all of the ascii trace methods available; and these methods will all work in the same way across protocols if the protocols implement EnablAsciiIpv4Internal correctly.
void EnableAsciiIpv4 (std::string prefix, Ptr<Ipv4> ipv4, uint32_t interface, bool explicitFilename = false);
void EnableAsciiIpv4 (Ptr<OutputStreamWrapper> stream, Ptr<Ipv4> ipv4, uint32_t interface);

void EnableAsciiIpv4 (std::string prefix, std::string ipv4Name, uint32_t interface, bool explicitFilename = false);
void EnableAsciiIpv4 (Ptr<OutputStreamWrapper> stream, std::string ipv4Name, uint32_t interface);

void EnableAsciiIpv4 (std::string prefix, Ipv4InterfaceContainer c);
void EnableAsciiIpv4 (Ptr<OutputStreamWrapper> stream, Ipv4InterfaceContainer c);

void EnableAsciiIpv4 (std::string prefix, NodeContainer n);
void EnableAsciiIpv4 (Ptr<OutputStreamWrapper> stream, NodeContainer n);

void EnableAsciiIpv4All (std::string prefix);
void EnableAsciiIpv4All (Ptr<OutputStreamWrapper> stream);

void EnableAsciiIpv4 (std::string prefix, uint32_t nodeid, uint32_t deviceid, bool explicitFilename);
void EnableAsciiIpv4 (Ptr<OutputStreamWrapper> stream, uint32_t nodeid, uint32_t interface);
You are encouraged to peruse the Doxygen for class PcapAndAsciiHelperForIpv4 to find the details of these methods; but to summarize ...
There are twice as many methods available for ascii tracing as there were for pcap tracing. This is because, in addition to the pcap-style model where traces from each unique protocol/interface pair are written to a unique file, we support a model in which trace information for many protocol/interface pairs is written to a common file. This means that the <prefix>-n<node id>-<interface> file name generation mechanism is replaced by a mechanism to refer to a common file; and the number of API methods is doubled to allow all combinations.
Just as in pcap tracing, you can enable ascii tracing on a particular protocol/interface pair by providing a Ptr<Ipv4> and an interface to an EnableAscii method. For example,
Ptr<Ipv4> ipv4;
...
helper.EnableAsciiIpv4 ("prefix", ipv4, 1);
In this case, no trace contexts are written to the ascii trace file since they would be redundant. The system will pick the file name to be created using the same rules as described in the pcap section, except that the file will have the suffix ”.tr” instead of ”.pcap”.
If you want to enable ascii tracing on more than one interface and have all traces sent to a single file, you can do that as well by using an object to refer to a single file. We have already something similar to this in the “cwnd” example above:
Ptr<Ipv4> protocol1 = node1->GetObject<Ipv4> ();
Ptr<Ipv4> protocol2 = node2->GetObject<Ipv4> ();
...
Ptr<OutputStreamWrapper> stream = asciiTraceHelper.CreateFileStream ("trace-file-name.tr");
...
helper.EnableAsciiIpv4 (stream, protocol1, 1);
helper.EnableAsciiIpv4 (stream, protocol2, 1);
In this case, trace contexts are written to the ascii trace file since they are required to disambiguate traces from the two interfaces. Note that since the user is completely specifying the file name, the string should include the ”,tr” for consistency.
You can enable ascii tracing on a particular protocol by providing a std::string representing an object name service string to an EnablePcap method. The Ptr<Ipv4> is looked up from the name string. The <Node> in the resulting filenames is implicit since there is a one-to-one correspondence between protocol instances and nodes, For example,
Names::Add ("node1Ipv4" ...);
Names::Add ("node2Ipv4" ...);
...
helper.EnableAsciiIpv4 ("prefix", "node1Ipv4", 1);
helper.EnableAsciiIpv4 ("prefix", "node2Ipv4", 1);
This would result in two files named “prefix-nnode1Ipv4-i1.tr” and “prefix-nnode2Ipv4-i1.tr” with traces for each interface in the respective trace file. Since all of the EnableAscii functions are overloaded to take a stream wrapper, you can use that form as well:
Names::Add ("node1Ipv4" ...);
Names::Add ("node2Ipv4" ...);
...
Ptr<OutputStreamWrapper> stream = asciiTraceHelper.CreateFileStream ("trace-file-name.tr");
...
helper.EnableAsciiIpv4 (stream, "node1Ipv4", 1);
helper.EnableAsciiIpv4 (stream, "node2Ipv4", 1);
This would result in a single trace file called “trace-file-name.tr” that contains all of the trace events for both interfaces. The events would be disambiguated by trace context strings.
You can enable ascii tracing on a collection of protocol/interface pairs by providing an Ipv4InterfaceContainer. For each protocol of the proper type (the same type as is managed by the device helper), tracing is enabled for the corresponding interface. Again, the <Node> is implicit since there is a one-to-one correspondence between each protocol and its node. For example,
NodeContainer nodes;
...
NetDeviceContainer devices = deviceHelper.Install (nodes);
...
Ipv4AddressHelper ipv4;
ipv4.SetBase ("10.1.1.0", "255.255.255.0");
Ipv4InterfaceContainer interfaces = ipv4.Assign (devices);
...
...
helper.EnableAsciiIpv4 ("prefix", interfaces);
This would result in a number of ascii trace files being created, each of which follows the <prefix>-n<node id>-i<interface>.tr convention. Combining all of the traces into a single file is accomplished similarly to the examples above:
NodeContainer nodes;
...
NetDeviceContainer devices = deviceHelper.Install (nodes);
...
Ipv4AddressHelper ipv4;
ipv4.SetBase ("10.1.1.0", "255.255.255.0");
Ipv4InterfaceContainer interfaces = ipv4.Assign (devices);
...
Ptr<OutputStreamWrapper> stream = asciiTraceHelper.CreateFileStream ("trace-file-name.tr");
...
helper.EnableAsciiIpv4 (stream, interfaces);
You can enable ascii tracing on a collection of protocol/interface pairs by providing a NodeContainer. For each Node in the NodeContainer the appropriate protocol is found. For each protocol, its interfaces are enumerated and tracing is enabled on the resulting pairs. For example,
NodeContainer n;
...
helper.EnableAsciiIpv4 ("prefix", n);
This would result in a number of ascii trace files being created, each of which follows the <prefix>-<node id>-<device id>.tr convention. Combining all of the traces into a single file is accomplished similarly to the examples above:
You can enable pcap tracing on the basis of node ID and device ID as well. In this case, the node-id is translated to a Ptr<Node> and the appropriate protocol is looked up in the node. The resulting protocol and interface are used to specify the resulting trace source.
helper.EnableAsciiIpv4 ("prefix", 21, 1);
Of course, the traces can be combined into a single file as shown above.
Finally, you can enable ascii tracing for all interfaces in the system, with associated protocol being the same type as that managed by the device helper.
helper.EnableAsciiIpv4All ("prefix");
This would result in a number of ascii trace files being created, one for every interface in the system related to a protocol of the type managed by the helper. All of these files will follow the <prefix>-n<node id>-i<interface.tr convention. Combining all of the traces into a single file is accomplished similarly to the examples above.
Implicit in the prefix-style method descriptions above is the construction of the complete filenames by the implementation method. By convention, ascii traces in the ns-3 system are of the form “<prefix>-<node id>-<device id>.tr”
As previously mentioned, every node in the system will have a system-assigned node id. Since there is a one-to-one correspondence between protocols and nodes we use to node-id to identify the protocol identity. Every interface on a given protocol will have an interface index (also called simply an interface) relative to its protocol. By default, then, an ascii trace file created as a result of enabling tracing on the first device of node 21, using the prefix “prefix”, would be “prefix-n21-i1.tr”. Use the prefix to disambiguate multiple protocols per node.
You can always use the ns-3 object name service to make this more clear. For example, if you use the object name service to assign the name “serverIpv4” to the protocol on node 21, and also specify interface one, the resulting ascii trace file name will automatically become, “prefix-nserverIpv4-1.tr”.
Several of the methods have a default parameter called explicitFilename. When set to true, this parameter disables the automatic filename completion mechanism and allows you to create an explicit filename. This option is only available in the methods which take a prefix and enable tracing on a single device.
ns-3 includes an extremely rich environment allowing users at several levels to customize the kinds of information that can be extracted from simulations.
There are high-level helper functions that allow users to simply control the collection of pre-defined outputs to a fine granularity. There are mid-level helper functions to allow more sophisticated users to customize how information is extracted and saved; and there are low-level core functions to allow expert users to alter the system to present new and previously unexported information in a way that will be immediately accessible to users at higher levels.
This is a very comprehensive system, and we realize that it is a lot to digest, especially for new users or those not intimately familiar with C++ and its idioms. We do consider the tracing system a very important part of ns-3 and so recommend becoming as familiar as possible with it. It is probably the case that understanding the rest of the ns-3 system will be quite simple once you have mastered the tracing system
