
|
A Discrete-Event Network Simulator
|
Manual |
|
|
A Discrete-Event Network Simulator
|
Manual |
There are 2 common methods to make a plot using ns-3 and gnuplot (http://www.gnuplot.info):
This section is about method 1, i.e. it is about how to make a plot using ns-3‘s Gnuplot class. If you are interested in method 2, see the “A Real Example” subsection under the “Tracing” section in the ns-3 Tutorial.
The following steps must be taken in order to create a plot using ns-3‘s Gnuplot class:
See the code from the example plots that are discussed below for details on step 1.
An example program that uses ns-3‘s Gnuplot class can be found here:
src/stats/examples/gnuplot-example.cc
In order to run this example, do the following:
$ ./waf shell
$ cd build/debug/src/stats/examples
$ ./gnuplot-example
This should produce the following gnuplot control files in the directory where the example is located:
plot-2d.plt
plot-2d-with-error-bars.plt
plot-3d.plt
In order to process these gnuplot control files, do the following:
$ gnuplot plot-2d.plt
$ gnuplot plot-2d-with-error-bars.plt
$ gnuplot plot-3d.plt
This should produce the following graphics files in the directory where the example is located:
plot-2d.png
plot-2d-with-error-bars.png
plot-3d.png
You can view these graphics files in your favorite graphics viewer. If you have gimp installed on your machine, for example, you can do this:
$ gimp plot-2d.png
$ gimp plot-2d-with-error-bars.png
$ gimp plot-3d.png
The following 2-Dimensional plot
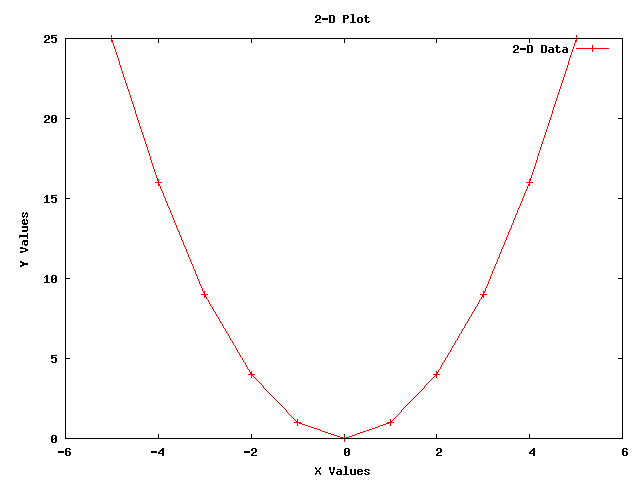
was created using the following code from gnuplot-example.cc:
using namespace std;

string fileNameWithNoExtension = "plot-2d";
string graphicsFileName        = fileNameWithNoExtension + ".png";
string plotFileName            = fileNameWithNoExtension + ".plt";
string plotTitle               = "2-D Plot";
string dataTitle               = "2-D Data";

// Instantiate the plot and set its title.
Gnuplot plot (graphicsFileName);
plot.SetTitle (plotTitle);

// Make the graphics file, which the plot file will create when it
// is used with Gnuplot, be a PNG file.
plot.SetTerminal ("png");

// Set the labels for each axis.
plot.SetLegend ("X Values", "Y Values");

// Set the range for the x axis.
plot.AppendExtra ("set xrange [-6:+6]");

// Instantiate the dataset, set its title, and make the points be
// plotted along with connecting lines.
Gnuplot2dDataset dataset;
dataset.SetTitle (dataTitle);
dataset.SetStyle (Gnuplot2dDataset::LINES_POINTS);

double x;
double y;

// Create the 2-D dataset.
for (x = -5.0; x <= +5.0; x += 1.0)
  {
    // Calculate the 2-D curve
    //
    //            2
    //     y  =  x   .
    //
    y = x * x;

    // Add this point.
    dataset.Add (x, y);
  }

// Add the dataset to the plot.
plot.AddDataset (dataset);

// Open the plot file.
ofstream plotFile (plotFileName.c_str());

// Write the plot file.
plot.GenerateOutput (plotFile);

// Close the plot file.
plotFile.close ();
The following 2-Dimensional plot with error bars in the x and y directions
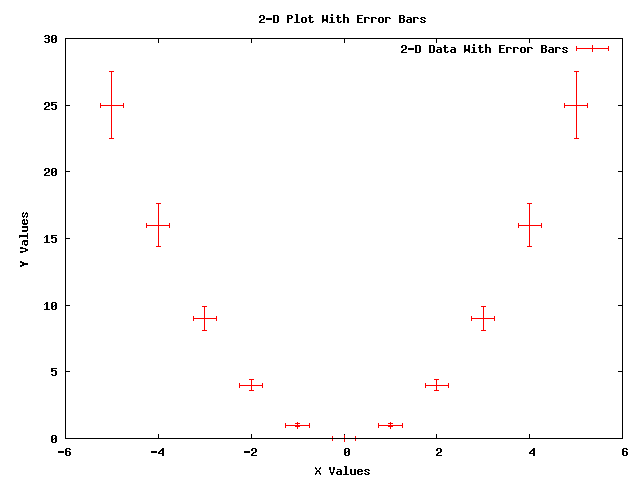
was created using the following code from gnuplot-example.cc:
using namespace std;

string fileNameWithNoExtension = "plot-2d-with-error-bars";
string graphicsFileName        = fileNameWithNoExtension + ".png";
string plotFileName            = fileNameWithNoExtension + ".plt";
string plotTitle               = "2-D Plot With Error Bars";
string dataTitle               = "2-D Data With Error Bars";

// Instantiate the plot and set its title.
Gnuplot plot (graphicsFileName);
plot.SetTitle (plotTitle);

// Make the graphics file, which the plot file will create when it
// is used with Gnuplot, be a PNG file.
plot.SetTerminal ("png");

// Set the labels for each axis.
plot.SetLegend ("X Values", "Y Values");

// Set the range for the x axis.
plot.AppendExtra ("set xrange [-6:+6]");

// Instantiate the dataset, set its title, and make the points be
// plotted with no connecting lines.
Gnuplot2dDataset dataset;
dataset.SetTitle (dataTitle);
dataset.SetStyle (Gnuplot2dDataset::POINTS);

// Make the dataset have error bars in both the x and y directions.
dataset.SetErrorBars (Gnuplot2dDataset::XY);

double x;
double xErrorDelta;
double y;
double yErrorDelta;

// Create the 2-D dataset.
for (x = -5.0; x <= +5.0; x += 1.0)
  {
    // Calculate the 2-D curve
    //
    //            2
    //     y  =  x   .
    //
    y = x * x;

    // Make the uncertainty in the x direction be constant and make
    // the uncertainty in the y direction be a constant fraction of
    // y's value.
    xErrorDelta = 0.25;
    yErrorDelta = 0.1 * y;

    // Add this point with uncertainties in both the x and y
    // direction.
    dataset.Add (x, y, xErrorDelta, yErrorDelta);
  }

// Add the dataset to the plot.
plot.AddDataset (dataset);

// Open the plot file.
ofstream plotFile (plotFileName.c_str());

// Write the plot file.
plot.GenerateOutput (plotFile);

// Close the plot file.
plotFile.close ();
The following 3-Dimensional plot
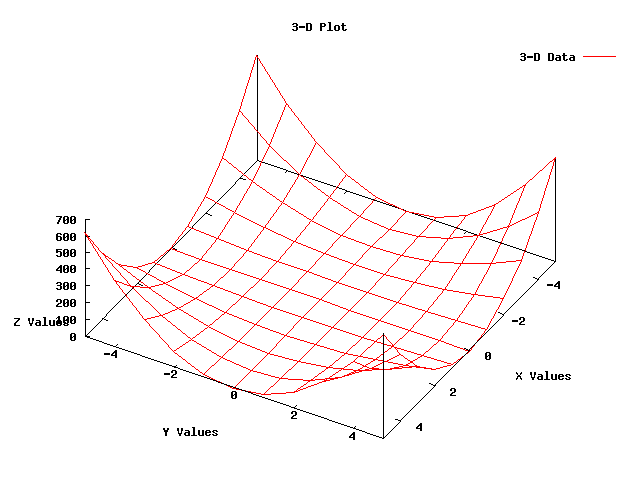
was created using the following code from gnuplot-example.cc:
using namespace std;

string fileNameWithNoExtension = "plot-3d";
string graphicsFileName        = fileNameWithNoExtension + ".png";
string plotFileName            = fileNameWithNoExtension + ".plt";
string plotTitle               = "3-D Plot";
string dataTitle               = "3-D Data";

// Instantiate the plot and set its title.
Gnuplot plot (graphicsFileName);
plot.SetTitle (plotTitle);

// Make the graphics file, which the plot file will create when it
// is used with Gnuplot, be a PNG file.
plot.SetTerminal ("png");

// Rotate the plot 30 degrees around the x axis and then rotate the
// plot 120 degrees around the new z axis.
plot.AppendExtra ("set view 30, 120, 1.0, 1.0");

// Make the zero for the z-axis be in the x-axis and y-axis plane.
plot.AppendExtra ("set ticslevel 0");

// Set the labels for each axis.
plot.AppendExtra ("set xlabel 'X Values'");
plot.AppendExtra ("set ylabel 'Y Values'");
plot.AppendExtra ("set zlabel 'Z Values'");

// Set the ranges for the x and y axis.
plot.AppendExtra ("set xrange [-5:+5]");
plot.AppendExtra ("set yrange [-5:+5]");

// Instantiate the dataset, set its title, and make the points be
// connected by lines.
Gnuplot3dDataset dataset;
dataset.SetTitle (dataTitle);
dataset.SetStyle ("with lines");

double x;
double y;
double z;

// Create the 3-D dataset.
for (x = -5.0; x <= +5.0; x += 1.0)
  {
  for (y = -5.0; y <= +5.0; y += 1.0)
      {
        // Calculate the 3-D surface
        //
        //            2      2
        //     z  =  x   *  y   .
        //
        z = x * x * y * y;

        // Add this point.
        dataset.Add (x, y, z);
      }

  // The blank line is necessary at the end of each x value's data
  // points for the 3-D surface grid to work.
  dataset.AddEmptyLine ();
  }

// Add the dataset to the plot.
plot.AddDataset (dataset);

// Open the plot file.
ofstream plotFile (plotFileName.c_str());

// Write the plot file.
plot.GenerateOutput (plotFile);

// Close the plot file.
plotFile.close ();