Li-Ion model fitting
A typical discharge curve, with the nominal and exponential zones highlighted, is shown in figure.
To fit the Li-Ion energy model [1] to a specific type of cell, it is necessary to extract several parameters out from the datasheet.
In this page we'll give two examples to help the user in the fitting process.
During the fitting process it is better to first fit the model to a "reference" discharge current in the datasheet and then, slightly modify the model's parameters to fit it to the other discharge curves.
Parameters extraction & results
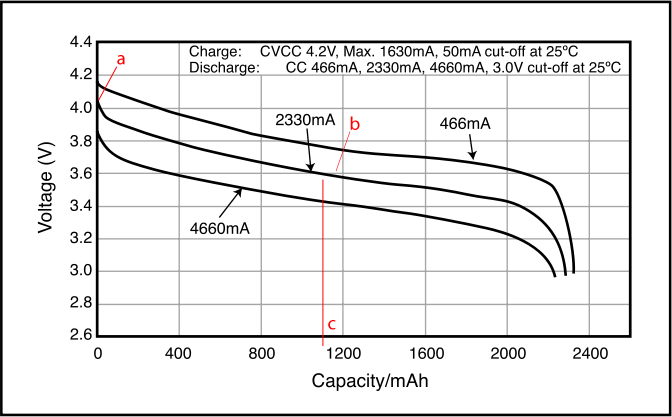
Into the LiIonEnergyModel class, there are several parameters that characterizes the model's behaviour. We'll take the Panasonic CGR18650DA cell datasheet [2] as reference. The reference discharge current is 2330 mA.
We give a description for each of those parameters and highlight them on the datasheet:
- IntialCellVoltage, is the fully charged cell's voltage (a)
- NominalCellVoltage, is the nominal voltage of the cell, 3.6 V
- ExpCellVoltage, is the voltage at the end of the exponential zone, 3.6 V (b)
- RatedCapacity, is the nominal capacity of the cell, 2.45 Ah
- NomCapacity, is the capacity at the end of the nominal zone, 1.1 Ah (c)
- ExpCapacity, is the capacity at the end of the exponential zone, 1.2 Ah (b)
- InternalResistance, is the internal resistance of cell, usually not found in datasheet this value must be extracted from the discharge curves, it affects the behaviour of the cell at different discharge currents, 0.083 Ohms
- TypCurrent, is the discharge current used as reference, 2.33 Ah
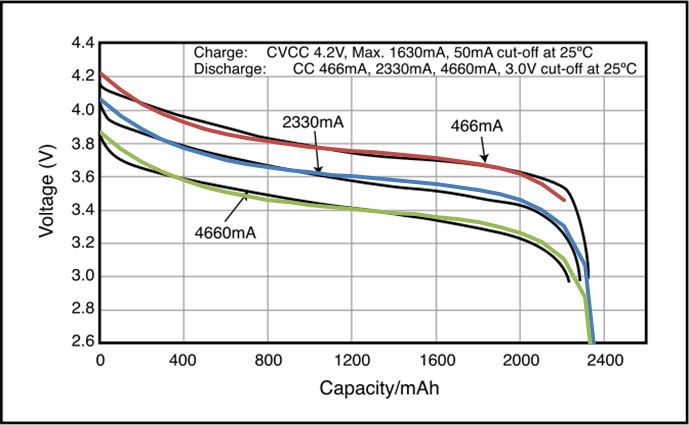
With these values, the approximation of different discharge curves is shown in figure.
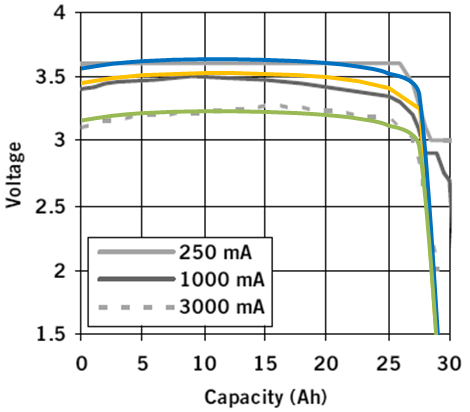
For completeness we report also the values used to fit the model to the Eclectrochem 3B36 cell [3]:
- IntialCellVoltage, 3.45 V
- NominalCellVoltage, 3.3 V
- ExpCellVoltage, 3.55 V
- RatedCapacity, 30.0 Ah
- NomCapacity, 27.0 Ah
- ExpCapacity, 15.0 Ah
- InternalResistance, 0.145 Ohms
- TypCurrent, 1.0 Ah
The results are shown in figure.
Notes
The firsts times you put the values into the model, you can find disappointing results. Keep in mind that this is a model and you may have to manually fit the results.
One of the key values are the exponential zone's ones. Changing these you can modify the slope of the discharge curve and its smoothness. Another key value is the internal resistance that will make moves the discharge curves at different currents drain.
For a quick feddback of the parameters change we recommend to use an Excel worksheet.


