RandomNumberGeneratorUniform: Difference between revisions
No edit summary |
No edit summary |
||
| Line 12: | Line 12: | ||
=== Outcome === | === Outcome === | ||
<font color="Red" size=5> Text </font> | |||
Since this is less than the rejection value of 67.5048 we can state with 95% confidence that the chi square statistic we measured is conistent with statistical fluctuations and that the ns-3 uniform random number generator does, in fact, generate uniformly distributed random numbers. | Since this is less than the rejection value of 67.5048 we can state with 95% confidence that the chi square statistic we measured is conistent with statistical fluctuations and that the ns-3 uniform random number generator does, in fact, generate uniformly distributed random numbers. | ||
Revision as of 00:03, 18 April 2009
Uniform Random Number Generator Validation
The Uniform Random Number Generator of ns-3 advertizes itself as able to generate a sequence of random numbers that is uniformly distributed across a range. The ns-3 class that implements this behavior is UniformVariable. By default it produces a sequence of double values in the range [0, 1).
Our goal is to validate that the random number generator does, in fact, do this.
Methodology
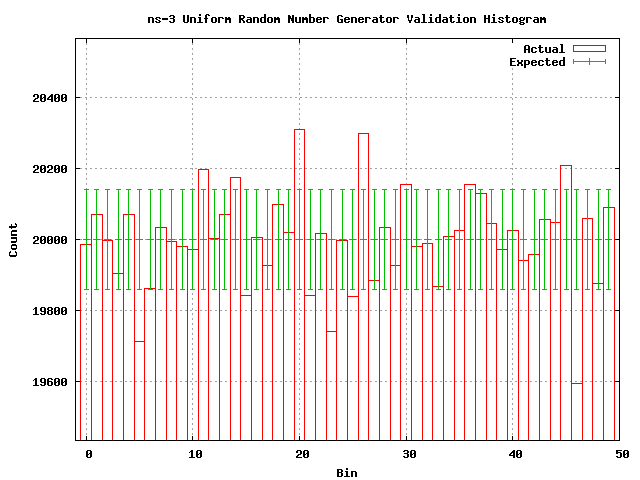
We apply a chi square test of goodness of fit to evaluate the function. We create a histogram with 50 bins uniformly distributed across the range [0, 1) and generate 1 000 000 random numbers which we assign to appropriate bins in the histogram.
Since the expected value is provided for us (we do not calculate it from the data) the degrees of freedom in the chi square test is 50. Using this value, we calculate a maximum chi squared statistic corresponding to the 0.05 significance level (using the GNU Scientific Library gsl_cdf_chisq_Qinv function) as 67.5048. Ten runs of the test for goodness of fit results in an average chi square statistic of 46.3228.
Outcome
Text
Since this is less than the rejection value of 67.5048 we can state with 95% confidence that the chi square statistic we measured is conistent with statistical fluctuations and that the ns-3 uniform random number generator does, in fact, generate uniformly distributed random numbers.
Data
The following is a histogram of the random numbers generated in one run of the test. Expected values are calulated based on the area of the cumulative distribution function corresponding to the histogram bin. This expected value is constant for the uniform distribution.
Craigdo 20:47, 17 April 2009 (UTC)
