RandomNumberGeneratorWrongPareto: Difference between revisions
No edit summary |
No edit summary |
||
| (4 intermediate revisions by the same user not shown) | |||
| Line 3: | Line 3: | ||
This test is an illustration of what might happen if a random number generator produced an incorrect distribution. The Pareto distribution takes a shape parameter. In this test, we intentionally generate a Pareto distribution with a slightly different shape parameter (alpha = 1.1) and compare it to a Pareto distribution with alpha = 1.0. | This test is an illustration of what might happen if a random number generator produced an incorrect distribution. The Pareto distribution takes a shape parameter. In this test, we intentionally generate a Pareto distribution with a slightly different shape parameter (alpha = 1.1) and compare it to a Pareto distribution with alpha = 1.0. | ||
Our goal is to show that a random number generator that generates an "incorrectly" shaped Pareto distribution fails the chi square test. | Our goal is to show that a random number generator that generates an "incorrectly" shaped Pareto distribution fails the chi square test for one with a "correctly" shaped Pareto distribution. | ||
=== Methodology === | === Methodology === | ||
| Line 13: | Line 13: | ||
=== Outcome === | === Outcome === | ||
Since | <font color="Red" size=5> Fail </font> | ||
Since 4695.05 is (massively) greater than the rejection value of 67.5048 we can state that the chi square statistic we measured is inconistent with statistical fluctuations and that the ns-3 Pareto random number generator, when given a shape parameter of 1.1, does '''not''' generate random numbers distributed according to the Pareto distribution with shape parameter 1.0. | |||
=== Data === | === Data === | ||
| Line 24: | Line 26: | ||
---- | ---- | ||
[[User:Craigdo|Craigdo]] | [[User:Craigdo|Craigdo]] 07:57, 30 May 2009 (UTC) | ||
Latest revision as of 07:57, 30 May 2009
Confused Random Number Generator
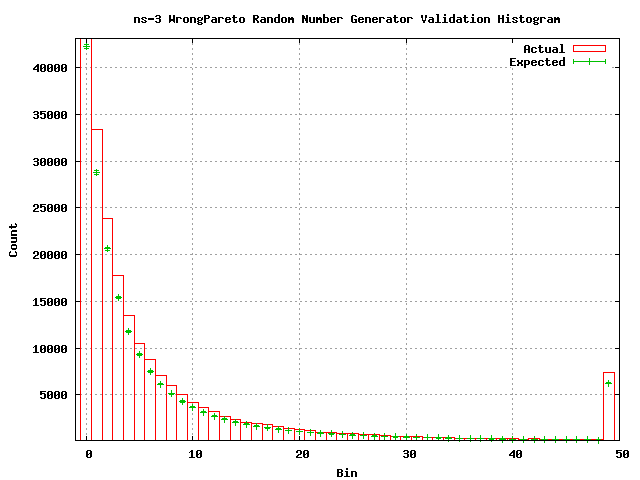
This test is an illustration of what might happen if a random number generator produced an incorrect distribution. The Pareto distribution takes a shape parameter. In this test, we intentionally generate a Pareto distribution with a slightly different shape parameter (alpha = 1.1) and compare it to a Pareto distribution with alpha = 1.0.
Our goal is to show that a random number generator that generates an "incorrectly" shaped Pareto distribution fails the chi square test for one with a "correctly" shaped Pareto distribution.
Methodology
We apply a chi square test of goodness of fit to evaluate the function. We create a histogram with 50 bins uniformly distributed across the range [1, 10) and expand the upper boundary bin to extend the range to +infinity. We generate 1 000 000 random numbers using the ParetoVariable with shape parameter = 1.1 which we assign to appropriate bins in the histogram.
Since the expected value is provided for us (we do not calculate it from the data) the degrees of freedom in the chi square test is 50. Using this value, we calculate a maximum chi squared statistic corresponding to the 0.05 significance level (using the GNU Scientific Library gsl_cdf_chisq_Qinv function) as 67.5048. We calculate the expected values using a shape parameter of alpha = 1.0. Ten runs of the test for goodness of fit results in an average chi square statistic of 4695.05.
Outcome
Fail
Since 4695.05 is (massively) greater than the rejection value of 67.5048 we can state that the chi square statistic we measured is inconistent with statistical fluctuations and that the ns-3 Pareto random number generator, when given a shape parameter of 1.1, does not generate random numbers distributed according to the Pareto distribution with shape parameter 1.0.
Data
The following is a histogram of the random numbers generated in one run of the test. Expected values are calulated based on the area of the cumulative distribution function corresponding to the histogram bin. This expected value is calculated using the GNU Scientific Library gsl_cdf_pareto_P function.
Note that the actual values correspond to a Pareto distribution of shape 1.1 and the expected values correspond to a Pareto distribution of shape 1.0.
Craigdo 07:57, 30 May 2009 (UTC)
